Abstract
Purpose: This effort describes a third-party performance evaluation of a novel, commercial, dual-armed Archimedean spiral array hyperthermia applicator. The applicator is analysed for its ability to couple efficiently into muscle equivalent phantom loads, operate over a broad bandwidth to help accommodate variable tissue properties and generate predictable and repeatable SAR contours that are adaptable to clinically probable disease shapes.
Materials and methods: Characterization of the applicator includes E-field and return-loss measurements in liquid muscle tissue-equivalent phantom, as well as comparison of ‘treatment-planning’ simulations of several possible array SAR patterns with measured SAR from non-coherently driven spiral array antennae.
Results: The applicator demonstrates a reasonably low return loss over a large bandwidth and the ability to generate a very uniform heating pattern. Ability to adjust SAR contours spatially to fit specific shapes is also demonstrated.
Conclusions: This device should prove a welcome addition to a currently limited set of superficial heating applicators to provide controllable heating of superficial tissue disease.
Introduction
Techniques for applying superficial hyperthermia utilizing microwave energy have been under development for many years, as recently reviewed in detail Citation[1–3]. First generation hyperthermia applicators utilize metal waveguide antennae Citation[4], Citation[5] which, aside from being physically bulky and heavy, tend to produce 50% SARMAX contours covering a lateral area significantly smaller than the applicator face Citation[3], Citation[6]. Thus, the effective field size (EFS), defined as the ratio of the 50% SARMAX contour area to the physical area of the radiating aperture face, is typically poor in these devices. Multi-aperture waveguide arrays, such as the Microtherm 1000 applicator (Labthermics Technologies, Inc., Champaign, IL) utilize an array of small dielectric loaded waveguide antennae to increase the EFS of the overall applicator and expand the treatment area Citation[7]. Similarly, the Lucite Cone Applicator (LCA) Citation[8] utilizes a novel flared horn applicator design loaded with a cone-shaped dielectric that gives an increased EFS compared to conventional waveguide antennae and allows the LCA to be used in multi-aperture arrays.
Although waveguide and horn-type antennae have been improved, they have the disadvantage of being fairly bulky and awkward to couple to contoured anatomy. The typical mechanical support arm and applicator size may lead to clinical difficulties such as patient discomfort and anxiety, as well as difficulty aligning the applicator for uniform heating of complex contoured tissue regions. More compact microwave applicators have been developed such as the Current Sheet Applicator (CSA) Citation[9], Citation[10], though conformability to contoured surfaces is still a limitation. Flexible printed circuit board (PCB) based microstrip applicators have been explored as alternative devices due to their light-weight and flexible construction which allows greater clinical versatility. They also tend to be simpler and less expensive to fabricate. Several microstrip antenna designs, such as the Microstrip-Microslot applicator Citation[11] and the Contact Flexible Microstrip Applicator (CFMA) Citation[12–15] have exhibited favourable characteristics for use in hyperthermia treatments such as light-weight, an EFS approaching the outer dimensions of the radiating aperture and the ability to form antenna arrays for increased heating area. The largest microstrip array applicator to date is the Conformal Microwave Array (CMA) Citation[2], Citation[3], Citation[16–20] which utilizes an array of Dual Concentric Conductor (DCC) antennae Citation[17], Citation[21–29]formed from thin, multi-layer flexible PCB material. The CMA applicator provides a light-weight and flexible design with the ability to conform to contoured anatomy and generate power deposition patterns tailored to irregular shaped areas of disease.
In addition to the above techniques, microstrip spiral antennae are another class of antennae that have characteristics desirable for use in hyperthermia. The spiral structure forms a continuously variable diameter antenna that is inherently broadband, improving the device's insensitivity to variations in tissue loading conditions Citation[26], Citation[30–32]. Several groups have explored the use of spiral antennae for hyperthermia. Montecchia Citation[33] gives a comparison of microstrip-type applicators (microstrip disk, microstrip annular-slot, microstrip spiral), with the spiral exhibiting favourable performance in terms of frequency independence, field uniformity and low stray field radiation. Samulski et al. Citation[32] report the use of spiral antennae in a variety of forms including single fixed antennae, multi-element array, and mechanically scanned single or double spiral antenna applicators. Lee et al. Citation[31] report the effective clinical use of an array of single-armed Archimedean spiral antennas in a 915 MHz ‘microwave blanket’. These efforts demonstrate the ability to use an array of appropriately spaced spiral antennae to increase the overall −3 dB power deposition area without an excessive amount of ripple. Ryan et al. Citation[34] investigated the design parameters for 433 MHz spiral antenna arrays, showing continuous −3 dB power deposition contours only when overlapping the spirals. The work also analysed differences in coherent and incoherent operation of the arrays with coherent operation demonstrating enhanced power deposition centrally and incoherent operation providing enhanced control and adjustability of the power deposition pattern peripherally.
In this work, a new hyperthermia applicator formed from a closely spaced array of dual-armed Archimedean spiral antennae is evaluated. The applicator is under commercial development for controllable application of 915 MHz microwaves to larger areas of superficial depth tissue. The device consists of spiral traces deposited on a 12 cm diameter plexiglass substrate with an integral water bolus. The structure is such that it can be utilized with a mechanical support-arm to maintain its position over the patient, but is considerably lighter in weight and more easily positioned near complex patient anatomy than larger waveguide applicators. This paper presents a third-party performance evaluation of the new applicator at the Microwave Hyperthermia Research Laboratory at the University of California San Francisco (UCSF). The device was analysed for its ability to couple energy efficiently into muscle-equivalent phantoms, generate a uniform power deposition pattern over a significant surface area relative to the applicator size and to be adjustable and predictable in heating clinically probable irregularly shaped disease.
Methods
Applicator
The applicator evaluated in this study is an SA-812, dual-armed Archimedean spiral array (BSD Medical Corp., Salt Lake City, UT), shown in . The device consists of eight dual-arm spiral copper traces deposited on a circular transparent plexiglass substrate. The array is configured as seven closely spaced 3.35 cm diameter spirals surrounding a central 4.05 cm diameter spiral. A water-bolus is integrated into the design by stretching a silicone rubber membrane (pillow) across the top of a plexiglass rim, as shown in . The outer diameter of the plexiglass form is 14 cm and the internal diameter of the water bolus coupled antenna array is 12 cm. No ground plane is required for the dual arm spiral structure, providing clear visibility of the tissue surface through the transparent applicator. The applicator has a total thickness (not including the mounting post or the coaxial connectors) of 3 cm, though the silicone rubber membrane may be extended up to 1.5 cm in front of the plastic rim by increasing the amount of de-ionized (DI) water in the bolus compartment.
Figure 1. Images of SA-812 hyperthermia applicator: (a) Front view, (b) Side view.
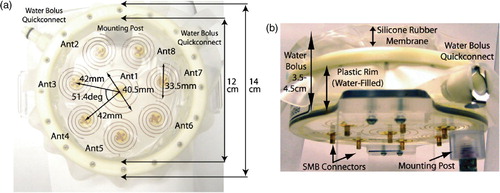
The antennae are fed with 915 MHz via SMB surface mount connectors, with the centre and outer conductors of the connector terminals attached to opposing arms of the dual arm spirals. Basic design principles for Archimedean spiral antennae dictate that the diameter of the spiral should be on the order of one-wavelength at the lowest desired operating frequency (specifically, greater than λ/π at the lower cut-off frequency Citation[35]). For the SA-812 applicator design, the spirals were constructed with diameters on the order of one wavelength in water at 915 MHz (∼3.7 cm) which is much smaller than one wavelength in air or plexiglass (∼33 cm and 22 cm, respectively). As such, for frequencies ∼915 MHz the antenna exhibits favourable radiation characteristics towards the water-filled side of the applicator and minimal back radiation through the plexiglass and air-filled space behind the applicator. The width of each spiral strip and the separation distance between strips was designed to provide a good impedance match in a 50 Ω system, as well as to allow good optical clarity through the spirals. A slightly larger spiral was used in the centre of the applicator to fill in possible energy null zones between the peripheral and central spirals while still having a minimal amount of back radiation.
SAR measurement system
The SAR measurement system utilized for this study consists of: a 64 × 46 × 33 cm plexiglass scantank filled with liquid, muscle-equivalent phantom; an E-field probe; a stepper-motor driven positioning system; a multi-channel 915 MHz generator system; and a custom software interface. An image of the SAR measurement system with the applicator mounted inside is shown in .
Figure 2. Images of the SA-812 antenna mounted in SAR measurement ‘scantank’: (a) Front view of x--y scan plane, (b) Side view showing E-field probe in liquid muscle tissue phantom and air backed applicator.
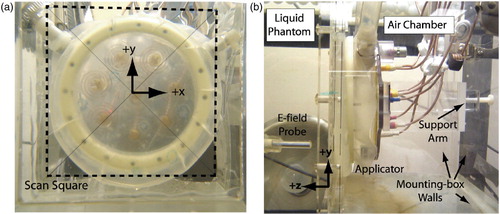
The scantank was filled with ethylene glycol-based liquid muscle tissue-equivalent phantom Citation[36], Citation[37] which had a dielectric constant of εr = 46.5 and a loss tangent of tanδ = 0.6 at 915 MHz. To mount the applicator in the tank, an air-filled 25 × 20 × 38 cm plexiglass mounting box was submerged in the larger liquid phantom scantank. The applicator mounting box had a 20 cm square hole removed from one side and a sheet of 0.2 mm thick mylar was glued over the hole to form a transmission window for directing the antenna radiation into the liquid phantom load. The applicator was held rigidly in place against the mylar window using a plastic support arm (). The support arm allowed precise adjustment of the applicator angle and position within the 15.5 × 15.5 cm scanning square drawn on the mylar window ().
The applicator was centred by pointing a laser level through the centre of the scan square and aligning it with the centre spiral. The skew in alignment of the antenna along the x- and y-axis was minimized by measuring the distance from the front face of the plastic mounting box to the plastic rim of the applicator at several points around the applicator's circumference. Repeated measurements showed that the skew would remain within a ±1° tolerance (relative to both the x- and y-axis) even after several iterations of disconnecting and reconnecting the antenna cables, as necessary for multiple independent test sequences. The water bolus was filled with DI water so that the latex membrane pressed firmly against the mylar window. The bolus was filled such that there was a total distance of 4 cm from the dual arm spiral antenna traces to the mylar window interface with the liquid ‘tissue’ load. This included 3 cm of DI water inside the plexiglass chamber and 1 cm extension of the silicone rubber membrane in front of the plexiglass rim to form a pillow shaped bolus for good contact with the mylar window. Care was taken to remove wrinkles in the silicone rubber membrane which would trap air between the spirals and the tissue load. Typical input power was 5 W per antenna, which allowed a stable coupling bolus temperature (<5°C increase in bolus temperature for the longest, multi-hour scan) with or without bolus circulation.
The applicator was powered with an 8-channel, 100 W per channel, 915 MHz RF generator (AMT1125, American Microwave Technologies, Canoga Park, CA). The power response of the generator was linearized and calibrated utilizing a power meter (HP438A, Hewlett Packard/Agilent Technologies, Palo Alto, CA), resulting in a typical accuracy of ±1% for all channels. A miniature E-field probe (Model E-010, Aprel Laboratories, Nepean, Ontario, Canada) was utilized to measure the relative strength of the electric field radiated by the spiral array at different positions in the scantank (see ). The isotropic E-field probe utilizes three diode detectors operating in the square law region to produce a single DC voltage output proportional to SAR in the liquid phantom Citation[36]. Probe positioning was done with a stepper motor system that allowed the probe to be scanned in the x-, y- and z-directions with a positioning repeatability of ∼±0.2 mm. Probe noise was typically ±0.5 mV for maximum measured signal voltages up to 4 V.
Custom software was written (utilizing National Instrument's LabView) for controlling RF generator power, SAR probe data acquisition and 3D motion of the scanning system. This allowed complete automation of the linearization and calibration of RF generators for accurate power control of each independently driven antenna and measurement of 3D SAR patterns within pre-specified volumes in the scantank.
Individual antenna measurements
First, the return-loss of each antenna was characterized from 0.5–1.5 GHz on a network analyser (Model 8753C Hewlett Packard Corp, Palo Alto, CA), with the applicator mounted in the scantank and radiating into the liquid muscle phantom as described previously. After characterizing the return-loss, SAR/E-field scans were conducted for each individual antenna of the applicator. Each antenna was measured with 5 W input power and the power deposition contours were characterized at a depth of z = 3 mm in the liquid phantom. The antenna radiation pattern was scanned over a 15.5 × 15.5 cm area (the scan square shown in ), with a step size of 4 mm. The eight individual antenna measurements provided a baseline for further characterization of SAR patterns possible using multiple non-coherently driven antennae.
Treatment planning
Multi-antenna operation of the applicator in non-coherent mode was approximated by summing the power deposition patterns obtained for each of the individual antennae. For incoherent operation, the effects of varying input power to each spiral were simulated by applying a simple scaling factor to each independent antenna response Citation[7]. The expression for the total normalized power deposition (SARtotal) is given by Equation (1),where P1, P2, etc. are scaling factors which simulate variation in the power levels into each antenna; SARAnt1, SARAnt2, etc. are matrices containing the measured power deposition levels; and SARMAX is a normalization factor to normalize SARtotal to a scale from 0 to 1.
A MATLAB routine was created which utilized Equation (1) to calculate and plot expected power deposition patterns for various user entered combinations of input power. This allowed rapid simulation of the expected power deposition pattern of the array, simplifying the process of adjusting input power levels to obtain specifically shaped SAR contours.
Applicator performance
Iterative treatment planning simulations were performed to determine a set of input power levels that would provide the most uniform 50% SARMAX deposition contour covering the largest possible surface area. After determining this optimally ‘uniform’ pattern, the accuracy of the simulation was verified by scantank measurements of the array using that calculated set of power inputs. For the array measurements, a 3D scan was conducted across the entire 15.5 × 15.5 cm scan window using 2.5 mm steps in the x-, y- and z-directions to a maximum depth of z = 20 mm in the liquid muscle phantom.
The applicator was also analysed for its ability to adapt to unique, non-uniform, clinically desirable treatment areas. A ‘C-shaped’ contour was formed by turning off the power to antennae 1, 3 and 4 and adjusting the input powers of the remaining antennae. Similarly, a ‘Donut-shaped’ contour was formed by adjusting the input powers of the outer antennae and turning off the centre antenna (antenna 1). Again, the power deposition patterns were simulated and formed with the treatment planning programme and compared to corresponding scantank measurements.
Results
Individual antenna measurements
shows the measured return-loss as a function of frequency for four of the eight spirals, with the applicator mounted in scanning position within the scantank. Above 760 MHz all of the antennae have a return-loss of −6.5 dB or better. The frequency of minimum return-loss varies depending on antenna size, with the smaller spirals (antennas 2–8) reaching a minimum just below 1.1 GHz and the larger spiral (antenna 1) reaching a minimum at ∼600 MHz. The return-loss at 915 MHz is −7.0 dB or better for all antennae, as shown in .
Figure 3. Return-loss of several antenna elements.
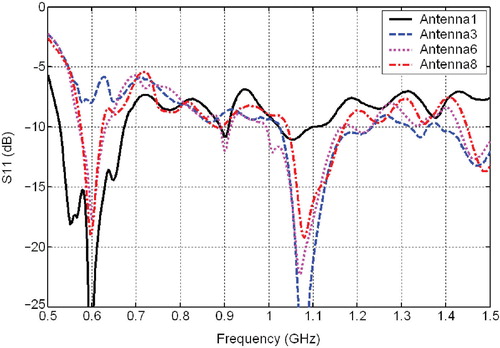
Table I. Individual antenna measurements at 915 MHz.
A sample of the SAR measurements conducted on individual antenna elements is shown in . Note that the contours are superimposed on a 1:1 scale image of the applicator mounted in the mounting-box, allowing accurate correlation of the SAR contours with the antenna positions. Perusal of shows the large effective field size (EFS) of the antennae, where:For this waterbolus thickness of 4 cm, the EFS of each antenna is much greater than 100% in this plane 3 mm deep in phantom muscle, reaching 180% for antenna 1 and an average of 216% for antennas 2–8, as shown in .
Figure 4. SAR scans in a plane 3 mm deep in muscle equivalent phantom under individual spiral antennae: (a) Antenna 1, (b) Antenna 3, (c) Antenna 6, (d) Antenna 8. SAR contours are superimposed over a 1:1 scale photograph of the applicator face aligned precisely with the antenna array scan data (±1 mm, ±1°). Four contour lines are shown in bold: 95% (purple), 75% (yellow), 50% (red) and the outer 25% contour (green). Other contour lines spaced evenly from 10% to 90% in 10% increments.
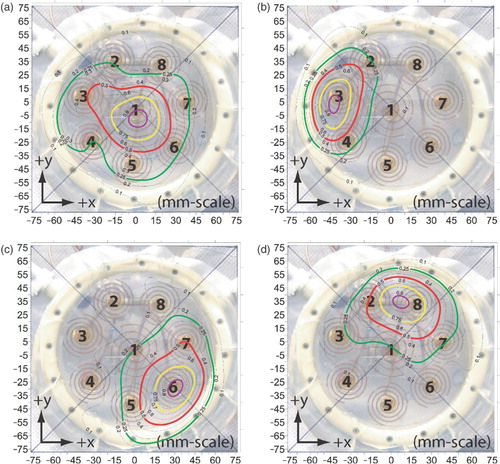
Another significant attribute observed in the antenna patterns is the skewing of the beam peak away from the spiral axis. The most significant skew is observed from antenna 8, which is 12.25 mm off-centre in the x-direction and 1.75 mm in the y-direction, giving it a 21° skew Citation[35] relative to a perfect, on-axis (centred) beam. On average, antennae 1–8 exhibited an average 2.75 mm x-axis offset, 3.10 mm y-axis offset, for a total skew of 10.7°.
Treatment planning and applicator performance
As previously described, individual antenna scans were scaled and combined in the treatment planning simulation to optimize the applicator for either uniform, ‘C’ shaped or centrally depressed ‘Donut’ shaped heating patterns. The input power combinations calculated by the treatment planning programme to generate these smooth patterns are shown in . Although treatment planning utilized individual antenna scan data only at z = 3 mm depth, it also gave a good prediction of SAR contour shape down to 1 cm depth, as will be shown.
Table II. Input power levels for three treatment configurations.
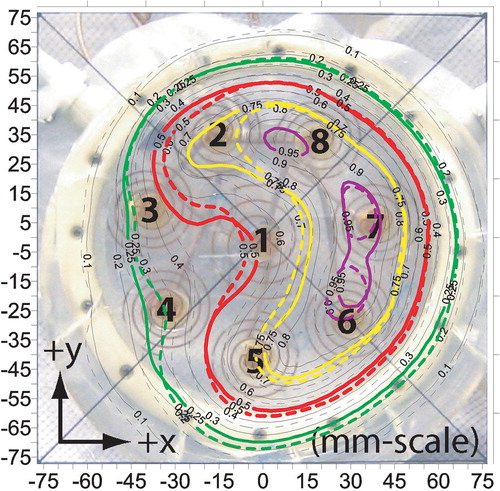
The power deposition contours for the ‘uniform’ treatment plan are shown in , which includes both the simulated treatment plan and experimentally measured SAR patterns at a depth of 3 mm. The 50% SARMAX contour (red-line) extends past the periphery of all eight spiral traces and nearly covers the entire bolus coupled antenna array out to the peripheral plastic support rim. The EFS, calculated based on the area of the applicator face (the area enclosed by the outer plastic rim), is 87%. Considering just the area underneath the eight spiral traces, the EFS is 112%. shows a wireframe view of the measured SAR distribution of and demonstrates that the applicator gives a very smooth (unrippled) response within the ≥50% SARMAX zone.
Figure 5. SAR pattern of spiral array driven with non-coherent 915 MHz sources and adjusted for optimum uniformity at z = 3 mm deep in muscle phantom: (a) Contours: treatment plan (dashed); measurement (solid), (b) Wireframe (measured). Four contour lines are shown in bold: 95% (purple), 75% (yellow), 50% (red) and the outer 25% contour (green). Other contour lines spaced evenly from 10% to 90% in 10% increments.
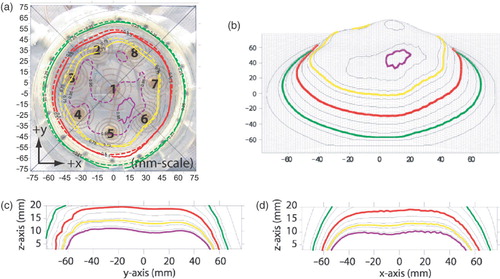
The uniform power scheme was also measured at a 1 cm depth, as shown in . The figure demonstrates that the contour shape at 1 cm depth is very similar to the corresponding 3 mm depth measurements. This similarity is highlighted by the fact that the treatment plan (which utilizes 3 mm depth data) can still predict the SAR contours at z = 1 cm fairly accurately, as shows. The EFS of the applicator at 1 cm depth is the same as that obtained at 3 mm, 87% considering the entire applicator face and 112% considering only the area underneath the spiral traces. show the measured SAR pattern as a function of depth in liquid muscle phantom for the ‘uniform’ pattern normalized to the maximum SAR probe reading of the distribution at 1 cm depth (z = 1 cm). As seen from , the applicator gives a relatively flat 50% contour covering a distance of ∼130 mm along the y-axis and 120 mm along the x-axis. The maximum depth of the 50% contour (along the z-axis) is close to 20 mm.
Figure 6. SAR pattern of spiral array driven with non-coherent 915 MHz sources and adjusted for optimum uniformity: (a) Contours, treatment plan (dashed) at z = 3 mm, measurement (solid) at z = 10 mm, (b) Wireframe (measured); (c) Cut through y--z plane (x = 0.25 mm); (d) Cut through x--z plane (y = 0.25 mm). All measured data normalized to peak SAR at 10 mm depth. Four contour lines are shown in bold: 95% (purple), 75% (yellow), 50% (red) and the outer 25% contour (green). Other contour lines spaced evenly from 10% to 90% in 10% increments.
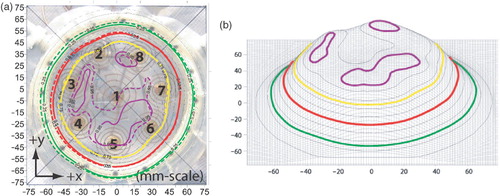
The treatment planning programme was also utilized to preplan the SAR pattern for two non-uniform shapes. A ‘C-shaped’ contour was developed by turning off antennaes 1, 3 and 4 and utilizing the input power combinations shown in . shows the resulting measured SAR pattern 5 mm deep in muscle phantom. For this case, the 75% SARMAX contour covers only a slight area over the antennae which are powered off (passing over the upper-right edge of antenna 1) and conforms to peripheral antennae 2, 5, 6, 7 and 8. Although demonstrating a matching C shape, the 50% SARMAX contour is enlarged and extends over much of the central antenna 1 area as well as a portion of antenna 3. Note that the treatment plan, which utilizes 3 mm data, also gives a good prediction of the ‘C-shaped’ response in the z = 5 mm plane.
Figure 7. SAR pattern of the spiral array applicator when adjusted according to the ‘C’ shape pre-plan of . Measured results (solid) are at z = 5 mm depth, treatment plan results (dashed) are at z = 3 mm depth. Four contour lines are shown in bold: 95% (purple), 75% (yellow), 50% (red) and the outer 25% contour (green). Other contour lines spaced evenly from 10% to 90% in 10% increments.
shows the measured SAR contours where the power levels have been adjusted to form a centrally depressed ‘Donut’ SAR pattern by turning off the central antenna 1 and making slight adjustments to the other antennae. Similar to the previous case (‘C-shape’), the 75% SARMAX contour circumscribes the powered off antenna 1 almost perfectly, but the minimum SARMAX obtained in the central depression of the pattern does not fall much below 60%. shows a comparison of the ‘uniform’, ‘C-shape’ and ‘Donut’ SAR patterns across the x-axis (y = 0.25 mm, z = 5 mm), demonstrating significant adjustability of heating pattern under the array.
Figure 8. SAR pattern of the spiral array applicator z = 5 mm deep in muscle phantom, when adjusted according to the ‘Donut’ shape pre-plan of . Five contour lines are shown in bold: 95% (purple), 75% (yellow), 61% (blue), 50% (red) and the outer 25% contour (green). 61% contour line shows the minimum central depression of the pattern.
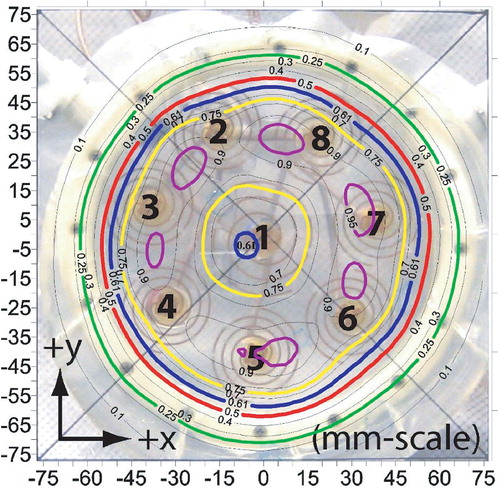
Figure 9. 1D comparison of spiral array applicator SAR patterns across the x-axis at z = 5 mm and y = 0.25 mm.
Discussion
This investigation was performed to characterize the heating capabilities of a novel microwave planar array applicator for clinical hyperthermia treatment of superficial tissue disease. There are several aspects of the SA-812 applicator that demonstrate its usefulness for clinical hyperthermia treatments. First, the unique single layer planar antenna construction with multiple radiating spiral traces deposited directly on a clear plexiglass substrate with no ground plane results in a compact and lightweight applicator. Second, the applicator design includes an integral waterbolus compartment with a soft and flexible silicone rubber membrane that can conform to irregular skin surfaces, supported within a sturdy outer plastic frame that facilitates mounting the applicator on a mechanical support arm. Thus, the applicator can be situated over the patient in areas that are difficult to reach with more bulky waveguide applicators (e.g. neck, axilla). Another unique advantage of the applicator is the transparent plexiglass frame which serves both as support structure and antenna substrate. The ability to see through the back of the applicator, spiral antennae, water bolus and onto the surface being treated should facilitate accurate alignment of the applicator over the target tissue and enable visual inspection during treatment to improve setup reliability and reduce the possibility of surface blisters or burns.
The inherently broadband spiral antennae exhibit a useable −6.5 dB or larger return-loss over a wide bandwidth (). Such broadband behaviour is superior to ‘resonant-mode’ devices such as the microstrip disk and microstrip annular slot Citation[33] and is advantageous since it implies a larger insensitivity to varying tissue load conditions Citation[31]. Measured return loss, as well as SAR contour shape, remained consistent even after several iterations of mounting and re-mounting the array applicator in the scan tank. Consistent applicator performance regardless of small positional differences is important for clinical use, where patient movement is likely to introduce such positional variation.
Key performance considerations for individual applicator antennae are the position, shape and area of the 50% SAR contours. As discussed in Kaiser Citation[35], dual-armed spiral antennae can be subjected to significant skewing of the beam. This skewing, caused by exciting a secondary radiation mode in the antenna due to feeding the antenna with an unbalanced coaxial line, can be as large as 30° Citation[35]. As demonstrates, however, skewing is less than 11° on average for the SA-812 applicator spirals. As a result of the minimal skew, the 50% SAR contours are well-centred under each antenna (). In terms of shape, an ideal Gaussian shaped beam would produce circularly shaped contours for each spiral. For the outer antennae, the contours tend to be slightly oval-shaped rather than circular, which can be attributed in part to the close proximity of the antennae to the outer plastic rim which tends to restrict the SAR pattern radially, as might be anticipated from previous waterbolus studies Citation[38]. The 50% contour for the centre spiral (antenna 1) is more circular than the outer spirals, with the exception of a slight protrusion that reaches towards antenna 3. This distortion in antenna 1, as well as distortion exhibited in the outer antennae, is likely caused by the close proximity of the antennae to each other. Sections of the spiral traces that lay close to traces of neighbouring spirals may be subject to cross-coupling that affects the contour shape. Resonance mode perturbations within the 3.5–4.5 cm thick waterbolus layer should also contribute to the distortion, as examined earlier Citation[36], Citation[39]. Even so, it is clear from the individual antenna EFS measurements presented in that each of the antennae covers a sufficient area by itself and that the combined array produces a nearly uniform pattern when driven with independent (non-coherent) sources, as demonstrated in . However, it appears the EFS of each spiral is more than sufficient for the given spacing of spirals, as evident from , which shows that the 50% contours of individual spirals overlap neighbouring spirals. Such overlap tends to reduce the spatial resolution of control over SAR, potentially limiting the ability to adapt SAR patterns to accommodate abnormally shaped disease regions.
Although oversize EFS and irregular skewing and distortion of the contour shape of individual antennae were not intentional features of the design, the deleterious impact on array heating patterns is not severe. In fact, for the scantank measurements presented in this study, which utilized a near maximum waterbolus thickness, the overall array SAR pattern is agreeably uniform and adjustable. Reducing the bolus thickness could serve to reduce the EFS by getting closer to the antenna near field Citation[31], Citation[38], as well as reduce distortions caused by thick water bolus effects Citation[36], Citation[39]. For the experiments conducted in this study, the near maximum 4 cm bolus thickness was necessary to get a flat, unwrinkled interface between the silicone rubber bolus membrane and mylar scan window. In a clinical environment, where the bolus membrane will be coupled to a soft and contoured tissue surface, thinner bolus layers should be achievable, especially over concave surfaces. Observation of also brings the physical antenna spacing into question. Upon first glance, it seems that it would be advantageous to increase the relative antenna spacing, presumably by moving antennas 2–8 radially outward and increasing the overall applicator diameter slightly. This would have the effect of generating individual antenna patterns with 50% SARMAX contours with less overlap. However, the applicator was designed to operate both in coherent and incoherent mode Citation[40] and the optimal antenna spacing would likely be different for these two excitation schemes. Although outside the scope of this study, coherent operation was included in the applicator design as a mode of operation that may provide additional operational control using phase adjustment or phase rotation schemes. Further testing is necessary to evaluate the applicator in the coherent mode of operation, although generally the non-coherent mode has been preferable for uniform heating of large superficial tissue regions using antenna arrays Citation[3].
Regardless of imperfect antenna spacing and slightly smeared and skewed individual SAR patterns, and represent a successful demonstration of the very uniform SAR pattern possible with this array applicator when the spirals are driven non-coherently with an appropriate distribution of power levels. The EFS of the array applicator is very close to 100% of the applicator face area, which is favourable compared to conventional microwave applicator designs Citation[1–3]. It is clear from observation of and that the applicator has the ability to provide uniform heating patterns during hyperthermia treatments of <12 cm diameter regions. also demonstrates the very good agreement between measured and pre-planned SAR distributions at 3 mm depth. Furthermore, and show that pre-planning with 3 mm individual scan data also gives a reasonable prediction of the SAR contour shape for depths down to 1 cm. Overall, the measurements demonstrate that treatment planning simulations are an accurate method of pre-configuring specific patterns for the spiral array and provide confidence that the plan will give good estimates for therapy. Integration of this treatment planning programme into the clinical system will provide a fast and useful approach for determining starting power levels for hyperthermia treatments.
In terms of adaptability, and demonstrate the ability of the applicator to adjust SAR patterns and thus accommodate non-circular tumour targets. Although the 75% contours conform well around the area of powered-on antennae, the 50% contours overlap portions of the powered-off antennae. This phenomenon can be attributed to the large EFS demonstrated in the individual antenna patterns at this distance from the antenna. Even so, the ability of the applicator to produce shaped patterns across the 12 cm diameter heating area is clearly evident from the adjusted ‘uniform’, ‘Donut’ and ‘C-shaped’ patterns (). Overall, the applicator appears useful for well-controlled heating of up to 12 cm diameter tissue regions <2 cm deep.
Conclusion
In this work, a new planar array applicator for microwave hyperthermia treatment was evaluated to assess the uniformity and adjustability of SAR patterns possible in muscle tissue. In terms of physical attributes, the lightweight and compact construction of the transparent applicator offers several advantages for use in a clinical environment. Individual antenna elements have a dual-armed, Archimedean spiral configuration that exhibits favourable broadband behaviour and good return loss characteristics which should reduce sensitivity to variable tissue loading. The applicator demonstrates the ability to generate uniform heating of 12 cm diameter regions when all antennae are driven incoherently. Furthermore, the applicator demonstrates a reasonable ability to conform SAR to fit irregularly shaped tumours by utilizing appropriate power combinations for the individual antennae. Power levels for the incoherently driven spirals may be pre-planned and overall heating patterns of the array predicted accurately with a simple and fast pre-treatment planning programme. This multi-element array applicator should prove to be a welcome addition to the current limited set of superficial heating applicators for providing controllable heating of superficial tissue disease <2 cm deep.
Related Research Data
References
- Lee ER. Electromagnetic superficial heating technology. Thermoradiotherapy and thermochemotherapy, MH Seegenschmiedt, P Fessenden, CC Vernon. Springer-Verlag, HeidelbergBerlin 1995; 193–217
- Stauffer PR. Evolving technology for thermal therapy of cancer. Int J Hyperthermia 2005; 21: 731–744
- Stauffer PR. Thermal therapy techniques for skin and superficial tissue disease. A critical review, matching the energy source to the clinical need, TP Ryan. SPIE Optical Engineering Press, Bellingham, WA 2000; 327–367
- Chou CK, McDougall JA, Chan KW, Luk KH. Evaluation of captive bolus applicators. Med Phys 1990; 17: 705–709
- Chan KW, McDougall JA, Chou CK. FDTD simulations of Clini-Therm applicators on inhomogeneous planar tissue models. Int J Hyperthermia 1995; 11: 809–820
- Straube WL, Myerson RJ, Emami B, Leybovich LB. SAR patterns of external 915 MHz microwave applicators. Int J Hyperthermia 1990; 6: 665–670
- Diederich CJ, Stauffer PR. Pre-clinical evaluation of a microwave planar array applicator for superficial hyperthermia. Int J Hyperthermia 1993; 9: 227–246
- Van Rhoon GC, Rietveld PJM, van der Zee J. A 433 MHz Lucite cone waveguide applicator for superficial hyperthermia. Int J Hyperthermia 1998; 14: 13–27
- Gopal MK, Cetas TC. Current sheet applicators for clinical microwave hyperthermia. IEEE Trans Microwave Theory Tech 1993; 41: 431–437
- Hand JW, Vernon CC, Prior MV, Forse GR. Current sheet applicator arrays for superficial hyperthermia. Hyperthermic oncology 1992, E Gerner, T Cetas. Arizona Board of Regents, Tucson 1993; 2: 193–197
- Michel C, Cresson P-Y, Dubois L, Chive M, Pribetich J. Design and modeling of microstrip-microslot applicators with several patches and apertures for microwave hyperthermia. Microwave Optic Tech Lett 1997; 14: 121–126
- Gelvich EA, Mazokhin VN, Troshin II. An attempt at quantitative specification of SAR distribution homogeneity. Int J Hyperthermia 1996; 12: 431–436
- Lamaitre G, van Dijk JDP, Gelvich EA, Wiersma J, Schneider CJ. SAR characteristics of three types of contact flexible microstrip applicators for superficial hyperthermia. Int J Hyperthermia 1996; 12: 255–269
- Lee WM, Gelvich EA, van der Baan P, Mazokhin VN, van Rhoon GC. Assessment of the performance characteristics of a prototype 12-element capacitive contact flexible microstrip applicator (CFMA-12) for superficial hyperthermia. Int J Hyperthermia 2006; 20: 607–624
- Gelvich EA, Mazokhin VN. Contact flexible microstrip applicators (CFMA) in a range from microwaves up to short waves. IEEE Trans Biomed Eng 2002; 49: 1015–1023
- Stauffer P, Schlorff J, Taschereau R, Juang T, Neuman D, Maccarini P, Pouliot J, Hsu J. Combination applicator for simultaneous heat and radiation. Int Conf IEEE Eng Med Biol Soc 2004; 4
- Stauffer PR, Diederich CJ, Bozzo D. Conformal array microwave applicator for superficial hyperthermia of large contoured surfaces. IEEE MTT-S Int Microwave Symp Dig 1994; 1: 531–534
- Stauffer PR, Jacobsen S, Neuman D. Microwave array applicator for radiometry controlled superficial hyperthermia. Thermal treatment of tissue: Energy delivery and assessment, TP Ryan. Proceedings of SPIE, San Jose 2001; 19–29
- Stauffer PR, Diederich CJ, Pouliot J. Thermal therapy for cancer. Brachytherapy physics. 2nd, BR Thomadsen, MJ Rivard, WM Butler. Joint AAPM/ABS Summer School. 2005; 901–932
- Stauffer PR, Schlorff JL, Juang T, Neuman DG, Johnson JE, Maccarini PF, Pouliot J. Progress on system for applying simultaneous heat and brachytherapy to large-area surface disease. SPIE BIOS. 2005
- Jacobsen S, Stauffer PR, Neuman DG. Dual-mode antenna design for microwave heating and noninvasive thermometry of superficial tissue disease. IEEE Trans Biomed Eng 2000; 47: 1500–1509
- Stauffer PR, Leoncini M, Manfrini V, Gentili GB, Diederich CJ, Bozzo D. Dual concentric conductor radiator for microwave hyperthermia with improved field uniformity to periphery of aperture. IEICE Trans Comm 1995; E78-B: 826–835
- Rossetto F. Stauffer PR. Effect of complex bolus-tissue load configurations on SAR distributions from dual concentric conductor applicators. IEEE Trans Biomed Eng 1999; 46: 1310–1319
- Rossetto F, Stauffer PR, Manfrini V, Diederich CJ, Biffi Gentili G. Effect of practical layered dielectric loads on SAR patterns from dual concentric conductor microstrip antennas. Int J Hyperthermia 1998; 14: 513–534
- Maccarini PF, Rolfsnes HO, Johnson J, Neuman DG, Jacobsen S, Stauffer PR. Electromagnetic optimization of dual mode antennas for radiometry controlled heating of superficial tissue. Proceedings of SPIE. 2005
- Maccarini PF, Rolfsnes HO, Neuman DG, Stauffer PR. Optimization of a dual concentric conductor antenna for superficial hyperthermia applications. International Conference of the IEEE Engineering in Medicine and Biology Society. 2004
- Stauffer PR, Rossetto F, Leoncini M, Gentilli GB. Radiation patterns of dual concentric conductor microstrip antennas for superficial hyperthermia. IEEE Trans Biomed Eng 1998; 45: 605–613
- Rossetto F, Stauffer PR. Theoretical characterization of dual concentric conductor microwave array applicators for hyperthermia at 433 MHz. Int J Hyperthermia 2001; 17: 258–270
- Rossetto F, Diederich CJ, Stauffer PR. Thermal and SAR characterization of multielement dual concentric conductor microwave applicators for hyperthermia, a theoretical investigation. Med Phys 2000; 27: 745–753
- Jacobsen S, Rolfsnes HO, Stauffer PR. Characteristics of microstrip muscle-loaded single-arm archimedean spiral antennas as investigated by FDTD numerical computations. IEEE Trans Biomed Eng 2005; 52: 321–330
- Lee ER, Wilsey TR, Tarczy-Hornoch P, Kapp DS, Fessenden P, Lohrbach AW, Prinoas SD. Body conformable 915 MHz microstrip array applicators for large surface area hyperthermia. IEEE Trans Biomed Eng 1992; 39: 470–483
- Samulski TV, Fessenden P, Lee ER, Kapp DS, Tanabe E, McEuen A. Spiral microstrip hyperthermia applicators: Technical design and clinical performance. Int J Radiat Oncol Biol Phys 1990; 18: 233–242
- Montecchia F. Microstrip-antenna design for hyperthermia treatment of superficial tumors. IEEE Trans Biomed Eng 1992; 39: 580–588
- Ryan TP, Backus VL, Coughlin CT. Large stationary microstrip arrays for superficial microwave hyperthermia at 433 MHz: SAR analysis and clinical data. Int J Hyperthermia 1995; 11: 187–209
- Kaiser JA. The Archimedean two-wire spiral antenna. IRE Trans Antennas Propag 1960; 8: 312–323
- Neuman DG, Stauffer PR, Jacobsen S, Rossetto F. SAR pattern perturbations from resonance effects in water bolus layers used with superficial microwave hyperthermia applicators. Int J Hyperthermia 2002; 18: 180–193
- Erb J. Simulation konstruktion and characterizierung miniaturisierter interstitieller mikrowellenantennem fur die behand-lung miligner tumoren. University of Erlangen. 1995
- de Bruijne M, Samaras T, Bakker J, van Rhoon G. Effects of waterbolus size, shape and configuration on the SAR distribution pattern of the Lucite cone applicator. Int J Hyperthermia 2006; 22: 15–28
- Gelvich EA, Mazokhin VN. Resonance effects in applicator water boluses and their influence on SAR distribution patterns. Int J Hyperthermia 2000; 16: 113–128
- BSD SA-812 Hyperthermia Applicator (Manual). BSD Medical Corporation, Salt Lake City, Utah 2005