Abstract
Purpose: To demonstrate the benefits of treatment planning in superficial hyperthermia.
Materials and methods: Five patient cases are presented, in which treatment planning was applied to troubleshoot treatment-limiting hotspots, to select the optimum applicator type and orientation, to assess the risk associated with metallic implants, to assess the feasibility of heating a deeper seated tumour, and to analyse the effective SAR coverage resulting from arrays of multiple incoherent applicators. FDTD simulation tools were used to investigate treatment options, either based on segmented or simplified anatomies.
Results: The background, approach and model implementation are presented per case. SAR cross-sections, profiles and isosurfaces are visualized to predict the effective SAR coverage of the target and the location of the maximum power absorption. In addition, the followed treatment strategy and the implications for the clinical treatment are given: for example, higher temperatures, relief of treatment limiting hot-spots or increased power input.
Conclusions: Treatment planning in superficial hyperthermia can be applied to improve clinical routine. Its application supports the selection of the optimum technique in non-standard cases, leading to direct benefits for the patient. In addition, treatment planning has shown to be an excellent tool for education and training for hyperthermia technicians and physicians.
Introduction
Hyperthermia treatment planning tools have a significant potential to further improve the quality of hyperthermia treatments. The principal advantage of treatment planning systems (TPS) is that they provide insight in to the 3-D absorbed power (SAR) and temperature distributions that could not be observed otherwise. The fields of application of TPS are manifold Citation[1–5]. TPSs are an important tool to identify optimal settings for a specific patient anatomy, in anticipation of a hyperthermia (HT) treatment. During treatments, a TPS may support the steering task by complementing the sparse clinical thermometry, and by visualizing the effect of the applicator settings on the SAR or heating patterns, before they are actually applied to the patient. Other clinical fields of application are post-treatment troubleshooting of acute limiting factors, evaluation of the clinical indications for hyperthermia treatments, development of standard settings for certain tumour locations, definition of contraindications for HT, and investigation of feasibility to heat a specific target volume. For research purposes, TPSs are a valuable tool to evaluate thermal goals and predictive parameters. Finally, TPSs may aid the technical improvement and design of antenna systems Citation[6–9].
Over the years, the development of various dedicated 3-D hyperthermia TPSs Citation[6], Citation[10–13] has evolved in the clinical application of hyperthermia treatment planning at multiple centres Citation[4], Citation[14–15]. To date, the focus in hyperthermia treatment planning and its clinical application has primarily been on deep hyperthermia. To the best of our knowledge, only Kumaradas and Sherar Citation[16] have reported the application of 3-D treatment planning tools to a patient case in superficial hyperthermia (SHT). The large number of degrees of freedom (phases and amplitudes) in phased-array systems probably explains this focus on deep hyperthermia: optimization modules in TPSs may provide settings resulting in maximum target heating without unwanted side effects, which can hardly be found intuitively. By contrast, superficial hyperthermia applicator systems use non-coherent power sources, and in principle are easier to control. Nevertheless, treatment planning in SHT may prove to be very useful.
The goal of this paper is to demonstrate the benefits of treatment planning in SHT. The main benefits are the enhanced insight in the SAR coverage of the target in specific anatomies, and adaptation of the heating strategy for a specific patient. In addition, treatment plans of clinical cases or abstractions of clinical cases provide excellent means for education for the hyperthermia team. Five cases of patients with non-standard treatment fields are presented, in which treatment-planning tools were successfully used to support decision making with regard to the treatment strategy.
Materials and methods
Applicator system
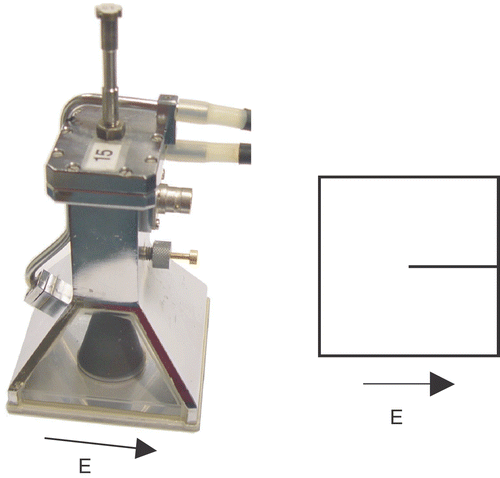
The Lucite cone applicator (LCA) is the standard applicator for SHT at the Rotterdam hyperthermia unit. The LCA is a water-filled, 434-MHz horn applicator featuring Lucite windows and a PVC cone to enhance its effective field size. The LCA and the Lucite applicator (LA) are evolutions of the conventional waveguide applicator (CWA) Citation[17]. A picture of an LCA, its principle E-field direction, and its symbolic representation are given in . The dimensions of the footprint of a single applicator are 10 × 10 cm2. The applicators are always used in combination with a circulating water bolus Citation[18–19]. Up to six applicators, each with an independent power supply can be combined in an array to cover larger treatment fields.
Model implementation
Modelling of the 3-D SAR distributions was performed using the finite-difference time-domain (FDTD) method. The models included one or multiple horn applicators (LCA/LA/CWA), a water bolus, and the patient anatomy or abstracted anatomy. The SAR distributions were computed in the SEMCAD FDTD simulation environment (versions 1.8 and X) Citation[20]. This tool features graded grids, such that the details of the applicator (e.g. the thin walls, source wire and flared horn) can be accurately resolved in the grid implementation of the model. While in all media at least 20 cells per wavelength were applied, the grid was refined to ≤2 mm in the applicator volume, and to ≤1 mm near the source. The computational domain was terminated with uniaxial perfectly matched layer (UPML) or Mur 2nd order boundaries. The dielectric properties of the tissues and applicator materials are listed in Citation[21–24]. The feasibility of simulating the LCA, LA and CWA horn applicators in a rectilinear grid using the FDTD method was demonstrated by Samaras et al. Citation[24]. A quantitative validation of the current FDTD implementation of the LCA was performed by De Bruijne et al. Citation[25].
Table I. Properties of the tissues and applicator materials applied in the models.
In homogeneous tissue configurations (case 4), the SAR distributions were normalized to the maximum SAR. In inhomogeneous tissue configurations, 100% SAR was the maximum of the 10-g spatial peak averaged (IEEE-1529) SAR distribution, to prevent effects of local outliers (cases 1 and 3), or SAR was determined per 1 W of source power (cases 2 and 5).
Cases
To demonstrate the benefits of treatment planning in SHT, five cases are presented in this work. The cases address: (1) troubleshooting of treatment-limiting hotspots; (2) treatment of a patient with implants; (3) heating of a deeper-seated tumour; (4) targeting a saddle-shaped neck field; and (5) analysis of the effective SAR coverage resulting from a multi-applicator array. The background, approach, model implementation and the results are described per case in a separate section. The focus is on the selection of the appropriate technique in non-standard cases to obtain an optimum treatment strategy; the effect on clinical response is beyond the scope of this work. The cases are followed by a general discussion and conclusion.
Case 1: Melanoma on lower leg
An 89-year-old woman with three melanoma lesions on the lower leg () was referred for irradiation (3 × 8 Gy, 1/wk) plus hyperthermia (1 h/wk). The first hyperthermia treatment was problematic: the power input was greatly limited by pain from hotspots at the side of the leg. Consequently, tumour temperatures remained low (mean <40°C) and the treatment was adjourned after 45 min. Treatment planning was used to analyse the problem and to propose an alternative treatment strategy. The parameters under study were: the applicator type and the direction of the E-field. Three applicators were considered: the Lucite cone applicator (LCA), the Lucite applicator (LA), and the conventional waveguide applicator (CWA). In addition, E-field directions parallel and perpendicular to the lower leg were studied.
Figure 2. (a) Melanoma lesions. (b–c) Model implementation: LCA applicator and (b) simplified anatomy, or (c) segmented anatomy (water bolus not shown).
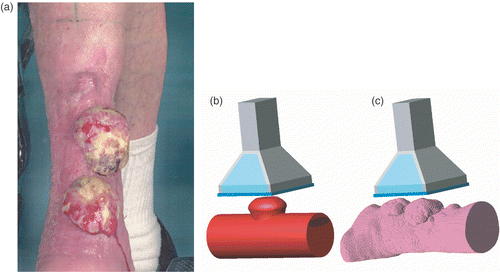
As a first step, a simplified model consisting of a muscle cylinder, an elliptic bone and a tumour knob was implemented (see ). At a later stage, CT images of the lower leg were available; these were segmented using basic Hounsfield unit thresholding, and implemented in the model (). The analysis focused on the largest (central) melanoma lesion. The power absorption pattern resulting from the six combinations of applicator type and orientation were computed and visualized. The selection of applicator type and orientation was based on visual inspection of the SAR data volumes.
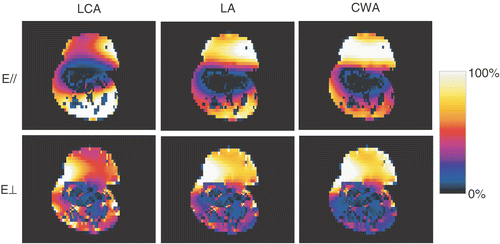
The results from the simplified anatomy are shown in . For the set-up of the first treatment (LCA, E-field parallel), the simulated SAR distribution indicates hotspots at the side of the lower leg, identical to the location where the patient indicated pain during the treatment. In addition, the model indicates low power absorption in the centre of the tumour, in correspondence with the low measured temperatures during the first HT treatment. The results show that the hotspots are less severe for the LA, and practically disappear for the CWA. The maximum SAR coverage of the tumour was clearly observed for the CWA with the E-field perpendicular to the lower leg. However, this configuration also possibly involves hotspots at the skin–tumour and tumour–bone interfaces. The CWA with the E-field parallel to the lower leg was considered the preferable configuration. Here, the maximum power deposition is at the tumour base, where high perfusion was expected, while no hotspots at the tumour–skin interface are expected. It was anticipated that the necrotic mass at the tumour top would be sufficiently heated by thermal conduction.
Figure 3. Results for the simplified anatomy: absorbed power in a transverse cross-section through the tumour, for three different applicators (LCA, LA, CWA) and two orientations of the electric field (parallel (//) or perpendicular (⊥) to the lower leg).
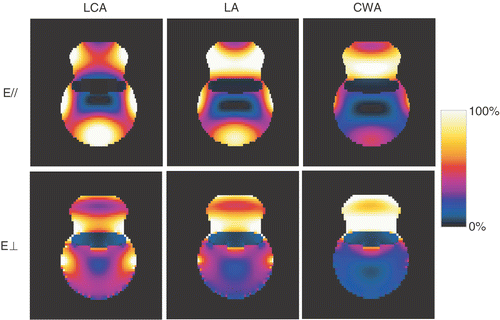
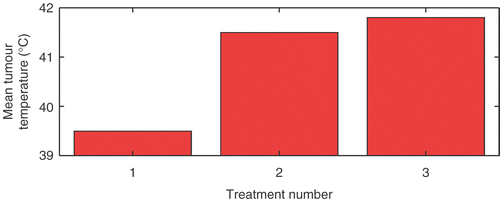
For the segmented anatomy the simulated power absorption patterns are shown in . These results confirmed that for the CWA applicator, with the E-field directed parallel to the lower leg, there is an optimal power absorption in the tumour and no hotspots at the skin. Based on the treatment planning, the HT treatment was continued using this configuration, with good results: during the second and third HT treatment, the tumour temperatures were significantly higher (), the treatment sessions were completed, and the patient reported no hotspots.
Case 2: Sternum cerclage
Implants are often considered a contraindication for hyperthermia. Depending on the type of implant, several interactions with the E-field are possible. In general we may discriminate three types: metallic implants, active implantable medical devices, and other (non-metallic and passive) implants. In the vicinity of metallic devices such as artificial hips, surgical clips and wires, intrauterine devices, screws, etc., this interaction may lead to local SAR enhancement, and the interaction will depend highly on the electrical dimensions of the device, and the strength and direction of the E-field. So far, published investigations have been limited to the risks associated with metallic surgical clips. Lee et al. Citation[26] concluded that in an EM field metallic objects that have dimensions much shorter than the wavelength can cause significant changes in the power deposition. Boll et al. Citation[27] reported that radio-frequency ablation can be safely performed in patients with implanted clips, if a certain distance from the RF electrode is kept. For active implantable medical devices (like cardiac pacemakers) the risk of malfunctioning will depend on its electromagnetic compatibility (EMC). However, this type of susceptible implant is generally considered a contraindication for hyperthermia. For other implants, like silicone implants and Port-A-Cath systems, interaction with the E-field may lead to enhanced risk of hotspot formation, and there may be a health risk associated with, for example, deterioration of the implant or leakage.
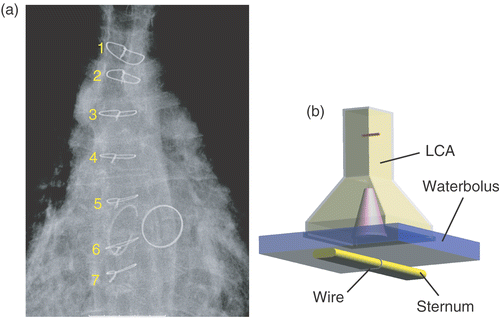
In this case a patient was referred for re-irradiation plus hyperthermia for breast cancer recurrences following a radical mastectomy. A complicating factor was that the patient had a sternum cerclage after open-heart surgery. The cerclage wires were suspected to behave like primitive loop antennas in the human body. Since the literature provides no guidelines for metallic implants other than surgical clips, we studied the possible effects of cerclage wires in a model to see if the patient could be treated with cerclage wires, or that removal of the wires should be considered. The goal in this case was to assess whether cerclage wires are a strict contraindication for SHT treatment. From the X-thorax of the patient () it followed that seven cerclage wires had been placed around the sternum. Because no CT data were available, general dimensions were assessed and the sternum cerclage was simplified to a flat bone structure (width 30 mm, height 10 mm, round edges) with a single metallic ring (cross-section 1 mm2) embedded in muscle tissue, 3 mm below the surface (see ). The LCA and water bolus were placed centrally above the ring. In total, four configurations were simulated. To test minimum and maximum excitation of the wire loop, E-field directions parallel and perpendicular to the sternum were studied. Furthermore, to assess the risk of hotspots induced by sternum cerclage, the SAR distribution resulting from a sternum with a perfectly electrically conducting ring was compared to that of a sternum without a ring for both field directions.
Figure 6. (a) X-thorax of the patient in case 2. The cerclage wires are numbered 1–7. The deeper-seated heart valves are also visible. (b) Overview of the abstract model: LCA with a water bolus placed above an elliptic bone with a metallic ring (muscle volume not shown).
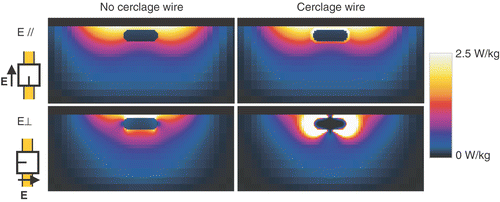
The SAR cross-sections through the sternum at the position of the ring are shown in . The simulation results show that for an E-field direction parallel to the sternum, a conducting wire hardly changes the SAR distribution in the volume. However, for an E-field direction perpendicular to the sternum, the addition of a cerclage wire results in much higher SAR near the sternum, and a 35-fold increase of the maximum SAR (4 without vs. 139 W/kg with ring, per 1 W of source power). Based on the calculations, it was concluded that cerclage wires present no significant contraindication for SHT, provided that the E-field is parallel to the sternum. For E-field directions perpendicular to the sternum, severe hotspots near cerclage wires should be expected.
Figure 7. SAR cross-sections for a sternum without (left) and with a sternum cerclage wire (right), for E-field directions parallel (top, E//), and perpendicular (bottom, E⊥) to the sternum.
During the treatments with the advised configuration, the power was increased cautiously. It appeared that the total power input was not limited by pain complaints at the sternum (total end power during the 4 treatments: 220, 300, 260, 275 W; 6 applicators), and normal therapeutic temperatures were measured (steady state mean interstitial temperatures of 41.4, 40.7, 41.1 and 42.1°C). The patient did, however, report pain complaints near the sternum, when the E-field direction of the two LCAs above the sternum was perpendicular. These observations are in line with the modelling results.
Case 3: Tumour covered by thick fat layer
A 47-year-old woman with a history of locally advanced mamma carcinoma presented with an infraclavicular locoregional recurrence, mimicking a brachial plexus lesion. She was referred for re-irradiation (8 × 4 Gy) plus hyperthermia. From the transverse CT slice shown in , it followed that the recurrence lay at 3.7–5.4 cm below the skin, which is beyond the LCA's empirically derived standard maximum target volume depth of 4 cm. However, from the CT data it also became clear that the tumour was covered by an above-average fat layer (thickness ∼2.9 cm). Because the effective conductivity of fatty tissue is low compared with muscle and tumour tissue (see ), it could be anticipated that power absorption from the E-field at the depth of the tumour was still significant. Also, research by Van der Gaag et al. Citation[19] revealed that in a three-layer anatomy (skin-fat-muscle) an increase in the fat layer thickness moves the heat focus to a greater depth, if sufficient water bolus cooling is applied at the skin. A model was set up to evaluate the SAR coverage of the tumour, and to consider treatment of the patient. A precondition to start HT treatments was the full enclosure of the tumour by the 25% SAR isosurface. This criterion is based on results by Myerson et al. Citation[28] and Lee et al. Citation[29], who demonstrated that coverage by the applicator's 25% iso-SAR contour was the most important factor for predicting treatment outcome in recurrent breast carcinoma of the chest wall.
Figure 8. Transverse CT slice through the centre of the tumour. The tumour outline is indicated with a contour. The arrows show the tumour depth (3.7–5.4 cm), and the thickness of the fat layer (2.9 cm).
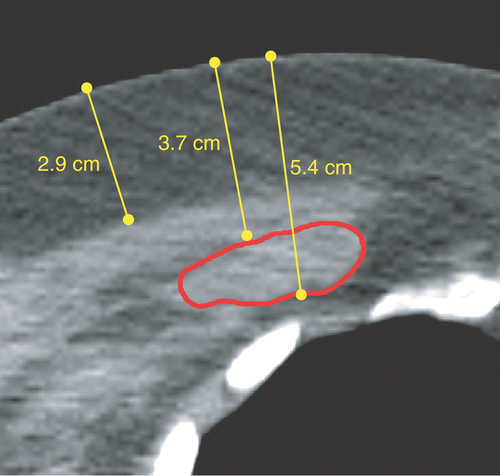
The CT dataset of the thorax was segmented in the tissue types fat, muscle, tumour, bone and lung. In the model, the LCA was aligned centrally above the tumour, with a water bolus thickness of at least 1 cm (see ). Orientations of the E-field parallel and perpendicular to the median plane were investigated. The 25%, 50% and 75% SAR isosurfaces were visualized.
Figure 9. (a) Position of the LCA centrally above the tumour. Here, the E-field direction is perpendicular to the body axis. (b) Normalized SAR profile centrally below the applicator (E-field direction perpendicular), showing the main SAR peak at the muscle and tumour.
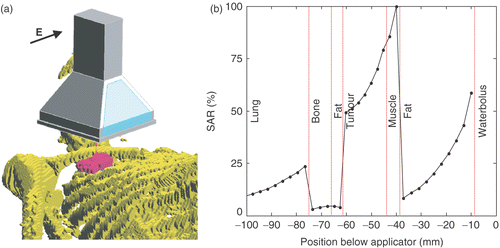
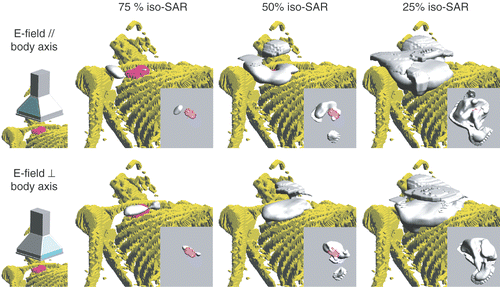
The SAR volumes resulting from E-fields parallel with and perpendicular to the longitudinal axis are depicted in . shows that, in accordance with the expectations, the peak SAR values were located in the muscle/tumour layer, with a secondary peak at the body surface. For the E-field parallel (, top row), the main SAR focus was located at the shoulder, possibly leading to a power-limiting hotspot. Also, the tumour area was not fully covered by the 25% SAR volume. By contrast, for the E-field perpendicular (, bottom row), the main SAR focus was at the tumour surface, while the 25% SAR volume did fully cover the tumour. Based on these observations, it was decided to treat this patient with the E-field direction perpendicular to the longitudinal axis.
Figure 10. SAR coverage for E-field directions parallel (top) and perpendicular (bottom) to the body axis. The 75%, 50%, and 25% iso-SAR surfaces are depicted. The insets show the inferior view of the tumour's SAR coverage.
Two interstitial catheters were placed by ultrasound guidance to measure the temperature at two locations in the tumour at depth, about 1.5 cm apart. The measured temperatures are listed in . During the first treatment, no therapeutic temperatures (T < 40°C) were measured intratumourally owing to too conservative a power build-up. The next treatments showed that therapeutic temperatures could be reached in the tumour. However, inhomogeneity was substantial: high tumour temperatures (steady-state mean 40.7–43.6°C) were measured by one probe, while the temperatures in the other lagged behind by 2–4°C. This temperature inhomogeneity is probably caused by distinct differences in local perfusion.
Table II. Mean (range) steady-state temperatures measured in the tumour of case 3.
Case 4: SAR coverage of a neck field
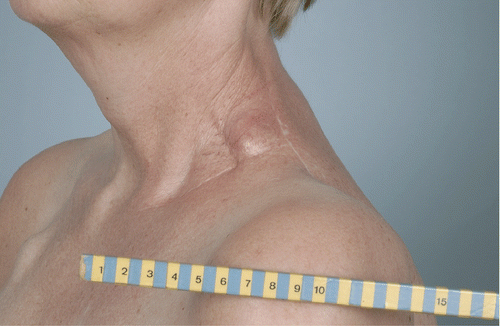
The feasibility of treatment was investigated for a 54-year-old woman with a malignant schwannoma recurrence in the left supraclavicular fossa (see ). After initial surgical treatment plus 60 Gy radiotherapy post-operatively 7 years earlier, and two more extensive local resections of recurrences, a new local recurrence could not be resected without unacceptable morbidity. Thus, re-irradiation (28 × 1.8 Gy, 5/wk) plus HT (1 h/wk) was considered. The recurrence was a subcutaneous, 2–3-cm-diameter nodule.
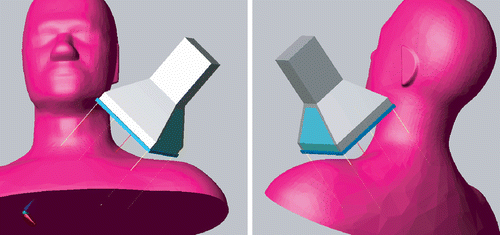
Complicating factors in this case were significant pain associated with pressure on the target area, and with lateroflexion of the neck. During the intake, it was assessed that the pressure from the water bolus was tolerable. However, the patient's comfort did not allow lateral movement of the neck. Consequently, placement of the LCA at the posterior triangle of the neck resulted in a large distance from the skin to the centre of the applicator base, and short distance (∼1 cm) from the applicator edges to the skin. As it was unclear what SAR distribution could be expected from an LCA opposing an angled tissue volume, and a large distance of the central area of the applicator to the tumour location, a treatment plan was made. Because no CT dataset was available for this patient, a generalized anatomy of the head and neck (the Standard Anthropomorphic Model (SAM) phantom) was scaled to the proportions of the patient to investigate SAR coverage (see ). The phantom volume was assigned muscle tissue properties. The central axis of the applicator was directed at the centre of the tumour, and two applicator orientations were tested in which (1) the Lucite windows, and (2) the metal edges faced the neck and shoulder.
Figure 12. Overview of the model configuration: the LCA targeted at the posterior triangle of the neck of the SAM phantom (water bolus not shown). The lines show the projection of the centre and extent of the applicator horn on the anatomy.
The simulation results in show that, when the Lucite windows face the neck and the shoulder, the SAR focus is centrally below the applicator at the site of the tumour. Placing the metal edges near the neck and the shoulder resulted, however, in less optimal SAR coverage, with the SAR maximum outside the central plane of the applicator. Both orientations did not result in hotspots at the shoulder or neck, despite the short distance between the horn edges and the skin.
Figure 13. Normalized SAR in the SAM phantom, centrally below the applicator. SAR cross-sections for two orientations of the LCA are shown: in the top row the Lucite windows (L), and in bottom row the metal edges (M) face the shoulder and the neck.
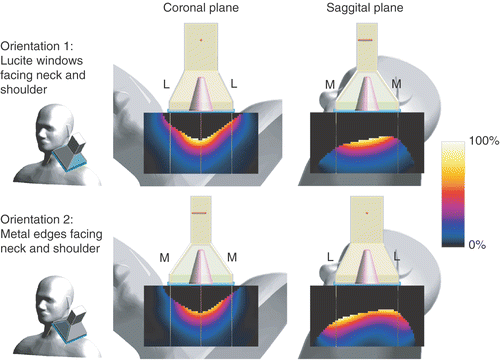
During treatments, the LCA was placed with the Lucite windows facing the neck and shoulder. It was decided to treat the patient without interstitial tumour measurements because of tumour-induced pain. The power input to the applicator was not limited by local hotspots at the neck or shoulder, and the levels achieved in steady-state were such that therapeutic temperatures could be expected (100–140 W). Clinical results were satisfactory: no tumour progression in the treated volume was observed during follow-up (10+ months).
Case 5: Four-applicator umbrella array on exophytic tumour
A 79-year-old man presented with a large (diameter 60 mm, height 20 mm) exophytic Merkel cell carcinoma on the thoracic wall which also involved the surrounding skin (see ). The dimensions of the radiotherapy field (80 × 115 mm) were larger than the footprint of a single LCA, so a 2-by-2 ‘umbrella-style’ LCA array was considered to heat the whole target volume. This set-up, however, implies that the exophytic tumour is not centrally below one applicator, but below the corners of four applicators. The question was whether effective heating of this specific target volume by an umbrella-style LCA array could be expected. A model was set up to visualize the effective SAR coverage.
Figure 14. (a) Transverse CT-slice of the thorax showing the exophytic Merkel cell carcinoma. The white line at the base of the tumour is one of the thermometry catheters. (b) Overview of the 2-by-2 umbrella-style LCA array placed onto the anatomy.
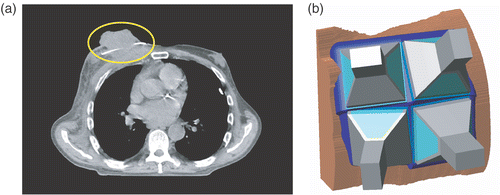
shows the model configuration: four applicators placed in an umbrella set-up over the segmented anatomy. The computation of the total SAR involved four simulation runs, in which the source of one of the four applicators was driven. For each applicator the SAR values were normalized to 1 W input power. Thereafter, the total SAR (SARtot) from the non-coherently driven applicators was calculated by summing their relative contributions:where i is the index of an LCA, sfi is the power scaling factor of an applicator, and
is a point in the common grid.
To investigate the contribution of the individual applicators to the total SAR volume, the scaling factor of one was set to five and the others to zero (see ). Hereafter, the powers were scaled such that the size of the peak SAR (10 W/kg) volumes of the applicators were similar, resulting in the scaling vector [4.25, 3, 3.5, 4.25]. The final treatment plan, depicted in , revealed a hole in the 5-W/kg iso-SAR volume (approximately 50% normalized SAR) at the centre of the exophytic tumour, when at the same time it did cover the whole surrounding surface. This indicates that heating of the tumour centre would primarily occur by conduction from surrounding tissue. It was expected that this ‘heating the base’ approach can be successful, provided that enough power is delivered to the target area, and can further be enhanced by tumour necrosis. During the first two treatments, the mean steady-state temperatures measured at the tumour base were 40.7°C and 41.8°C, respectively. During the last (third) treatment, the catheters were removed because of infection. However, there was a progressive trend in the applied total steady-state power (150, 400, 460 W), suggesting that also in the last treatment therapeutic temperatures (40–43°C) were reached.
Discussion
The cases presented in this work illustrate the use of treatment planning as a tool for decision support in superficial hyperthermia, more specifically to: (1) troubleshoot problems that rise during clinical application of SHT; (2) guide the selection of applicator type and direction of the E-field; (3) analyse the SAR coverage of a target volume in non-standard cases; and (4) investigate to what extent potential contraindications obstruct treatment. In some cases, abstractions of the patient's anatomy were exploited, to speed up the process of decision making, or because 3-D medical image data were not available at an early stage. The understanding gained, even from simplified anatomies, has proved valuable in determining the treatment strategy and was of direct benefit for the patient. The main strength of input from simulations is that the effectiveness of different scenarios can be judged in advance of an HT session. By contrast, without input from simulations, decisions regarding the treatment approach are based on previous experiences and intuition, and their efficacy only becomes clear during the course of a treatment.
Another area where treatment planning plays an important role is the education and training of hyperthermia technicians and physicians. Traditionally, the mental image of the SAR pattern below an applicator is based on the patterns measured in flat phantom set-ups for quality assurance purposes Citation[30]. In the clinical situation, this mental picture does not always apply as SAR patterns in patients are largely determined by the anatomy. Here, treatment plans critically refine insight in to the real 3-D energy distribution, especially in non-standard cases. For educational purposes, treatment plans based on simplified anatomies are the best, because the connection between the main anatomical features, the applicator set-up and the resulting SAR pattern is optimal, and distractions from influences of small anatomical features are limited. In our experience, however, both patient-specific and generalized treatment plans tend to feed interdisciplinary discussions and thus provide an excellent means of continuous training.
It is important to note that, despite the close similarity between deep and superficial HT treatment planning, SHT treatment planning is something quite different. The different demands on a TPS originate from basic differences in equipment and steering. For the heating of deep-seated tumours, a phased array of dipoles (e.g. BSD-2000) or parallel-plate waveguides (AMC-4, AMC-8) is generally used. Here, the main steering parameters are the amplitudes and phases of the array elements, and optimization can be based on pre-computed electric field distributions for the array elements to be considered Citation[3]. By contrast, applicator systems for SHT (horn- and microstrip applicators) use non-coherent sources, thereby restricting the steering possibilities to power variations alone. Here, optimization of the heating technique involves the applicator type and orientation, and the placement of applicators relative to the patient's anatomy. Consequently, in SHT treatment planning, each variation in an optimization parameter involves the generation and simulation of a separate model. In addition, SHT treatment planning is computationally demanding. First, the 5–10 times higher frequencies applied in SHT (433 or 915 MHz) compared with DHT (70–100 MHz) lead to smaller grid steps. Second, where in DHT voxels of about 1 cm are generally applied for EM simulations, the simulation of SHT applicators requires grid steps of 1 mm and less accurately to resolve the antenna structure in a mesh Citation[18], Citation[31], Citation[32]. Therefore, fully fledged optimization in SHT treatment planning includes high-speed simulation tools that allow scripted model generation and simulation.
The tools for simulation of an array of applicators placed around a realistic anatomy are now available. This opens up new areas of research. One future benefit of SHT is the improvement of the observability of patient temperatures, by supplementing interstitial thermometry with temperature predictions based on treatment plans. The work by Kumuradas and Sherar Citation[16] already aimed in this direction. For SHT the means to improve temperature monitoring are restricted. In general, the problem of interstitial thermometry persists: neither the patient nor the clinician appreciates increasing the density of interstitial temperature measuring points. Non-invasive thermometry (NIT) by MRI is not realistic for SHT, and NIT by microwave radiometry or ultrasound has not been shown to provide the required spatial resolution and temperature sensitivity. Over time, predicted temperatures may even replace interstitial thermometry. However, accurate prediction of temperature distributions requires the calculation of absolute SAR levels, thus extensive knowledge of the relation between model SAR and real-world SAR. First steps in this direction have been taken by quantitative validation of the FDTD model of the LCA applicator Citation[25]. Moreover, accurate thermal modelling requires a more extensive knowledge of tissue parameters and of a patient's perfusion characteristics than is available today.
Another potential benefit of SHT treatment planning tools is that calculated 3-D SAR and temperature distributions provide a means to analyse the correlation between SAR coverage, cumulative equivalent minutes, or any other proposed prognostic parameter, and treatment outcome. A study investigating the prognostic value of 3-D SAR coverage for breast cancer recurrences of the chest wall is currently in preparation at the Rotterdam hyperthermia unit. In this respect, SHT treatment planning is a gateway to an improved hyperthermic dosimetry.
Conclusion
Treatment planning in SHT is feasible and available for routine clinical use. SHT treatment planning has been successfully applied to select the applicator type and the polarization of the E-field, to assess the risk associated with metallic implants and to analyse the effective SAR coverage resulting from multi-applicator arrays. Apart from clinical benefits like higher tumour temperatures, and relief of limiting hotspots, treatment planning in SHT provides a means to improve temperature monitoring and to proceed in hyperthermia dosimetry.
Acknowledgements
This work was financially supported by the Dutch Cancer Society. The authors acknowledge the software support from Schmid & Partner Engineering AG (SPEAG).
References
- Lagendijk JJW, Crezee J, Mooibroek J. Principles of treatment planning. Thermo-radiotherapy and Thermo-chemotherapy. Volume 1. Biology, Physiology, and Physics. Springer-Verlag, Berlin 1995; 439–451
- Wust P, Seebass M, Nadobny J, Felix R. Electromagnetic deep heating technology. Thermo-radiotherapy and Thermo-chemotherapy. Vol. 1. Biology, Physiology, and Physics. Springer-Verlag, Berlin 1995; 219–247
- Paulsen KD, Geimer S, Tang J, Boyse WE. Optimization of pelvic heating rate distributions with electromagnetic phased arrays. Int J Hyperthermia 1999; 15: 157–186
- Gellermann J, Wust P, Stalling D, Seebass M, Nadobny J, Beck R, Hege HC, Deuflhard P, Felix R. Clinical evaluation and verification of the hyperthermia treatment planning system Hyperplan. Int J Radiat Oncol Biol Phys 2000; 47: 1145–1156
- Lagendijk JJW. Hyperthermia treatment planning. Phys Med Biol 2000; 45: R61–R76
- Wust P, Seebass M, Nadobny J, Deuflhard P, Monich G, Felix R. Simulation studies promote technological development of radiofrequency phased array hyperthermia. Int J Hyperthermia 1996; 12: 477–494
- Kroeze H, Van de Kamer JB, De Leeuw AAC, Lagendijk JJW. Regional hyperthermia applicator design using FDTD modelling. Phys Med Biol 2001; 46: 1919–1935
- Seebass M, Beck R, Gellermann J, Nadobny J, Wust P. Electromagnetic phased arrays for regional hyperthermia: Optimal frequency and antenna arrangement. Int J Hyperthermia 2001; 17: 321–336
- Paulides MM, Bakker JF, Zwamborn APM, Van Rhoon GC. A head and neck hyperthermia applicator: Theoretical antenna array design. Int J Hyperthermia 2007; 23: 59–67
- Sullivan DM, Ben-Yosef R, Kapp DS. The Stanford 3-D hyperthermia treatment planning—Technical review and clinical summary. Int J Hyperthermia 1993; 9: 627–643
- Das SK, Clegg ST, Anscher MS, Samulski TV. Simulation of electromagnetically induced hyperthermia: A finite element gridding method. Int J Hyperthermia 1995; 11: 797–808
- Hornsleth SN, Seebass M, Mella O, Dahl O. Patient specific treatment planning in regional hyperthermia: Practical experience in Bergen. Radiofrequency Regional Hyperthermia (dissertation), SN Hornsleth. Aalborg University, Denmark 1996
- Van de Kamer JB, De Leeuw AAC, Hornsleth SN, Kroeze H, Kotte ANTJ, Lagendijk JJW. Development of a regional hyperthermia treatment planning system. Int J Hyperthermia 2001; 17: 207–220
- Sreenivasa G, Gellermann J, Rau B, Nadobny J, Schlag P, Deuflhard P, Felix R, Wust P. Clinical use of the hyperthermia treatment planning system Hyperplan to predict effectiveness and toxicity. Int J Radiat Oncol Biol Phys 2003; 55: 407–419
- Kok HP, van Haaren PM, van de Kamer JB, Zum Vorde Sive Vording PJ, Wiersma J, Hulshof MC, Geijsen ED, van Lanschot JJ, Crezee J. Prospective treatment planning to improve locoregional hyperthermia for oesophageal cancer. Int J Hyperthermia 2006; 22: 375–389
- Kumaradas JC, Sherar MD. Edge-element based finite element analysis of microwave hyperthermia treatments for superficial tumours on the chest wall. Int J Hyperthermia 2003; 19: 414–430
- Van Rhoon GC, Rietveld PJ, Van der Zee J. A 433 MHz Lucite cone waveguide applicator for superficial hyperthermia. Int J Hyperthermia 1998; 14: 13–27
- De Bruijne M, Samaras T, Bakker JF, Van Rhoon GC. Effects of waterbolus size, shape and configuration on the SAR distribution pattern of the Lucite cone applicator. Int J Hyperthermia 2006; 22: 15–28
- Van der Gaag ML, De Bruijne M, Samaras T, Van der Zee J, Van Rhoon GC. Development of a guideline for the water bolus temperature in superficial hyperthermia. Int J Hyperthermia 2006; 22: 637–656
- SEMCAD X Reference Manual. Zürich Switzerland. 2006, Schmid Partner Engineering AG 2006 Available online at: http://www.semcad.com (accessed 20 January 2007)
- Gabriel S, Lau RW, Gabriel C. The dielectric properties of biological tissues: III. Parametric models for the dielectric spectrum of tissues. Phys Med Biol 1996; 41: 2271–2293
- Joines WT, Zhang Y, Li C, Jirtle RL. The measured electrical properties of normal and malignant human tissues from 50 to 900 MHz. Med Phys 1994; 21: 547–550
- COMAC BME Task Group. Treatment planning and modeling in hyperthermia. A Task Group Report of the European Society for Hyperthermic Oncology in cooperation with a COMAC-BME Concerted Action (4th Medical and Health Research Programme of the European Commission). Tor Vergata Medical Physics Monograph Series, Rome 1992; 12: 135–136
- Samaras T, Rietveld PJM, Van Rhoon GC. Effectiveness of FDTD in predicting SAR distributions from the Lucite cone applicator. IEEE Trans MTT 2000; 48: 2059–2063
- De Bruijne M, Samaras T, Chavannes N, Van Rhoon GC. Quantitative validation of the 3D SAR profile of hyperthermia applicators using the gamma method. Phys Med Biol 2007; 52: 3075–3088
- Lee ER, Sullivan DM, Kapp DS. Potential hazards of radiative electromagnetic hyperthermia in the presence of multiple metallic surgical clips. Int J Hyperthermia 1992; 8: 809–817
- Boll DT, Lewin JS, Durek JL, Merkle EM. Do surgical clips interfere with radiofrequency thermal ablation?. AJR Am J Roentgenol 2003; 180: 1557–1560
- Myerson RJ, Perez CA, Emami B, Straube W, Kuske RR, Leybovich L, Von Gerichten D. Tumor control in long-term survivors following superficial hyperthermia. Int J Radiat Oncol Biol Phys 1990; 18: 1123–1129
- Lee HK, Antell AG, Perez CA, Straube WL, Ramachandran G, Myerson RJ, Emami B, Molmenti EP, Buckner A, Lockett MA. Superficial hyperthermia and irradiation for recurrent breast carcinoma of the chest wall: Prognostic factors in 196 tumors. Int J Radiat Oncol Biol Phys 1998; 40: 365–375
- Hand JW, Lagendijk JJW, Bach Anderson J, Bolomey JC. Quality assurance guidelines for ESHO protocols. Int J Hyperthermia 1989; 5: 421–428
- Rosetto F, Stauffer PR. Theoretical characterization of dual concentric conductor microwave applicators for hyperthermia at 433 MHz. Int J Hyperthermia 2001; 17: 258–270
- Jacobsen S, Rolfsnes HO, Stauffer PR. Characteristics of microstrip muscle-loaded single-arm archimedean spiral antennas as investigated by FDTD numerical computations. IEEE Trans Biomed Eng 2005; 52: 321–330
![Figure 15. Individual SAR contribution of the applicators. Relative scaling: (a) [5 0 0 0], (b) [0 5 0 0], (c) [0 0 5 0] and (d) [0 0 0 5]. Isosurface at 10 W/kg. The applicators are represented schematically by their square aperture of 10 × 10 cm2.](/cms/asset/6ae4727b-43f9-4188-b332-1a61842417ff/ihyt_a_250077_f0015_b.gif)
![Figure 16. The 5-W/kg SAR isosurface resulting from scaling factors [4.25, 3, 3.5, 4.25]. The hole in the isosurface at the tumour centre is clearly visible.](/cms/asset/a30e4af3-640c-456f-8448-af2660c81f83/ihyt_a_250077_f0016_b.gif)