Abstract
Purpose: Online MR-thermometry during hyperthermia can improve treatment control. It needs excellent image quality during hyperthermia treatment to get information from subtracted images.
Materials and methods: For hybrid hyperthermia two high-frequency devices were used in combination working with different frequencies. The imaging was performed on a 1.5 T MR tomograph (Siemens Symphony, Quantum Gradienten, Maestro Class, Firma Siemens, Erlangen, Germany) at 64 MHz whereas hyperthermia was administered with a BSD 2000 3D unit utilizing a Sigma Eye applicator and a 12 channel DODECK transistor amplifier (BSD 2000, BSD-MC, Salt Lake City, Utah, USA) operating at 100 MHz. For analysing image artifacts a spectrum analyser (Hewlett Packard HP8591E) was used.
Results: Two different image artifacts, occurring during the use of this hybrid system, are described. The artifacts result from introduction of additional frequencies into the imager. Here we demonstrated the detection and elimination of these spurious frequencies in the context of two case studies.
Conclusion: Hybrid hyperthermia requires excellent imaging for optimal operation. Additional frequencies causing image artifacts can be identified by use of a spectrum analyser. Once identified, these interfering frequencies can be eliminated with appropriate RF filters. With MRI quality control for hyperthermia systems with different treatment frequencies is possible.
Introduction
Hyperthermia is an adjuvant treatment modality that increases the effects of multimodal anti-cancer therapy. The effects were analysed in randomized studies for different diseases Citation[1–7]. Improvement of temperature distribution is important for optimizing the effectiveness of hyperthermia Citation[8–10], and improved temperature control is a critical first step towards this objective. The MR-hybrid-hyperthermia is a technological development of the regional hyperthermia to improve temperature control Citation[11]. In the hybrid system a 1.5 T MR-tomograph was combined with a hyperthermia device to enable a simultaneous temperature mapping and analysis during the hyperthermia session.
For temperature imaging various techniques can be applied. In this system normally we used the proton resonance frequency shift method (PRFS) with a double echo and drift correction Citation[12]. The results of this method correlate with the clinical response to hyperthermia Citation[9], Citation[10]. Temperature was calculated from the difference between a pre-treatment measurement and measurements during hyperthermia. Difference measurements were susceptible to motion and imaging artifacts generated during the heating process.
This article describes two different imaging artifacts that occurred during treatment with the hybrid system. Here we describe each artifact, its cause and how it can be eliminated.
Method
Hybrid hyperthermia is the combination of two high-frequency devices, operating at different frequencies. The imaging was performed with a 1.5T MR tomograph (Siemens Symphony, Quantum Gradienten, Maestro Class, Firma Siemens, Erlangen, Germany) operating at 64 MHz. Heating was induced by a Sigma Eye applicator constructed from non-magnetic material and built by an eye-shaped acrylic glass corpus with 24 antennas in three rings (head, mid and foot), each of the rings with two antennas at top, bottom, right and left connected in pairs, working as a couplet together at one channel (for more detail see Citation[13]). Power was given by a 12 channel DODECK transistor amplifier (BSD 2000, BSD-MC, Salt Lake City, Utah, USA) operating at a fixed frequency of 100 MHz at our department.
To reduce interference between these devices the cables of the hyperthermia system were equipped with filters for 64 MHz and 200 MHz Citation[11], to make sure that no additional frequency was sent by the applicator inside the MR imager. The 200 MHz filter should avoid even harmonics of the 100 MHz treatment frequency. The MR tomograph was equipped with a Pi-Filter for 100 MHz (installed between the tuning device of the body coil and the pre-amplifier) in the transmitting and receiving path in the same manner as described in Citation[14]. Due to the size of the applicator, imaging of heating with conventional surface coils was not feasible.
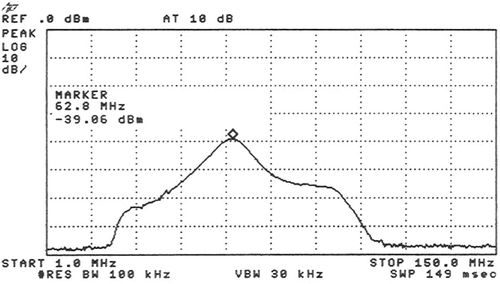
The measured decoupling between the MR bird cage body coil and the hyperthermia applicator inside the MR imager was -20dB. The frequency of the MRI pre-amplifier was optimized over its limited frequency range (). This resulted in a sufficient filtering of -80dB around 100 MHz to attenuate the signal to the dynamic range of the MR pre-amplifier.
Figure 1. The frequency range of the MRI preamplifier is shown. The vertical lines are placed at 15 MHz intervals along the horizontal axis. Below 20 MHz and above 105 MHz there is no more amplification. The maximum amplification is at 60 ± 15 MHz. The marker (⋄) is at 62.8 MHz.
A spectrum analyser (Hewlett Packard HP8591E) was used to analyse the causes of MR imaging artifacts.
Results
Artefact 1: Image noise dependent on power
During MR-thermometry, imaging noise increased during specific phase steering: especially it was detected during focusing of the interference maximum (). Focusing was produced by a phase delay in the central of the three antenna rings of the Sigma Eye applicator.
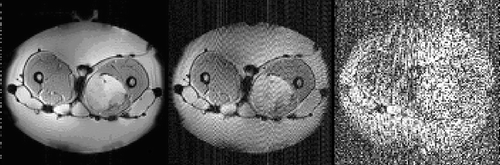
Figure 2. Transversal (magnitude) images of a patient therapy in the Sigma Eye applicator. The patient was treated in the context of the EORTC study 62961 for a high-risk soft tissue sarcoma of the left thigh. The first picture was taken without power, the second at 800 W and the third at 1400 W amplifier power. The intensity of the streaky artifacts in the magnitude image is strongly dependent on the power used. These artifacts prevent temperature imaging by the image difference method.
Our first hypothesis was that this was caused by insufficient filtering for the 100 MHz signal. However, doubling of the Pi-Filter for 100 MHz with a filter capacitor of more than -120 dB did not alleviate the problem. On the contrary, this led to a change of the disturbance: the malfunction now ceased during maximal power but occurred regularly when the main operating power was at 1000 W to 1600 W. Filtering the power supply of the synthesizer in the amplifier and the power amplifier did not improve image quality. After further analysis the cause of the imaging interference was identified as the auxiliary frequencies of about 8 MHz and their harmonics of each output stage of the amplifier. displays the frequency of a channel when the output of the amplifier was connected to the applicator.
Figure 3. The marker is at 63.3 MHz (imaging frequency), the frequencies of 1–250 MHz are seen on the x-axis, the vertical lines are at 25 MHz intervals. The spectrum was measured with a broadband directional coupler, while the Sigma Eye applicator was attached. The auxiliary frequency of about 8 MHz is clearly seen in (A) together with its mixed frequencies (harmonics) with itself and also with the treatment frequency of 100 MHz. A similar spectrum of frequencies resulted in almost each of the twelve amplifier channels. On measurement of the spectrum by use of an attenuator (dummy load), these auxiliary frequencies were not detected. (B) shows the spectrum of the same channel after the additional installation of a real 50 Ω resistance with a serial inductivity (for more detail see the Appendix) for the adjustment of the auxiliary frequency at approximately 8 MHz.
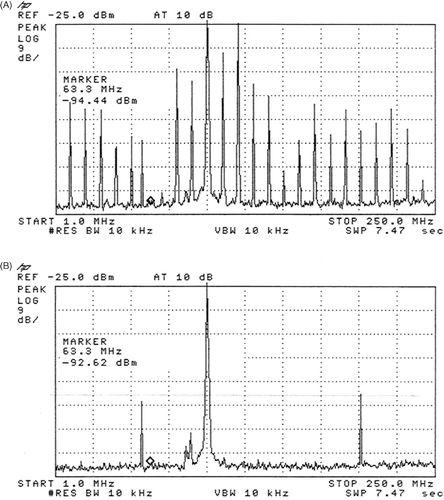
The auxiliary frequency was induced by oscillation of the power amplifier when it was connected to circuits optimized on frequencies from 70 to 130 MHz and not on low frequencies (about 10 MHz).
These auxiliary frequencies can be suppressed () by attaching a real 50 Ohm resistance with an serial inductivity for 8 MHz for each channel directly at the output of the amplifier, so that the amplifier has a real matching for these two frequencies of 8 MHz and 100 MHz (for equivalent circuit diagram and insertion loss plot see the Appendix, ). This modification reduced the malfunction of the output stage amplifier and induced an error free operation during clinical use. Consequently, other hyperthermia systems (not utilizing MR imaging) were also fitted with these serial inductivities.
Upgrading of the applicator efficiency
To achieve sufficient power in patient treatments for effective hyperthermia, further adaptations in the system were required. During high power applications the circuit of the antennas of the Sigma Eye heated up until it reached the braze point and dissolved the connection, inducing a circuit failure. When the phase steering was optimized (like in Citation[15]) additional amplifier power was required, necessitating an improvement in the antenna circuit. Introducing a balun (avoiding external feedline currents or braid currents) instead of cable chokes reduced ferromagnetic artifacts at the images. The overheating of the circuit was prevented by reducing the capacitance of the adjustments of the antennas, which markedly improved the efficiency of the applicator and kept the circuit distinctly cooler than before. Further improvement of the heating efficiency was achieved by replacing the adhesive foil on the antennas of the applicator and fixing them by a very thin epoxy covering (75 to 100 μm thickness). The glue of the adhesive foil was heated up by the radio frequency during treatment. When it was removed, the heating of the coupling water bolus during power on was reduced and the efficiency was improved by about 10 W per channel.
These changes led to an obvious improvement in the clinical use of the instrumentation. In phantom measurements the efficiency increased up to 175% of its initial value.
Artefact 2: Image artifacts resembling motion effects
However, improved efficiency of the applicator led to completely different image artifacts. The artifacts appeared intermittently when the power level was over 900 W () and varied with different power levels. They produced an effect similar to effects of patient movement during treatment Citation[16]. Changing the phase encoding direction (swap) did not lead to a change even during heating trials with 900 W in phantoms. If the acquisition time of the image stack was reduced or the power lowered below 900 W, the artifacts disappeared. Since these artifacts occurred in 10% of all recorded images, they were for a long time attributed to patient movement during imaging. Also changing of phase steering of the applicator during imaging occasionally helped remove these artifacts (because power is shortly shut off during phase changing). The shorter the acquisition time, the lower the power, the less these image artifacts were observed. Also the position of the applicator inside the MR bore seemed to influence these artifacts.
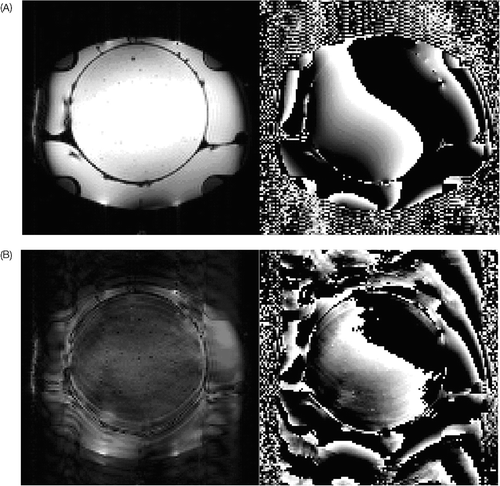
Figure 4. On the left side the magnitude images are seen for 0 and 900 W power, on the right side the attendant phase images (for PRFS thermometry method). The image interference looks as if the phantom is moving during measurement (which it cannot). The magnitude image shows a clear reduction of the signal, whereby the contours of the picture remain. In the phase image an expansion of phase signal into regions is seen, where no object is present and phase noise should normally be seen (see above the applicator in comparison to the admission without power). The temperature computation, according to the principle of difference to a reference image, is strongly reduced by these image artifacts.
Measurement of the frequency spectrum at the output of the 100 MHz filter (prior to the pre-amplifier of the MRI) demonstrated the presence of an additional high frequency 50 MHz signal in the receiving channel of the body coil of the MRI (). This signal evolved when power above 900 W was reached (during operation of the applicator in the MR) and fluctuated over time. The signal was constantly detectable at power levels above 1200 W, although the amplitude continued to fluctuate. It was not detectable when the applicator was used outside the MR bore.
Figure 5. The spectrum shows the frequency range from 40 to 110 MHz. The marker (⋄) is at 63.45 MHz. The vertical lines separate frequency ranges of 7 MHz. At 100 MHz still a medium-sized signal of the treatment frequency can be recognized during 1800 W amplifier power, which is clearly weakened by the double pi filters. In addition a very high signal occurs at 50 MHz (A), which varies in intensity and arises in the spectrographic analysis from increasing amplifier power to 900 W. For powers more than 1200 W the signal is nearly continuously present. In (B), despite 1800 W amplifier power, there is no more signal at 50 MHz with filter absorption of −80 dB.
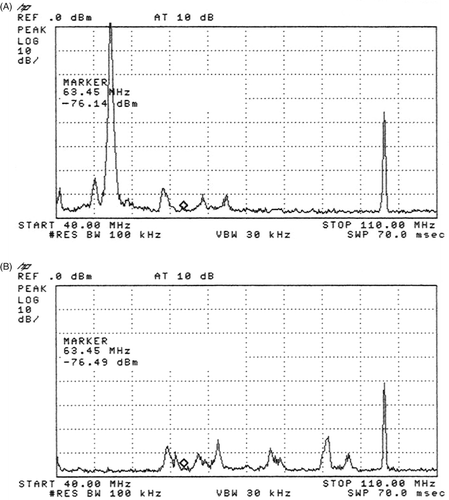
Figure 6. Spectrum analysis of the two frequency pi-filter for 100 and 50 MHz (in the range 45 to 105 MHz). The attenuation of the whole filter for this frequency is extremely low (0.11 dB). The first marker (1) is at 50 MHz and shows the attenuation of more than −80 dB. Second marker (2) is at the imaging frequency at 64 MHz with nearly no attenuation. The third marker (3) is at the treatment frequency 100 MHz with an attenuation of more than −80 dB.
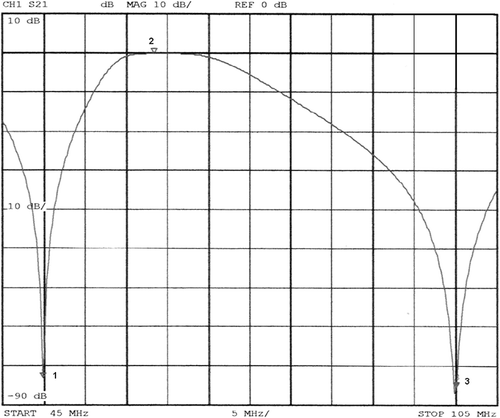
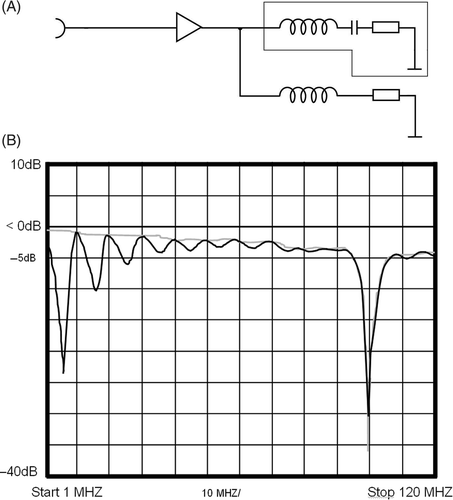
Figure 7. (A) Equivalent circuit diagram of the amplifier (left), as well as the cable run to the antenna of the applicator (on the top right, small box) and the 50 Ω resistance matched with a serial inductivity for 8 MHz (right down). (B) In the insertion loss plot (measured by a Rhode & Schwarz vector analyser) additional attenuation for 8 MHz (black curve) in contrast to the grey curve without this matching can be seen. After employment of the component, almost no more random failures of the power amplifier arose.
Although the total signal intensity was distinctly lower at 50 MHz than in the treatment frequency of 100 MHz, this frequency lies in the highly sensitive range of the pre-amplifiers of the MRI (60 MHz ± 15 MHz) (see ). We searched for other causes of this signal, because halving of the treatment frequency seemed implausible.
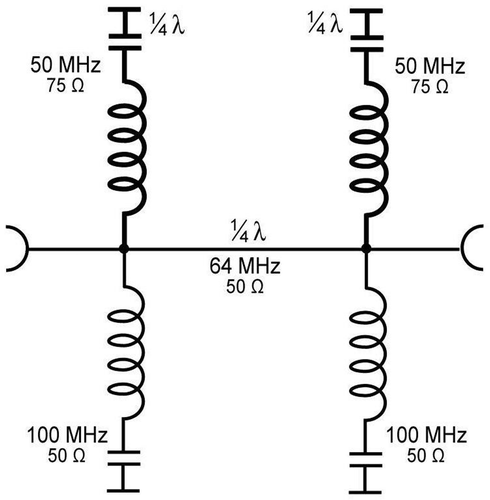
Since the signal could only be detected at the end of the tuning unit of the body coil, the origin of the signal must be in the electronic circuits of the body coil and its tuning unit, probably in rectification of the treatment frequency within a PIN diode. It can be prevented by reducing the efficiency of the hyperthermia applicator or by modifying the body coil and its tuning unit of the MR. Both options are undesirable. Therefore, a filter for two frequencies was designed and implemented (for an equivalent circuit diagram see the Appendix, ): The stubs are assembled in 1/4 λ distance for the imaging frequency 64 MHz to guarantee the lowest possible ripple and best phase stability. The higher capacitance of the filters for 50 MHz allows a steeper filtering effect in this frequency range without reducing the imaging frequency of 64 MHz. This is necessary due to the position of the filter in the transmitting and receiving path of the body coil.
Figure 8. Equivalent circuit diagram of the two-frequency pi filter for 100 and 50 MHz. The stubs are installed in a distance of 1/4 λ for 64 MHz (imaging frequency), in order to guarantee as low as possible ripple and a high phase stability in this frequency range. The attenuation of the whole filter for this frequency is only 0.11 dB (see ). The lower capacitance of the filters for 50 MHz was used to achieve a steeper filter effect in this frequency range, to avoid absorbance of the imaging frequency, because this filter is positioned in the transmit-and-receive path of the MRI body coil.
After implementing the double frequency filter for 50 and 100 MHz, the imaging artifacts described in no longer appeared. In the spectral display () the 50 MHz signal could no longer be detected at the pre-amplifier of the MR.
Discussion
The hybrid radio frequency hyperthermia/MR tomography enables the acquisition of MR imaging during hyperthermia with different weightings. This is a major development in the field of hyperthermia. For the first time temperature behaviour during treatment can be evaluated in space and time online. This introduces the potential for improved quality control and also for an improvement in treatment steering Citation[17]. Simultaneously the understanding for the mechanisms underlying hyperthermia efficiency can be extended. Without losing time by positioning the patient, functional imaging can be performed during treatment and the understanding of physiological changes evaluated. In the future molecular imaging may enable the observation of the molecular reactions during hyperthermia.
But this necessitates excellent imaging quality during hyperthermia, which can be jeopardized by various technological disturbances related to compatibility of conducting material in the field of view of the MR Citation[11]. But also the compatibility of the generated and received radio frequencies may cause image artifacts, as shown in this paper.
We were able to illustrate how auxiliary frequencies, produced by the amplifier cause power dependent imaging artifacts. The adaptation of the auxiliary frequency has extended the life time of the power amplifier and thus has resulted in a significant decrease of breakdown of the system. This adaptation led also to a comparable improvement in hyperthermia systems not equipped for MR thermometry.
The increase in the effectiveness of the applicator produced a technical incompatibility of the frequencies of the various components, which was not initially apparent. Due to the observation of this intermittent disturbance a sub-harmonic of the treatment frequency at 50 MHz was observed due to interaction of the MR systems electronics. Detection of this additional frequency led to its elimination by the successful implementation of newly designed filters for two frequencies.
The successful filtering for multiple sequences suggests that further filtering of other frequencies is possible. As a result, MR-based thermometry for supervising the treatment and quality control for other hyperthermia methods requiring different frequencies is feasible. Only the right filter for the right frequency is necessary. In the search for the causes of the imaging artifacts a spectrum analyser is the most important instrument next to the MR itself.
Conclusion
Hybrid hyperthermia requires excellent imaging for optimal operation. By careful observation and use of a spectrum analyser the causes of imaging artifacts can be identified. As soon as the interfering frequencies are recognized, appropriate RF filters can be used to eliminate them. With MRI quality control for hyperthermia systems with different treatment frequencies is possible.
Acknowledgements
This work has been supported by the Berliner Sparkassenstiftung Medizin (Project ‘Oxygenation in Oncology’). We gratefully thank them for their support. We gratefully thank Mr G. Angermann from Siemens medical solutions for his support.
Related Research Data
References
- Issels RD, Lindner LH, Wust P, Hohenberger P, Jauch K, Daugaard S, Mansmann U, Hiddemann W, Blay J, Verweij J. Regional hyperthermia (RHT) improves response and survival when combined with systemic chemotherapy in the management of locally advanced, high grade soft tissue sarcomas (STS) of the extremities, the body wall and the abdomen. A phase III randomised prospective trial (EORTC/ESHO intergroup trial), JCO 2007 ASCO Annual Meeting Proceedings Part I 2007;25(Suppl. 18):10009
- Van der Zee J, van Rhoon GC. Cervical cancer: Radiotherapy and hyperthermia. Int J Hyperthermia 2006; 22: 229–234, Review
- Van der Zee J, Gonzalez Gonzalez D, van Rhoon GC, van Dijk JD, van Putten WL, Hart AA. Comparison of radiotherapy alone with radiotherapy plus hyperthermia in locally advanced pelvic tumours: A prospective, randomised, multicentre trial. Dutch Deep Hyperthermia Group. Lancet 2000; 355: 1119–1125
- Rau B, Wust P, Hohenberger P, Loeffel J, Huenerbein M, Below C, Gellermann J, Speidel A, Vogl T, Riess H, et al. Preoperative hyperthermia combined with radiochemotherapy in locally advanced rectal cancer: A phase II clinical trial. Ann Surg 1998; 227: 380–389
- Hildebrandt B, Wust P, Rau B, Schlag PM, Riess H. Regional hyperthermia for rectal cancer. Lancet 2000; 356: 771–772
- Hildebrandt B, Wust P, Drager J, Luedemann L, Sreenivasa G, Tullius SG, Amtauer H, Neuhaus P, Felix R, Riess H. Regional pelvic hyperthermia as an adjunct to chemotherapy (oxaliplatin, folinic acid, 5-fluorouracil) in pre-irradiated patients with locally recurrent rectal cancer: A pilot study. Int J Hyperthermia 2004; 20: 359–369
- Overgaard J, Gonzalez Gonzalez D, Hulshof MC, Arcangeli G, Dahl O, Mella O, Bentzen SM. Randomised trial of hyperthermia as adjuvant to radiotherapy for recurrent or metastatic malignant melanoma. European Society for Hyperthermic Oncology. Lancet 1995; 345(8949)540–543
- Jones EL, Oleson JR, Prosnitz LR, Samulski TV, Vujaskovic Z, Yu D, Sanders LL, Dewhirst MW. Randomized trial of hyperthermia and radiation for superficial tumors. J Clin Oncol 2005; 23: 3079–3085
- Gellermann J, Wlodarczyk W, Hildebrandt B, Ganter H, Nicolau A, Rau B, Tilly W, Faehling H, Nadobny J, Felix R, et al. Noninvasive magnetic resonance thermography of recurrent rectal carcinoma in a 1.5 Tesla hybrid system. Cancer Res 2005; 65: 5872–5880
- Gellermann J, Hildebrandt B, Issels R, Ganter H, Wlodarczyk W, Budach V, Felix R, Tunn PU, Reichardt P, Wust P. Noninvasive magnetic resonance thermography of soft tissue sarcomas during regional hyperthermia: Correlation with response and direct thermometry. Cancer 2006; 107: 1373–1382
- Wust P, Gellermann J, Seebass M, Faehling H, Turner P, Wlodarczyk W, Nadobny J, Rau B, Hildebrandt B, Oppelt A, et al. [Part-body hyperthermia with a radiofrequency multiantenna applicator under online control in a 1.5 T MR-tomograph.]. Rofo 2004; 176: 363–374
- Gellermann J, Wlodarczyk W, Feussner A, Faehling H, Nadobny J, Hildebrandt B, Felix R, Wust P. Methods and potentials of magnetic resonance imaging for monitoring radiofrequency hyperthermia in a hybrid system. Int J Hyperthermia 2005; 21: 497–513
- Wust P, Beck R, Berger J, Faehling H, Seebass M, Wlodarczyk W, Hoffmann W, Nadobny J. Electric field distribution in a phased-array applicator with 12 channels: Measurements and numerical simulations. Med Phys 2000; 27: 2565–2579
- Delannoy J, LeBihan D, Hoult DI, Levin RL. Hyperthermia system combined with a magnetic resonance imaging unit. Med Phys Biol 1990; 12: 855–860
- Gellermann J, Goke J, Figiel R, Weihrauch M, Cho CH, Budach V, Felix R, Wust P. Simulation of different applicator positions for treatment of a presacral tumour. Int J Hyperthermia 2007; 23: 37–47
- Mirowitz SA. Liver and biliary system. Pitfalls, variants and artifacts in body MR imaging. Mosby-Year Book, Inc, St. Louis, MO 1996; 101–153
- Weihrauch M, Wust P, Weiser M, Nadobny J, Eisenhardt S, Gellermann J. Adaptation of antenna profiles for control of MR guided hyperthermia (HT) in an hybrid MR-HT system. Med Phys 2007; 34: 4717–4725
Appendix
The auxiliary frequencies (a), which can be measured at the amplifier output, when the applicator (optimized for 100 MHz) is attached, can be suppressed (b). For this purpose we attached a real 50 Ohm resistance with an serial inductivity for 8 MHz for each channel directly at the output of the amplifier, so that the amplifier has a real matching for these two frequencies of 8 MHz and 100 MHz. shows the equivalent circuit diagram of the circuit at the amplifier output of one channel: upper circuit in the box is the antenna, optimized for 100 MHz. The lower circuit is the 50 Ω resistance optimized with a serial inductivity for 8 MHz. shows the insertion loss with (black curve) and without the matching for 8 MHz (grey curve). Attenuation for 100 MHz as well as 8 MHz and its harmonics is shown.
The equivalent circuit diagram of the two-frequency filter for 100 MHz and 50 MHz is shown in . The 100 MHz stubs are built by extremely low-loss 50 Ω ECOFLEX 15 cable and installed in a distance of 1/4 λ for 64 MHz (imaging frequency), in order to guarantee as low as possible ripple and high phase stability in this frequency range. The attenuation of the whole filter for this frequency is extremely low (0.11 dB). The filters for 50 MHz have a lower capacitance (built by 75 Ω CATV trunk cable) capacitance to archive a steeper filter effect at 50 MHz, to avoid absorbance of the imaging frequency. This is necessary because this filter is positioned in the transmit-and-receive path of the MRI body coil.