Abstract
Purpose: An increase in tumor oxygenation and perfusion due to hyperthermia has been reported for experimental tumors. The present study was performed to investigate this hypothesis in patients who underwent regional hyperthermia.
Methods: Twenty-seven patients with primary or recurrent pelvic tumors were included in this study. Prior to and up to 1 h after regional hyperthermia, perfusion and partition coefficient were quantitatively determined by utilizing H2 15O-PET. First pass PET images were fused with the segmented common iliac artery from separately acquired CT scan. The arterial input function was extracted from the common iliac arteries using the dynamic PET images and the fused CT. The fused images were also used to extract tumor activity–time curves. Perfusion was calculated from the total tumor curves with correction for arterial spill-over. Changes in perfusion and partition coefficient were analyzed and correlated with various treatment parameters.
Results: Heating under hyperthermia conditions significantly increased the partition coefficient for pelvic tumors (P = 0.005). The increase correlated with the duration of hyperthermia and was found in patients treated for more than 1 h and persisted for more than 1 h after the end. Significant changes in perfusion were not observed. Perfusion had recurred to initial values 20 min after heating.
Conclusions: The increase in partition coefficient reflects an increased diffusion distance of radio-labeled water. Therefore water diffusion is increased due to hyperthermia. Analogous to water diffusion, the diffusion of inert gases is also facilitated, improving the oxygenation of hypoxic tumor cells. Our results suggest that tumor oxygenation can probably be enhanced by regional hyperthermia for a period of more than 1 h after heating, provided hyperthermia is applied for at least 60 min. The effect was observed to be reversible within one week.
Introduction
A number of clinical studies of hyperthermia, including randomized studies Citation1,Citation2, have recently demonstrated that hyperthermia improves the response of selected human tumors to radiotherapy. Interestingly, positive results were also found when the thermal doses were too low for direct cell killing. Based on these observations, the mechanisms by which hyperthermia exerts its beneficial effects are still under discussion Citation3. Perfusion is dramatically changed during hyperthermia treatment. Oleson Citation4, for instance, hypothesizes that increased tumor blood flow and resultant enhancement of tumor oxygenation may have caused the hyperthermia-induced improvement of tumor response to radiotherapy in some hyperthermia clinical trials. Indeed, it has been shown that mild-temperature hyperthermia (MTH) increases tumor oxygenation in a variety of experimental animal tumors Citation5–9. The report by Brizel et al. Citation10 strongly indicates that regional hyperthermia (RHT) in combination with radiotherapy improved oxygenation in human tumors. The enhanced oxygenation status of tumors resulting from MTH may also increase the tumor response to several chemotherapeutic agents Citation11–16.
Shakil et al. Citation17 reported that MTH increased perfusion and oxygen partial pressure immediately after heating in a rat tumor model. This observation is consistent with the previous observation that the heat-induced increase in tumor blood flow does not vanish within 10–30 min after heating Citation18. Even a prolonged increase in blood flow for up to 24 h after heating was observed Citation17.
In the present study we investigate changes in perfusion and partition coefficients of pelvic human tumors resulting from RHT. The partition coefficent is the volume of distribution for water, which is defined as the ratio of tissue water concentration and blood water concentration at equilibrium. Due to tracer decay and limited acquisition time, the actual partition coefficient is the volume of free water contaminated with radio-labeled water by diffusion in tissue during the acquisition period and tracer decay relative to the blood water volume. Therefore, a large partition coefficient means a large tissue fraction with preferably sufficient metabolic supply, and a reduced partition coefficient means a reduced fraction of tissue with sufficient metabolic supply. Changes in perfusion and partition coefficients are investigated using H2 15O-PET 20-90 min after heating. The dynamic PET acquisition protocol allows quantitative determination of tumor blood flow and partition coefficient in conjunction with an appropriate kinetic model. The data is analyzed using a volume of interest (VOI) placed within the tumor for generating a time-activity curve of this region. The arterial input function (AIF) is extracted from the image data by using a VOI placed in the aorta Citation19. Finally, flow and partition coefficient are determined by applying a kinetic model to the tumor time-activity curve (tumor TAC) and AIF.
Materials and methods
Patients
Twenty-seven patients with primary or recurrent pelvic tumors (15 rectal carcinomas and 12 cervical carcinomas) were investigated. The patients ranged in age from 44 to 69 years. For treatment planning, an abdominal CT with a slice thickness of 5–8 mm was acquired within 2 weeks before PET with the patient in the same position as for PET. Besides RHT the patients were treated with conventional chemotherapy, radiotherapy or a combination of both. Chemotherapy was applied 1 h before RHT and radiotherapy on those days during RHT on which no radiotherapy was performed. The investigations were approved by the local ethics committee. All patients gave their informed consent prior to the PET examinations.
Regional hyperthermia
RHT was administered regularly once a week using the BSD 2000 (BSD Medical Corporation, Salt Lake City, Utah) SIGMA 60-ring applicator. An array of four antenna pairs radiated electromagnetic waves at 90 MHz with a dorsal phase delay of 20–40° and a 5–20°C delay on the lateral pairs (supine position of the patient) Citation20. Via phase control the power deposition pattern was shifted dorsally into the presacral space. This adjustment leads to higher temperatures in presacral pelvic tumors and is better tolerated and more effective, as already assumed theoretically Citation21,Citation22.
Temperatures were measured endoluminally using Bowman thermistors (BSD Medical Corp.) in closed-end catheters placed in the rectum, bladder, vagina or above the rima ani Citation20. In all patients, tumor-associated temperatures were measured in contact with the tumor or within the tumor. The section of contact with the tumor was determined according to tumor size as measured from the anocutaneous line with endoscopy, trans-rectal ultrasound, or CT scans. The therapeutic period of RHT began as soon as a temperature of 42°C was reached in one of the tumor-related measurement points or, in case the target temperature was not reached, 30 min after the power was turned on. Continuous heat application over a period of 60 min was attempted. Temperature time curves in tumor-related reference points as well as temperature position curves were recorded and evaluated to identify predictive thermal parameters.
For our analyses, we mainly used the maximum tumor-related temperature achieved in the steady state, Tss, and in addition the duration of the steady state, tss. Other treatment parameters were total heating time (measured from switching on power till power is switched off.), tHT, number of RHT applications, N, and time interval between first RHT application and start of perfusion study, tTH.
H2 15O-PET
Tumor perfusion was investigated by water PET in all 27 study patients prior to and immediately after completion of a RHT session. The investigation was performed between the first and sixth RTH session, i.e. between the first and thirty-fifth day of RTH. In nine of these patients, post-interventional water PET was performed twice at intervals of approximately half an hour. 2D-PET scans were acquired on an ECAT-Exact/921-PET scanner (47 slices; 128 × 128 matrix; reconstructed in-plane resolution 5 mm; axial resolution 3.75 mm). A 10-min transmission scan was acquired with a 68Ge/68Ga-ring source for attenuation correction. For each scan 1.5 GBq in 6–8 mL physiological saline solution was administered as an intravenous bolus followed by 20 mL 0.9% saline solution with a flow rate of 2 mL/s. Forty-six frames were collected over an 11-min period (35 × 2 s, 8 × 30 s, 3 × 120 s) starting with the initiation of the injection. Scan data were reconstructed using filtered back-projection with corrections for attenuation, scatter, randoms, deadtime, and decay, and smoothed by a Gaussian function with 7.3 mm full width half maximum (FWHM).
Image fusion
For determination of tumor perfusion two signals have to be measured, the arterial input function (AIF), Ca(t), and the tissue activity curve, Ct(t). The tumor has to be contoured in the PET images to extract the tumor-activity time curve. Since CT allows more accurate labeling of the tumor than the H2 15O-PET images, image fusion of PET and CT was done to identify the tumor area. One method to fuse images is segmentation of identical anatomical structures in both image modalities, PET and CT. The underlying anatomical structure, which can be extracted from the water PET scans during bolus passage, are the common iliac arteries, see and .
Figure 1. 3D image after fusion with the relevant structures: CT and PET are fused in three dimensions using the surfaces of the labeled common iliac artery segment in both the CT and PET bolus images. The segmented CT common iliac artery surface is plotted in red and the PET surface in pink. The cross-section of the common iliac artery PET-label used for fusion was typically only in the range of 2-3 PET voxels. Additionally, the tumor was segmented in the CT images and the tumor VOI transferred to the PET images. The tumor surface is plotted in pink. Also, the original CT scan and a bolus PET image used for labeling are both plotted with a representative slice in their 3D fused image position.
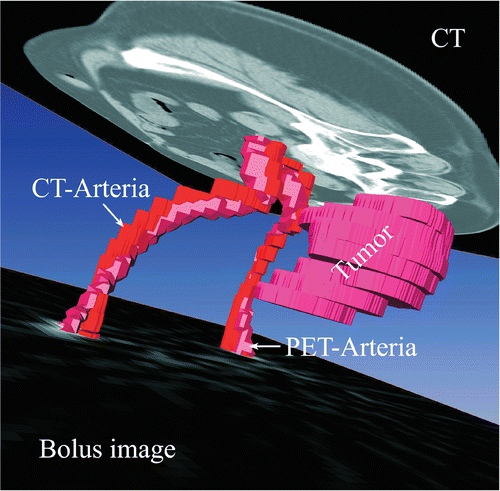
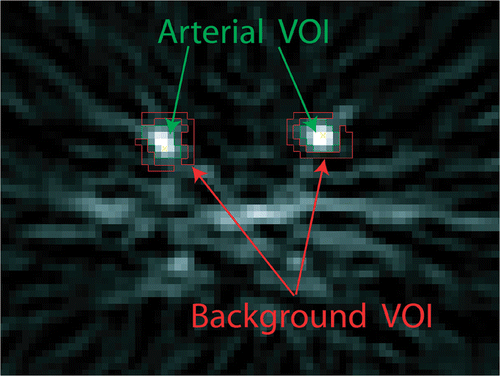
Figure 2. Labeling of the arterial and background VOIs using the bolus image.
Therefore PET and CT were fused using the anatomical structure of the common iliac arteries to extract the tumor activity–time curve: from the stack of dynamic PET images, the images of the bolus passage, approximately the first 10 s of activity inflow, were extracted. The averaged image of the bolus phase was used to label the common iliac artery, see and . In the CT image two anatomical structures were labeled, the tumor and the common iliac arteries. The PET and CT images of the labeled arteries were converted into triangulated surface datasets and automatically matched as close as possible, . Image fusion was performed by minimization of the root mean square distance between the points of the model surface to corresponding points on the reference surface (often referred to as Procrustes method): the corresponding points were the closest points on the reference surface in the Euclidean measure. The iteration of this process is called the iterative closest point algorithm (ICP). A rigid transformation with 3 degrees of freedom for translation and 3 degrees of freedom for rotation to align the CT common iliac artery surfaces to the same PET structure were allowed. The resulting transformation was utilized to project the tumor region from the CT into the PET coordinates (). For image visualization, surface generation, labeling, and image fusion, the software AMIRA version 3.1 (ZIB, Berlin) was used. The import of PET images and handling of dynamic data were performed with program modules in C++ linked to AMIRA which were developed in our institution.
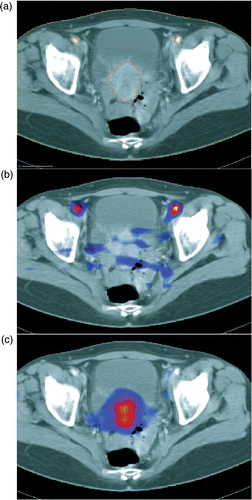
Figure 3. (a) Segmentation of common iliac artery and tumor in the CT. (b) Overlay of the bolus PET image averaged over 12 s on the fused CT. (c) Overlay PET image averaged over the total dynamic scan on the fused CT.
Perfusion evaluation
15O-water is a chemically inert, nearly freely diffusible tracer, and its behavior in tissue can be described by the following Citationequation 23,Citation24 neglecting the limited diffusion of water Citation25,Citation26:where Ct(t) is the radioactivity concentration in tissue at time t; Ca(t) is the radioactivity concentration in arterial blood at time t; F is the regional blood flow (per cm3 of perfused tissue) from plasma to tissue; and Vd is the volume of distribution for water, which is defined as the ratio between water concentration in tissue and blood at equilibrium (partition coefficient).
In addition, the tissue activity curve may be contaminated by arterial blood from vessels nearby or within the volume of interest. To compensate for these two effects, one can add a spill-over term proportional to the arterial blood activity concentration to Equation 1, which yields the following expression Citation27,Citation28:where Ci(t) is the tissue activity concentration measured from the PET image, and Va is the fraction of the arterial blood concentration that appears in the tissue.
The second parameter required for perfusion calculation is the arterial input function, Ca(t). Usually the AIF is generated from the data acquired from an arterial blood sampling or a VOI placed in the left heart ventricle. Neither of these approaches could be used in our patients. In principle, the AIF can be extracted from any artery in the region surrounding the tumor using the dynamic PET images. In pelvic tumors the common iliac artery is the largest one, and therefore used for extraction of the AIF, which was accomplished in the present study using the method validated in Citation29.
Due to the effects of signal spill-over, signal smoothing during reconstruction, limited statistics, and limited scanner resolution, the arterial signal is spread over a larger volume than that of the actual arterial lumen and contaminated by background signal. Due to pronounced signal blurring, the background TAC can be assumed to be identical for both the arterial VOI and the background tissue Citation30. However, the background VOI TAC, C't, is also contaminated by arterial signal from smaller arteries. Hence we decided to extract two TACs from the dynamic PET scan. In first approximation, they consisted due to the limited intrinsic spatial resolution of identical contributions but these were weighted differently.
The arterial VOI signal, C'a(t), consists of a large arterial (spillover free) signal contribution, Ca(t), and the contamination from the background tissue signal, Ct(t). The background tissue VOI signal, C'a(t), in turn consists mainly of tissue background signal, Ct(t), and is contaminated by arterial blood activity, Ca(t):where Ct(t) is related to Ca(t) by Equation 1. The factors kx describe the contributions of the neighboring tissues to the unaltered signals and vary with the surrounding tissue Citation31. R is the recovery coefficient necessary to correct the arterial signal for partial volume effects and signal blurring. If the size of a VOI is adjusted to collect the total activity originating from an arterial segment as demonstrated in , the recovery coefficient can be calculated Citation32:
where V'a is the VOI volume used for extracting C'a(t) and Va is the true volume of the arterial segment within the VOI. Assuming a homogeneous background the contribution of background activity to the arterial VOI signal, kt, can be calculated on the basis of geometrical considerations using the volume of the arterial VOI, V'a:
The AIF can be fitted over time by means of a function using a parameterization consisting of a gamma variate bolus Citation33 and a reflow contribution Citation34,Citation35.where Cb is the bolus activity amplitude, Cr the reflow activity amplitude, α the bolus increase, β the bolus decrease, and γ the wash-out time. Hence both extracted signal time curves, Ca-VOI(t) and Ct(t), were simultaneously fitted using a parametrized description of the arterial input function, Equation 7, the one-compartment model, Equation 1, and the assumptions defined in Equations 3 and 4 which yields adequate AIFs, as demonstrated in .
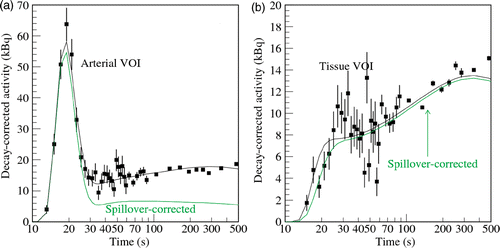
Figure 4. Original decay-corrected activity–time curves of the arterial (a) and background (b) VOIs shown in . Due to the restricted resolution and signal spill-over the arterial signal extracted from the common iliac artery is contaminated by the tissue signal and vice versa. Both TACs consist of the same two contributions but in different proportions. (a) The decay-corrected TAC determined from the arterial VOI, C'a(t), is plotted as filled boxes. The spill-over corrected arterial blood curve, RCa(t), is additionally shown. (b) The decay-corrected tissue TAC determined from the tissue VOI, C't(t), is plotted as filled boxes and the fitted curve as a line. The spill-over corrected tissue curve, Ct(t), is additionally shown.
The blood volume of the common iliac artery, Va, was measured in the fused CT images. For practical purposes the straight segment (5–7 cm) of the common iliac arteries was used for generating the AIF. CT-PET fusion, , allows accurate quantification of the arterial volume in the CT image and extraction of the AIF from the PET scan in anatomically identical arterial segments. A VOI comprising the whole bolus activity of the arterial segment was defined to extract C'a(t). All signal intensities in a range down to 10% of peak maximum were collected. Typically, the diameter of the arterial VOI was in the range of 4–5 cm including a margin of more than 1 cm around the actual common iliac artery to collect the total arterial activity spread over the image. The background curve, C't(t), was extracted using a VOI surrounding the arterial VOI (see ).
The parametrized AIF calculated in this way is used to calculate tumor perfusion and partition coefficient using Equations 1 and 2 for fitting the average tumor activity–time curve. Fitting of AIF and perfusion calculation was performed with program modules in C++ and Fortran dynamically linked to AMIRA, developed in our institution. The original code of the simplex algorithm Citation36 implemented into the AMIRA environment was used for fitting. The overall reproducibility of the evaluation was assessed by repeated evaluation of the same patients. To this end, the arterial and background VOIs were evaluated with ten significant arbitrary variations within the predefined range in three patients with different tumors in terms of perfusion (low, intermediate, and high perfusion). Additionally, the tumor VOI was reduced and extended by one voxel in each direction in each case.
Statistical analysis
Two different statistical analyses were performed using SPSS 13 for MacOS (SPSS Inc., Chicago, IL, USA). First, it was tested whether a significant change in perfusion or partition coefficient before and after RHT is statistically valid for all study patients. Since a normal distribution cannot be assumed, a non-parametric Wilcoxon test was performed. Secondly, a correlation test of perfusion and partition coefficient was performed with the parameters given in . Again, a non-parametric test, Spearman´s rho, was applied. The errors are given as standard deviations (SD).
Table I. Results of the measurements and therapeutic parameters.
Results
Image fusion could be performed in a stable and reproducible manner since a very characteristic and fine 3D structure was used. The inner structure of the common iliac arteries did not show any significant torsions between the two imaging modalities. The accuracy of image fusion for the relevant inner structures was estimated by using the root mean square of the corresponding points on the reference surface. The median root mean square was 3.1 mm, 25%-quartile 2.7 mm, 75%-quartile 3.4 mm. It can be estimated that fusion accuracy was in the range of the PET voxel size in each direction and better than effective PET image resolution. The number of degrees of freedom was sufficient for image fusion.
Reproducibility of the evaluation was investigated in the present study in three patients. The relative standard deviation was found to be 5.1% for perfusion and 5% for the partition coefficient. Nine patients were investigated twice after hyperthermia with 28 ± 8 min between the investigations. Perfusion, ΔF = 0.6 ± 8.4 mL/(min*100 cm3), and partition coefficient, ΔVd = 0.012 ± 0.077, did not differ significantly between the two measurements. The relative standard deviation between both measurements was found to be 19.2% for perfusion and 12.2% for the partition coefficient.
The results of the measurements and the therapeutic parameters are provided in . The therapeutic temperature was below 40°C in one patient, 40 ≤ 41°C in 13 patients, 41 ≤ 42°C in three patients, and ≥42°C in two patients. In four cases tumor contact temperature was not measured but only the temperature in the intergluteal cleft. Analysis of the results yielded a mean perfusion of 62.2 ± 35.7 mL/(min*100 cm3) for cervical carcinomas and a significantly different (P = 0.037) mean perfusion of 36 ± 19.3 mL/(min*100 cm3) for rectal carcinomas (see ) before RHT. Additionally, the mean partition coefficient before RHT was significantly larger (P = 0.009) for cervical carcinomas, Vd,base = 0.6 ± 0.18, than for rectal carcinomas, Vd,base = 0.46 ± 0.14.
The statistical analysis of the whole patient group did not reveal significant changes in tumor perfusion and partition coefficient after hyperthermia compared with the values before treatment. The mean total variation between measurements before and after heating was very small and within the range of methodical and statistical uncertainty, ▵F = 3.5 ± 16.0 mL/(100 min cm3), ΔVd = 0.05 ± 0.13 and, therefore, statistically non-significant. Nevertheless, the cervical and rectal carcinoma tended to behave differently regarding changes in perfusion parameters under RHT. An increase in perfusion of ▵F = 7 ± 17.8 mL/(100 min cm3 (P = 0.067) was found for the cervical carcinomas and a slight perfusion reduction for the rectal carcinomas, ▵F = −1.1 ± 11.4 mL/(100 min cm3 (P = 0.332), but neither was significant. At the same time, there was a small but non-significant (P = 0.249) reduction in the partition coefficient of the cervical carcinomas, ΔVd = 0.03 ± 0.15, whereas the partition coefficient for the rectal carcinomas was significantly increased (P = 0.005), ΔVd = 0.08 ± 0.11. Altogether, the there is a large variability within the groups for ΔVd and ▵F. The RHT treatment parameters did not significantly differ between rectal and cervical carcinomas.
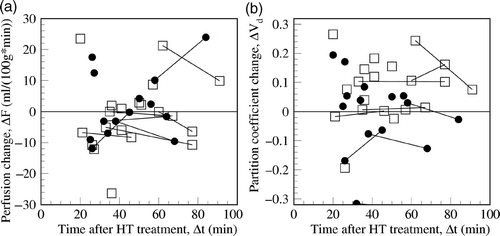
Analysis of correlation between perfusion changes and the treatment parameters listed in did not yield any significant correlations. However, statistical analysis of the partition coefficients revealed a significant correlation between increased partition coefficient and the duration of RHT with a correlation coefficient R = 0.59 and coefficient of determination, R2 = 0.35, P < 0.001 (see ). The linear correlation yielded an offset of ΔVd = −0.347 and a slope of 0.0059/min, which means that an increase in the partition coefficient can be expected for a hyperthermia duration longer than 58.7 min. On the other hand, no correlation was found with the duration of steady state temperature (see ). These results suggest that the partition coefficient increase is higher for a heating time of roughly more than 60 min and independent of the effective therapeutic time (duration of steady state temperature). Perfusion was not found to be increased 20 min after the end of RHT () while the increase in the partition coefficient persisted for more than 1 h.
Figure 5. For both the 15 rectal carcinomas (□) and the 12 cervical (•) carcinomas, the increase in partition coefficient depends on the heating time represented by the line of linear regression. The change in partition coefficient exhibits a more significant correlation with the heating time than the duration of the steady state temperature.
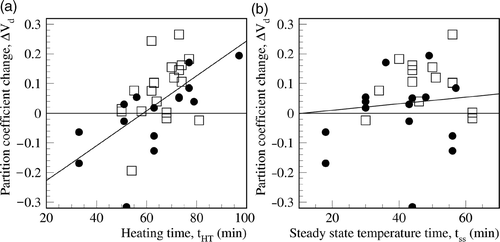
Figure 6. Neither perfusion (a) nor the partition coefficient (b) correlates with the time between switching off the hyperthermia power and the PET scan, ▵t, for the 15 rectal (□) carcinomas and 12 cervical (•) carcinomas. Investigations with two measurements after hyperthermia are connected by a line. The partition coefficient is enhanced for more than 1 h after hyperthermia.
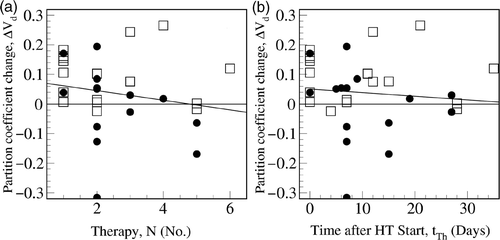
The increase in the partition coefficient showed a significant dependency on the number of treatments prior to the investigation, N, (P = 0.009) and on the time interval since the first RHT, tth (P = 0.036)(see ). The increase in the partition coefficient became less pronounced with the number of hyperthermias performed. Furthermore, no correlation with the tumor contact temperature was found.
Figure 7. The increase in partition coefficient significantly depends on the numbers of treatments, N, (A) and the time after the first hyperthermia, tTh (B), for the 15 rectal (□) carcinomas and 12 cervical (•) carcinomas demonstrated by the line of linear regression. The increase of the partition coefficient is reduced with an increasing number of therapy sessions.
Discussion
In this study we used a technique to extract the AIF from a peripheral artery. The technique allowed absolute quantification of perfusion without arterial blood sampling. On the other hand, not using arterial blood sampling during measurement significantly increased the statistical uncertainty in calculating perfusion. The repeated evaluation revealed an uncertainty of the errors concerning the VOI definition in three patients. The relative standard deviation was found to be 5.1% for perfusion and 5% for the partition coefficient. Since no significant variation of perfusion or partition coefficient with the time after hyperthermia was found, the relative difference between both measurements after regional hyperthermia can be used to assess the overall reproducibility of our measurements including image acquisition. Overall accuracy was found to be 19.2% for perfusion and 12.2% for the partition coefficient. While better accuracy would be useful, the mean accuracy of the method was sufficient to identify significant changes in perfusion and partition coefficient. The distribution of tumor perfusion found here is as heterogeneous as described for other tumor entities Citation37, whereas the partition coefficient varies over a wider range than published for another single tumor entity, i.e. lung cancer Citation37. Since an extremely heterogeneous population was investigated the outcome should not be surprising. Nevertheless, the analysis evaluation technique applied here provides perfusion values 104 ± 52% above and partition coefficients −31.6 ± 24.2% below those determined by using the AIF calculated from blood samples Citation19.
The capillary-like vessels newly formed in tumors are not capable of autoregulation because they are devoid of smooth muscle and innervation. Such tumor blood vessels cannot respond to external stimuli including RHT. However, the tumor vessels communicate with normal arterioles of the host that are incorporated into the growing tumor mass. It is widely believed that dilation of these normal arterioles by RHT would inevitably increase the blood perfusion pressure and blood flow in the tumor vessels as well. In our study we did not find an increase in perfusion but an increase in the partition coefficient 20–90 min after heating.
It has been reported that blood flow through the capillary-like tumor vessels is often inefficient resulting in hypoxia Citation38–41. A decreased baseline partition coefficient indicates not only hypoxic but also necrotic tumor areas because the radio-labeled water does not enter such areas within a few decay times. Water-soluted inert gases, for instance oxygen, diffuse like water itself. The partition coefficient increase corresponds to an increase in the diffusion length of water. Therefore it can be concluded that the oxygen diffusion length is also increased, resulting in reoxygenation of hypoxic cells. Consequently, reoxygenation of hypoxic tumor cells might be achieved by RHT Citation5–9.
The increase in the partition coefficient indicates an improved diffusion of water. Water tissue diffusion consists of two components, a fast interstitial diffusion and a slow cellular diffusion Citation42. An increase in interstitial diffusion can be achieved by reducing interstitial diffusion resistance, i.e. by enlarging the interstitial space Citation43,Citation44. This is caused by either enhanced storage of water in the interstitium or (less probably) shrinkage of cells. The former is known as a clinical phenomenon in that peritumoral edema can exaggerate symptoms during and after heat treatment Citation45. An increased cellular water exchange would also enhance water diffusion. The precise mechanisms and the relative importance of the components are not known at present and need further investigation. Furthermore, it is unclear if improved diffusion actually improves oxygenation.
The increase in diffusion does not necessarily occur as an immediate response but is typically observed after heating for more than 60 min, suggesting that it takes some time before the changes on the cellular level induced by hyperthermia become effective. This phenomenon did not exhibit reversibility during the first hour after heating. Nevertheless, most of the cellular changes induced by hyperthermia and monitored here are reversible. Heating at weekly intervals may induce regeneration of tumor water diffusion, thereby increasing the frequency of hyperthermia treatments may be advantageous for better tumor oxygenation.
Conclusions
Whatever the mechanisms may be, the increase in tumor oxygenation 1 h after RHT may have significant clinical implications for the use of RHT in combination with fractionated radiotherapy. Supporting this conclusion, the report by Brizel et al. Citation10 strongly indicates that RHT in combination with radiotherapy improves oxygenation in human tumors. The results obtained in the present study as well as in previous studies Citation6,Citation8,Citation9 suggest that heating of human tumors at temperatures attainable with presently available hyperthermia devices may increase tumor oxygenation, and thus overcome hypoxic radioprotection in radiotherapy. The increase in tumor oxygenation induced by RHT may also increase the susceptibility of tumors to several chemotherapeutic agents Citation11–14. Further investigations are necessary to identify the optimal heating conditions that most effectively increase oxygenation in human tumors and to study the combined effects of fractionated radiation and multiple hyperthermia treatments on tumor pO2.
Declaration of interest: The authors report no conflicts of interest. The authors alone are responsible for the content and writing of the paper.
References
- Overgaard J, Gonzalez-Gonzalez D, Hulshof MCCM, Arcangeli G, Dahl O, Mella O, Bentzen SM. Randomized trial of hyperthermia as adjuvant to radiotherapy to recurrent or metastatic malignant melanoma. Lancet 1995; 345: 540–543
- Vernon CC, Hand JW, Field SB, Machin D, Whaley J, van der Zee J, van Putten WL, van Rhoon GC, van Dijk JDP, Gonzalez-Gonzalez D, et al. Radiotherapy with or without hyperthermia in the treatment of superficial localized breast cancer-results from five randomized controlled trials. Int J Radiation Oncology Biol Phys 1996; 35: 731–744
- Hildebrandt B, Wust P, Ahlers O, Dieing A, Screenivasa G, Kerner T, Felix R, Riess H. The cellular and molecular basis of thyperthermia. Crit Rev Oncol Hematol 2002; 43: 33–56
- Oleson JR. Hyperthermia from the clinic to laboratory: A hypothesis. Int J Hyperthermia 1995; 11: 315–322
- Bicher HI, Hetzel FW, Sandhu TS, Frinak S, Vaupel P, O’Hara D, O’Brien T. Effects of hyperthermia on normal and tumor microenvironment. Radiology 1980; 137: 523–530
- Griffin RJ, Okajima K, Barrios B, Song CW. Mild temperature hyperthermia combined with carbogen breathing increases tumor partial pressure of oxygen (pO2) and radiosensitivity. Cancer Res 1996; 56: 5590–5593
- Hetzel FW, Chopp M, Dereski MO. Variations in pO2 and pH response to hyperthermia: Dependence on transplant site and duration of treatment. Radiat Res 1992; 113: 152–156
- Iwata K, Shakil A, Hur WJ, Makepeace CM, Griffin RJ, Song CW. Tumour pO2 can be increased markedly by mild hyperthermia. Br J Cancer 1996; 74: S217–221
- Song CW, Shakil A, Osborn JL, Iwata K. Tumour oxygenation is increased by hyperthermia at mild temperatures. Int J Hyperthermia 1996; 12: 367–373
- Brizel DM, Scully SP, Harrelson JM, Layfield LJ, Dodge RK, Charles HC, Samulski TV, Prosnitz LR, Dewhirst MW. Radiation therapy and hyperthermia improve the oxygenation of human soft tissue sarcomas. Cancer Res 1996; 56: 5347–5350
- Burton MA, Chen Y, Atkinson H, Codde JP, Jones SK, Gray BN. In vitro and in vivo responses of doxorubicin ion exchange microspheres to hyperthermia. Int J Hyperthermia 1992; 8: 845–894
- Khalek Y, Vilor M, Sorrentino J, Brown M, Wills J, Herrera L. Complete disappearance of a leiomyosarcoma of the lower extremity following preoperative hyperthermia and intra-arterial doxorubicin. J Surg Oncol 1993; 52: 272–275
- Miller RC, Richards M, Baird C, Martin S, Hall EJ. Interaction of hyperthermia and chemotherapy agents: Cell lethality and oncogenic potential. Int J Hyperthermia 1994; 10: 89–99
- Wong M, Urano K. Enhancement of misonidazole chemosensitization effect by mild local hyperthermia. Int J Radiation Oncology Biol Phys 1992; 23: 593–598
- Song CW, Park HJ, Lee CK, Griffin R. Implications of increased tumor blood flow and oxygenation caused by mild temperature hyperthermia in tumor treatment. Int J Hyperthermia 2005; 21: 761–767
- Dewhirst MW, Vujaskovic Z, Jones E, Thrall D. Re-setting the biologic rationale for thermal therapy. Int J Hyperthermia 2005; 21: 779–790
- Shakil A, Osborn JL, Song CW. Changes in oxygenation status and blood flow in rat tumor model by mild hyperthermia. Int J Radiation Oncology Biol Phys 1999; 43: 858–865
- Song CW, Rhee JG, Haumschild DJ. Continuous and noninvasive quantitation of heat-induced changes in blood flow in skin and RIF-1 tumor of mice by laser Doppler flowmetry. Int J Hyperthermia 1987; 3: 71–77
- Lüdemann L, Sreenivasa G, Michel R, Rosner C, Plotkin M, Felix R, Wust P, Amthauer H. Corrections of arterial input function for dynamic PET to assess perfusion of pelvic tumours: Arterial blood sampling versus image extraction. Phys Med Biol 2006; 51(11)2883–2900
- Wust P, Gellermann J, Harder C, Tilly W, Rau B, Dinges S, Schlag P, Budach V, Felix R. Rationale for using invasive thermometry for regional hyperthermia of pelvic tumors. Int J Radiat Oncol Biol Phys 1998; 41: 1129–1137
- Feldmann HJ, Molls M, Adler S, Meyer-Schwickerath M, Sack H. Hyperthermia in eccentrically located pelvic tumors: Excessive heating of the perineal fat and normal tissue temperatures. Int J Radiat Oncol Biol Phys 1991; 20: 1017–1022
- Wust P, Stahl H, Loeffel J, Seebass M, Riess H, Felix R. Clinical, physiological and anatomical determinants for temperature elevations in radiofrequency hyperthermia. Int J Hyperthermia 1995; 11: 151–167
- Kety SS. The theory and applications of the exchange of inert gas at the lungs and tissues. Pharmacol Rev 1951; 3: 1–41
- Kety SS. Theory of blood-tissue exchange and its application to measurement of blood flow. Meth Med Res 1960; 8: 223–227
- Herscovitch P, Raichle ME, Kilbourn MR, Welch MJ. Positron emission tomographic measurement of cerebral blood flow and permeability-surface area product of water using [15O]water and [11C]butanol. J Cereb Blood Flow Metab 1987; 7: 527–542
- Berridge MS, Adler LP, Nelson AD, Cassidy EH, Muzic RF, Bednarczyk EM, Miraldi F. Measurement of human cerebral blood flow with [15O] butanol and positron emission tomography. J Cereb Blood Flow Metab 1991; 11: 707–715
- Ohta S, Meyer E, Fujita H, Reutens DC, Evans A, Gjedde A. Cerebral [15O]water clearance in humans determined by PET: I. Theory and normal values. J Cereb Blood Flow Metab 1996; 16: 765–780
- Lodge MA, Carson RE, Carrasquillo JA, Whatley M, Libutti SK, Bacharach SL. Parametric images of blood flow in oncology PET studies using 15O-water. J Nucl Med 2000; 41: 1784–1792
- Lüdemann L, Sreenivasa G, Michel R, Rosner C, Plotkin M, Felix R, Wust P, Amthauer H. Corrections of arterial input function for dynamic H215O PET to assess perfusion of pelvic tumours: Arterial blood sampling versus image extraction. Phys Med Biol 2006; 51: 2883–900
- Watabe H, Channing MA, Riddell C, Jousse F, Libutti SK, Carrasquillo JA, Bacharach SL, Carson RE. Noninvasive estimation of the aorta input function for measurement of tumor blood flow with. IEEE Trans Med Imaging 2001; 20: 164–174
- Chen K, Bandy D, Reiman E, Huang SC, Lawson M, Feng D, Yun LS, Palant A. Noninvasive quantification of the cerebral metabolic rate for glucose using positron emission tomography, 18F-fluoro-2-deoxyglucose, the Patlak method, and an image-derived input function. J Cereb Blood Flow Metab 1998; 18: 716–723
- Kessler RM, Ellis JR, Jr, Eden M. Analysis of emission tomographic scan data: Limitations imposed by resolution and background. J Comput Assist Tomogr 1984; 8: 514–522
- Thompson HK, Starmer CF, Whalen RE, McIntosh HD. Indicator transit time considered as a gamma variate. Circulation Res 1964; 14: 502–515
- Blomley MJ, Dawson P. Bolus dynamics: Theoretical and experimental aspects. Br J Radiol 1997; 70: 351–359
- Lüdemann L, Hamm B, Zimmer C. Pharmacokinetic analysis of glioma compartments with dynamic Gd-DTPA-enhanced MRI. Magn Reson Imaging 2000; 18: 1201–1214
- Chandler JP. STEPIT: Finds local minima of a smooth function of several parameters (CPA 312). Behav Sci 1969; 14: 81–82
- Hoekstra CJ, Stroobants SG, Hoekstra OS, Smit EF, Vansteenkiste JF, Lammertsma AA. Measurement of perfusion in stage IIA-N2 non-small cell lung cancer usion H215O and positron emission tomography. Clin Cancer Res 2002; 8: 2109–2115
- Intaglietta M, Myers RR, Gross JF, Reinhold HS. Dynamics of microvascular flow in implanted mouse mammary tumors. Bibl Anat 1977; 15: 273–276
- Reinhold HS, Blachiewicz B, Berg-Blok A. Oxygenation and reoxygenation in 'sandwich’ tumors. Bibl Anat 1977; 15: 270–272
- Secomb TW, Hsu R, Ong ET, Gross JF, Dewhirst MW. Analysis of the effects of oxygen supply and demand on hypoxic fraction in tumor. Acta Oncologia 1995; 34: 313–316
- Vaupel F, Kallinowski P, Okunief P. Blood flow, oxygen and nutrient supply, and metabolic microenvironment of human tumors: A review. Cancer Res 1989; 49(23)6449–6465
- van Zijl PCM, Moonen CTW, Faustino P, Pekar J, Kaplan O, Cohen JS. Complete separtion of intracellular and extracellular information in NMR spectra of perfused cells by diffusion-weighted spectroscopy. Proc Natl Acad Sci 1991; 88: 3228–3232
- Nicolson C, Phillips JM. Ion diffusion modified by tortuosity and volume fraction in the extracellular microenviroment of the rat cerebellum. J Physiol 1981; 321: 225–257
- Lundbæk JA, Hansen AJ. Brain interstitial volume fraction and tortuosity in anoxia. Evaluation of the ion-selective micro-electrode method. Acta Physiol Scand 1992; 146: 473–484
- Leopold KA, Harrelson J, Prosnitz L, Samulski TV, Dewhirst MW, Oleson JR. Preoperative hyperthermia and radiation for soft tissue sarcomas: Advantage of two vs. one hyperthermia treatments per week. Int J Radiat Oncol Biol Phys 1989; 16: 107–115