Abstract
In clinical applications of magnetic nanoparticle hyperthermia for cancer treatment it is very important to ensure a maximum damage to the tumor while protecting the normal tissue. The resultant heating pattern by the nanoparticle distribution in tumor is closely related to the injection parameters. In this study we develop an optimization algorithm to inversely determine the optimum heating patterns induced by multiple nanoparticle injections in tumor models with irregular geometries. The injection site locations, thermal properties of tumor and tissue, and local blood perfusion rates are used as inputs to the algorithm to determine the optimum parameters of the heat sources for all nanoparticle injection sites. The design objective is to elevate the temperature of at least 90% of the tumor above 43°C, and to ensure only less than 10% of the normal tissue is heated to temperatures of 43°C or higher. The efficiency, flexibility and capability of this approach have been demonstrated in a case study of two tumors with simple or complicated geometry. An extensive experimental database should be developed in the future to relate the optimized heating pattern parameters found in this study to their appropriate nanoparticle concentration, injection amount, and injection rate. We believe that the optimization algorithm developed in this study can be used as a guideline for physicians to design an optimal treatment plan in magnetic nanoparticle hyperthermia.
Introduction
Although magnetic nanoparticle hyperthermia was developed in the 1950s Citation1, it is still at an early stage of development in the treatment for tumors. In this method, superparamagnetic magnetic nanoparticles can deliver adequate heating to irregular and/or deep-seated tumors when exposed to relatively low magnetic field at low frequency. The heat generated by these particles when exposed to an external alternating magnetic field is mainly due to the Néel relaxation and/or Brownian motion of the particles Citation2–3. Previous studies Citation4 showed that iron oxides magnetite Fe3O4 and maghemite γ − Fe2O3 nanoparticles are biocompatible in human tissue Citation5. Different methods exist to deliver nanoparticles to the tumor: either systemically if the blood vessels of the diseased organ are well known, or by directly injecting the nanoparticles into the extracellular space of the tumor. The direct injection method is the focus of this study and its advantage is that multiple-site injections can be exploited to cover the entire target region in the case of an irregularly shaped tumor. The success of this approach to kill tumor relies on its ability to elevate temperatures above a certain threshold in the entire tumor with minimal thermal damage to the surrounding healthy tissue.
This approach has been used to treat tumors in liver Citation6 and breast Citation4,Citation7. The clinical study by Johannsen and Jordan Citation8–10 focused on testing magnetic fluid hyperthermia on prostate cancer. In the studies of Johannsen and Jordan, the histological analysis of the cancerous tissues showed a partial necrosis of the cells after the treatment. These experiments have demonstrated the feasibility of elevating the tumor temperature to a desired level; however, in some tumor regions, usually at the tumor periphery, under-dosage of heating (temperature increases lower than a critical value) was observed.
The achieved distribution of the temperature elevation and the heating duration are the main factors that affect the direct cell-killing and anti-cancer immune response phenomena. The temperature distribution is determined by heat conduction in tissue and distribution of the heat generation. Typically, heat generation in the hyperthermia process is described by a quantity SAR (specific absorption rate). Previous investigations have demonstrated that particle size, particle coating, and magnetic field strength and frequency determine its heating capacity defined as the specific loss power (SLP) Citation2,Citation3,Citation11,Citation12. However, for a given type of the particles and the magnetic field strength used in a treatment procedure, the spatial distribution of the particles dispersed in tissue dominates the distribution of the SAR and the corresponding spatial temperature elevation. A recent experimental study in a tissue-equivalent agarose gel by our group has shown that the particles were confined in the vicinity of the injection site and that their concentration was not uniform after the injection. The particle deposition was greatly affected by the injection rate and amount Citation13. An in vivo experimental study performed on rat hind limbs Citation14 showed that the SAR around the injection site can be approximated by Gaussian distribution , where r is the spatial distance from the injection site, A represents its maximum value and r0 represents how far from the injection site the heating is affecting the tissue. A spherical SAR distribution is possible when a very low injection rate is applied Citation13,Citation14. The SAR distribution was determined based on measured temperature elevations in the rat hind limb. It was found that the injection amount affected the parameters of the SAR distribution Citation14. The knowledge of a SAR expression allows us to determine the temperature distribution in the vicinity of an injection site at a specific injection rate, amount, and initial ferrofluid concentration. A single injection usually results in a nearly spherical-shaped region with thermal damage. For large-sized and irregular-shaped tumors, it is imperative to employ a multi-site injection technique so that a sufficiently high temperature elevation within the entire tumor can be achieved. The main challenge in this type of clinical applications is how to obtain an optimized design of the locations of the injection sites and the ferrofluid injection rate, amount and initial ferrofluid concentration at each site to ensure the maximum damage to tumor and minimize the temperature elevation in the surrounding healthy tissue.
The goal of any optimization problem is to minimize or maximize a so-called ‘objective function’ as a function of a set of parameters. In hyperthermia treatments of tumors, the region in a tumor and its boundary having a temperature above a certain threshold should be maximized while the temperature elevations in the surrounding normal tissue have to be minimized. The objective function is then formulated based on these criteria. Kumaradas and Sherar Citation15 proposed to simultaneously minimize the fraction of damaged volume in the normal tissue and to maximize that of the tumor. This double objective function problem was converted to a single scalar variable using those two factors representing the relative importance of the two minimization criteria. Siauve et al. Citation16 maximized the ratio of the total heat absorbed by the tumor to that by the healthy tissue using a genetic algorithm method. In a more recent study, Bagaria and Johnson Citation17 performed optimization calculations to match the obtained temperature profile with an ideal temperature distribution in both the tumor and normal tissue. The objective function consisted of two weighted penalty functions. The first is related to the square error between the tumor temperatures and the necrosis temperature; and the second is related to the square error between the normal tissue temperature and the normal body temperature. It was also found that the optimization of the SAR distribution significantly enhanced the thermal damage to the tumor. However, the optimization was performed based on a quadratic decaying function proposed for the SAR in the tumor region during a magnetic nanoparticle hyperthermia. This expression was not based on any physical measured entities and no explanation was provided for the choice of the function. To the authors’ best knowledge, a general optimization of three-dimensional heating pattern and multi-site injection strategy for clinical applications has not been conducted for nanoparticle hyperthermia.
The objective of the current study is to develop a general algorithm for physicians to design an optimized multi-site injection strategy. The Pennes bioheat equation is first used to determine the thermally affection region (d43) based on a single injection in an infinitely large tissue domain. Given an arbitrary irregularly shaped tumor embedded in a normal tissue region, an initial guess of the locations of multiple injection sites and the associated SAR distribution can be made based on the results from the Pennes equation. The Pennes bioheat equation is then applied to determine the temperature fields in both the tumor and normal tissue for the implemented injection sites and heat source. Through a systematic optimization strategy, we obtain the SAR distribution-related parameters (the values for A and r0) for each injection site to maximize the total volume of tumor above 43°C while minimizing the temperature elevations in the normal tissue. Since the SAR distribution should be correlated with the injection amount and injection rate at an individual injection site, the appropriate injection strategy can be thus obtained in future clinical studies.
Model formulation
The model proposed in this study will give guidance to physicians to select appropriate ferrofluid amounts, injection rates and initial ferrofluid concentration in a multi-site injection procedure of magnetic nanoparticle hyperthermia. As mentioned in the introduction, these entities are directly related to the parameters in the SAR expression Ai and r0,i where i is the index of an injection site. In fact, we found in our previous experimental study in agarose gel Citation13 that for a given gel concentration, a high injection rate leads to a higher concentration of the nanoparticles close to the injection site. Therefore, a higher injection rate would more likely lead to a bigger value of A and a smaller r0. In our in vivo experiment Citation14, it was shown that a bigger amount of injected nanoparticles leads to a higher concentration next to the injection site, hence, to a bigger A and a smaller r0. The Pennes bioheat Citationequation 18 is applied first to provide the initial guess of the SAR expression at each injection site for the optimization. We then develop a tumor model with an irregular shape and embedded in a tissue region. Using the Pennes bioheat equation to determine the 3-D temperature fields in both the tumor and normal tissue, we optimize a proposed objective function so that the damage to the tumor is maximized while it is minimized in the normal surrounding tissue. Currently, the Levenberg-Marquardt method, the conjugate directions methods and Simplex methods are techniques for solving optimization problems Citation19,Citation20. In complicated heat transfer optimization problems, the algorithm requires a numerical method for each iteration to determine the temperature field. In such cases, the gradients of the objective function are unknown. Hence, the derivative-free Nelder Mead Simplex method is implemented in this study as an optimization method since its algorithm does not involve computing the gradients of any function.
The initial guess of the dTn using the Pennes bioheat equation
One of the limitations of the Nelder-Mead Simplex method is its sensitivity to the choice of the initial parameters. To provide a reasonable initial guess to the SAR distribution, we first employ the Pennes bioheat equation to simulate the thermally affected region induced by a single injection of nanoparticles. The thermally affected region is defined as a region which temperatures are above certain threshold, Tn. The SAR expression is assumed following the spherical Gaussian's distribution,where A is the maximum value of the SAR at the center of the injection and r0 is a dimensional radius that is associated with how far from the injection site the heating is affecting the tissue. Substituting the SAR expression into the steady state Pennes bioheat equation, one obtains,
where k is tissue thermal conductivity, T is temperature, ρb, cp,b and ωb,t are blood density, specific heat and specific local perfusion rate, respectively, and Ta is local arterial blood temperature. Note that the temperature field is one-dimensional and only depends on the radial distance from the injection site. It can be solved analytically. The detailed derivation can be found in the Appendix. The following equation gives the steady state temperature distribution in tissue,
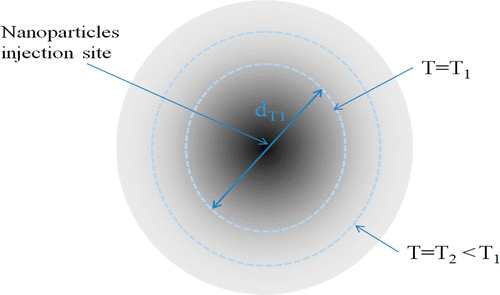
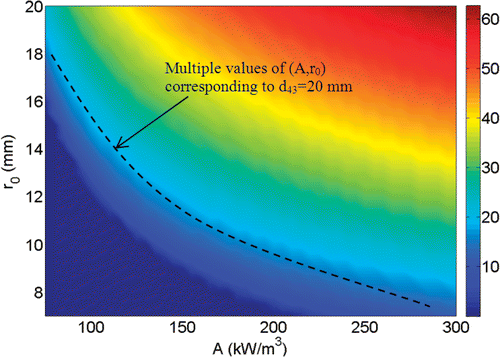
The temperature field depends on the radial distance, local blood perfusion rate, and the SAR-related parameters. Since the temperature distribution is spherical, one can define an entity dTn as the diameter of the thermally affected region, inside which the temperature is higher than or equal to Tn (). For each set of A and r0, and a given blood perfusion rate, a value of dTn can be determined based on the calculated temperature distribution. As described later, dTn will be used to identify the initial guess for solving the optimization problem. For each value of dTn there exist more than one set of A and r0. Hence, to select the initial set, either A or r0 should be fixed and the other be calculated, as described later in the section of optimization scheme.
Mathematical model of the tumor and surrounding tissue
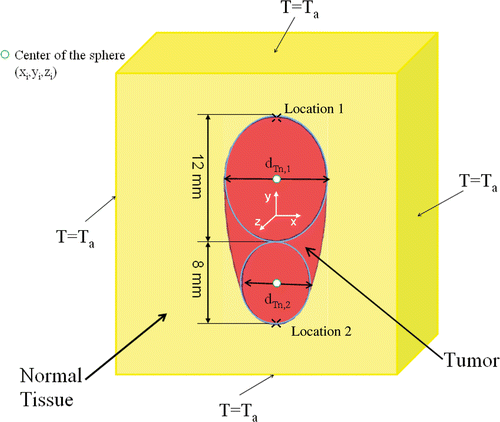
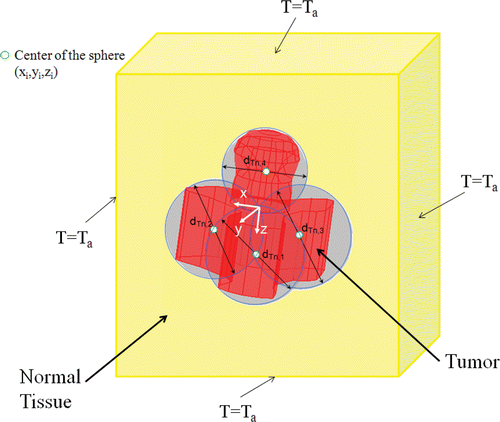
An irregularly shaped tumor is assumed to be embedded in a large cubical domain of normal tissue as shown in and . The size of the cubical domain was chosen large enough so that the boundary effects on the temperature distribution are negligible. The thermal properties of the tumor, tissue and blood are assumed to be constant. The three-dimensional Pennes bioheat Citationequation 18 is given in Equation 4 for both the normal tissue and tumor temperature, respectively.where T is either tissue or tumor temperature, k is the thermal conductivity of the tissue and tumor, ρb and cp,b are the blood density and the blood specific heat in both tumor and normal tissue, ωb is the local blood perfusion rates in the normal tissue and tumor. The last term in Equation 4 represents the heat sources generated in the vicinity of the nanoparticle injection sites and the nanoparticle heating occurs mainly in the tumor region. M is the number of injections and ri is the radial distance from injection site i and is given by Equation 5,
where xi, yi and zi are the Cartesian coordinates of injection site i. The boundary conditions for this problem are applied so that the temperatures at the outer border of the normal tissue are equal to Ta. The heat generation term in Equation 4 was programmed and implemented in the optimization algorithm using the Matlab interface of Comsol® Multiphysics.
Optimization scheme
Objective function
In any hyperthermia treatment for tumor, one would ensure a complete necrosis of the tumor region while protecting the normal tissue. Such task is fulfilled when the temperature inside the tumor is higher than or equal to Tn while the temperature in the normal tissue region is less than Tn. Furthermore, to ensure that the whole tumor acquired the temperature Tn, the boundary separating the tumor from its surrounding tissue also has to achieve the same temperature. In other words, the volume of the region inside the tumor and the tumor boundary area having a temperature higher than Tn should be maximized. We first define two percentages R1 and R2 as:
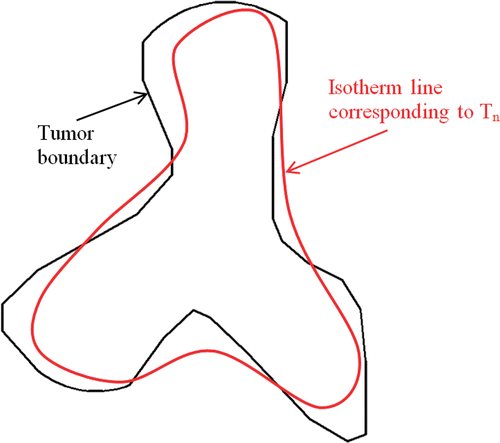
R1 is the volume percentage of the tumor region with T ≥ Tn over the entire tumor region and R2 is the area percentage of the tumor boundary where T ≥ Tn over the entire tumor surface. During optimization, the magnitude of the nanoparticle heating in the tumor can be increased so that both R1 and R2 can reach 100%. However, the constraint here is minimizing the damage to the surrounding normal tissue. One way to address the constraint is to introduce a third parameter E, which represents the deviation of the tumor boundary temperature from Tn Citation17. The dimensionless parameter E is defined as the summation of the square error between the temperature of the tumor boundary and Tn.where Tj is the temperature at the tumor boundary (node j). Note that all three parameters are dimensionless. Based on the above considerations, the objective is to maximize both R1 and R2, as well as to minimize E. The expected temperature field after optimization would yield a minimal deviation of the isotherm line corresponding to Tn from the tumor boundary, as shown in . We notice that our optimization problem involves both maximizing and/or minimizing different quantities simultaneously Citation15,Citation16. This task should be expressed in the objective function proposed in Equation 8.
We use the Nelder-Mead Simplex method Citation21 that can handle non-linearities and discontinuities to minimize the objective function f and to optimize both Ai and r0,i.
The effectiveness of the nanoparticle hyperthermia is evaluated by two parameters, one is the T90,tumor in the tumor region and the other is the T10,tissue value in the surrounding tissue region. Tp is defined as the temperature exceeded by p% of a certain region Citation22. Both inequalities T90,tumor ≥ Tn and T10,tissue ≤ Tn suggest that the treatment will lead to more than 90% of the tumor region reaching the threshold temperature of Tn, while less than 10% of the normal tissue region is subjected to thermal damage.
The optimization procedure
The optimization procedures run as follows.
Based on the geometry of the irregularly shaped tumor, several spheres are drawn in the tumor. In the current study, we assume that the centers of the spheres are pre-selected and they are the locations of the injection sites such that the spheres cover almost all the tumor periphery as shown in and . The diameter of each sphere, dTn,init is measured.
Based on the solution of the Pennes bioheat equation on an infinite domain (see the Appendix), suitable sets of Ainit and r0,init are calculated based on the measured dTn,init. Since there are more than one set of A and r0 available for any dTn, we select r0,init as equal to
. This is based on the consideration that 95% of the nanoparticles are injected within this spherical domain. Once r0 is known, the initial value of A can then be determined based on .
Those A and r0 values for different injection sites are used as the initial guess for the optimization problem and the Nelder-Mead Simplex method is used to minimize f.
Tumor geometry and numerical method
We performed case studies using two geometric shapes of tumor as shown in and to demonstrate the feasibility of the optimization algorithm. The first geometry is axis-symmetric. The second shape was randomly modeled on Pro Engineer Wildfire 2.0 and then imported to the numerical method software Comsol® Multiphysics. Both tumors have an overall longitudinal size of 20 mm. The simulation domain of the tissue which is a 4096 cm3 cube is very large to ensure that the boundary condition on the surface is equal to 37°C. However, we calculated the T10,tissue based on a much smaller cubical domain surrounding the tumor and having a length only twice the tumor's average dimensions. The volumes of the tissue region for the T10,tissue are different for both cases since they are based on the tumor average dimensions. The volume of the first and second tumors is 1.55 and 2.14 cm3 respectively. The differential equations were solved using the finite element solver of Comsol® Multiphysics 3.4. The mesh was finer inside the tumor with a growth factor of 1.1 starting from the tumor boundary toward the normal tissue. The total number of the quadratic elements and degrees of freedom were around 166,000 and 226,000, respectively, for both tumor models. The mesh sensitivity was checked by multiplying the total number of the elements by four and finding that the global result differed by less than 1%. The optimization computations were performed at both variable and function tolerance of 10−4.
Results
All the computations in this study are performed for Tn = 43°C, which is considered as a threshold temperature to induce cell necrosis within a reasonable time duration. The values of the thermal conductivities for the normal tissue ktissue and for the tumor ktumor are chosen to be 0.5 and 0.55 W/m°C, respectively, and the blood density ρb and specific heat cp,b are assumed to be 1000 Kg/m3 and 4200 J/Kg°C respectively Citation17. The initial guess is calculated based on a specific blood perfusion rate in the tumor ωb,t. For ωb,t = 1.25.10−3 s−1 Citation17, we calculate dTn for multiple values of A and r0. The results are shown in . Clearly, higher values of A and r0 result in a bigger temperature region higher than 43°C and lead to a bigger value of d43. For the same d43, more than one sets of A and r0 are available (see ).
The optimization algorithm was applied to the first (simple) tumor. Since the local blood perfusion rate of tumor may be quite different from that of normal tissue Citation23, we selected the blood perfusion rate in tissue as ω = 5.10−4 s−1 Citation14,Citation24. Based on the tumor geometry, two injection sites are selected and the initial guess of A and r0 were estimated (). The optimization algorithm converged after approximately 60 iterations. For the first tumor, one notices that the initial guess leads to a T10,tissue that is greater than 43°C, even if the initial T90,tumor has satisfied the design objective. The optimization has resulted in a much smaller value of T10,tissue (41.79°C), which is about two degrees less than its initial value. The optimization result is further illustrated by the color contours in . The boundary of the tumor is represented by the solid line while the isotherm of 43°C can be seen by the light blue line. Small deviation between the tumor surface and the isotherm is evident in , especially in the middle portion of the tumor where the tumor surface deviates from the spherical shape.
Figure 6. Temperature contours in the simple tumor geometries after optimization. The tumor boundary is represented by the black solid line and the isotherm of 43°C is by the light blue dash line. Note that the z-direction is perpendicular to the 2-D x-y plane. The coordinates are normalized by 20 mm which is the longitudinal length of the tumor.
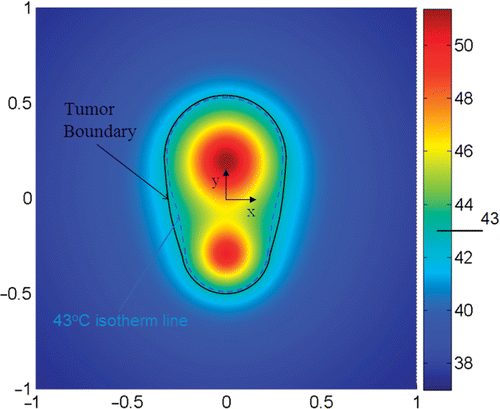
Table I. Summary of the initial and optimized values for the first tumor geometry shown in when ω = 5.10−4 s−1, ωt = 1.25.10−3 s−1.
For the first geometry, analyses were performed to check for the sensitivity of the optimization result to the initial guess of A and r0. The initial values of r0,1 and A1 were either increased or decreased by 5%. shows that r0 and A converge to the same values when the initial guesses vary ±5%. Bigger variations in the initial guesses did not result in the same optimum solution. As shown in , changing the initial values by 10% or 20% will result in changes in A and r0, however, the optimization objective of T90,tumor > 43°C and T10,tissue < 43°C is still satisfied.
Figure 7. Convergence curves for A1 (a) and r0,1 (b) and the sensitivity of the convergence to a 5% change in the initial values.

Table II. The effect of changing the initial values of A and r0 by 10% and 20% on the optimum values and on the T90,tumor and T10,tissue.
As stated in the model formulation, the injection sites are pre-selected based on the geometry of the tumor. A poorly selected injection site may not yield a design which satisfies both T90,tumor > Tn and T10,tissue < Tn. The sensitivity of the optimization algorithm to the pre-determined injection sites was evaluated by changing the location of the sites by a small variation along the axis of the tumor. We consider two situations: either the injection sites are moved away from each other or towards each other. The results are expressed in terms of the T90,tumor and T10,tissue in . Our results have demonstrated that moving the injection locations away or close to each other by 2.5% of the total length of the tumor leads to a minor increase in T90,tumor with no significant change in T10,tissue. However, moving the injection sites by more than 10% fails to guarantee a T90,tumor bigger than 43°C, as shown by the bold columns in .
Table III. The effect of varying the injection sites by a small distance on the optimization results for the first tumor geometry.
We also test the sensitivity of the optimum values of A and r0 to changes in the blood perfusion rate in the tumor. The resulting optimum values of A can be affected significantly as shown in . Our results have demonstrated that an increase of 10% or 50% in the tumor blood perfusion rate results in an increase in the value of A by 3% and 16% respectively while satisfying almost the same treatment goals. We note that the optimization algorithm still works fine with different blood perfusion rates. This is expected since local blood perfusion rate has been demonstrated to play a significant role in determining the local temperature field in tumor. The large blood perfusion rate acts as a heat sink and carries away the heat induced by the nanoparticle heat generation.
Table IV. The effect of increasing the tumor blood perfusion rate on the optimization results for the first tumor geometry.
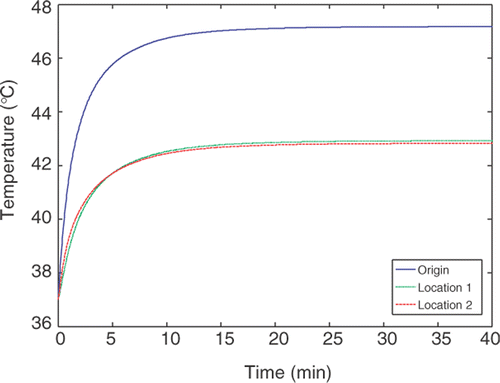
In this paper, we perform the optimization process in steady state to determine the heating pattern by nanoparticles due to the restriction of the available computational resources. Although simulating the transient process of the temperature distribution in tumor is not the focus of the current paper, we performed simulations to predict the transient temperature elevations in the tumor using the optimized heating pattern for the first geometry. As shown in , temperature distribution inside the tumor is plotted for various time instants. It takes less than 30 minutes to establish a steady state. For clinical applications, the appropriate treatment (heating) time should be determined based on the equivalent EM43 for the entire tumor region. Usually an EM43 is longer than 90 minutes to achieve complete tumor necrosis.
Figure 8. The transient temperature elevation at three locations in the first tumor geometry using the optimized heating pattern.
To test whether the developed algorithm is equally capable of handling 3-D tumor with complicated geometry, we tested the algorithm on the second tumor. gives the selected coordinators of the four injection sites, as well as the initial and optimized values of r0 and A. The convergence of the program took about 150 iterations () and the computation time was approximately 24 h due to the complex tumor geometry and four injection sites. The effectiveness of the algorithm is illustrated by , where the initial and final T90,tumor and T10,tissue are given. The success of the algorithm is evident by the converged values of A and r0 at each injection site as well as the resultant T90,tumor (43.21°C) and T10,tissue (41.76°C).
Figure 9. The convergence curves of A (symbols), r0 (lines) and the objection function f (heavy black line) obtained by the Nelder-Mead Simplex method for the second tumor geometry. A and r0 were normalized by their initial guess.
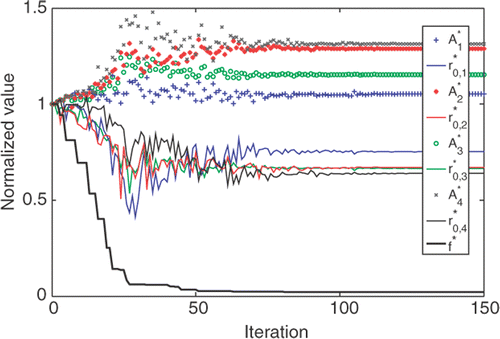
Table V. Summary of the injection site locations and the initial and optimized values of dTn, A and r0 for the second tumor geometry.
Table VI. Summary of the optimized values of the percentages R1 and R2, the normalized square error and the thermal damage indicators T90 and T10 in the tumor and normal tissue for the second tumor geometry.
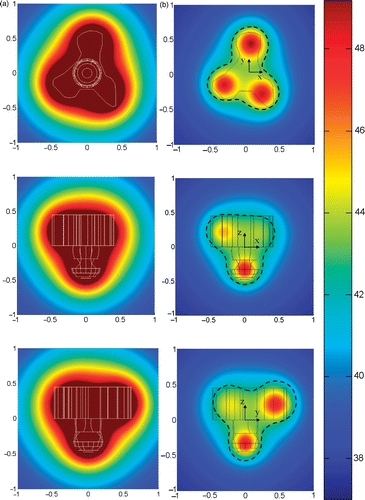
gives the initial and optimized temperature fields of the second tumor geometry. Overheating in the healthy tissue is evident in the initial temperature contours. After the optimization, only a small region (<3%) of the healthy tissue is found above 43°C while more than 90.2% of the tumor region has been elevated to bigger than 43°C. Deviation between the 43°C isotherm and the tumor boundary can also been seen in .
Figure 10. The optimum temperature distributions in the second tumor geometry on three cross-sectional planes passing through the injection sites: (a) before optimization; (b) after optimization (the dashed black line represents the 43°C isotherm). Note that the third coordinate is perpendicular to the 2-D plane. The coordinates are normalized by 20 mm which is the longitudinal length of the tumor.
Discussion and conclusion
In this paper we develop an algorithm to optimize the heat absorption distribution for multi-site injections in magnetic nanoparticle hyperthermia when a single injection is not sufficient to cover the entire irregular-shaped tumor. The output of this study is an optimized SAR distribution in terms of A and r0. The effectiveness of the optimization algorithm is evaluated by T90,tumor and T10,tissue. The concept of T90, T50 and T10 has been widely used and reviewed in hyperthermia treatment in both tumor and tissue Citation25–30. Theoretically, one would expect that T90 < T50 < T10 in any tumor or normal tissue region during hyperthermia. For instance, if these three temperatures are comparable to each other, the temperature distribution is almost uniform. However, this is not the case in many hyperthermia treatment situations where it is almost impossible to obtain a uniform high temperature in the tumor and a sudden temperature decrease to the normal tissue. Therefore, we chose to implement T90 and T10 to the tumor and tissue, respectively. Since we have to achieve thermal damage to the tumor, we should ensure a T90 bigger than 43°C. The opposite should take place in the healthy tissue meaning that T10 should be less than 43°C. In this paper, we present two case studies to apply the algorithm we developed.
The focus of this paper is to demonstrate the feasibility of the optimization algorithm. We are confident that the algorithm will work if another treatment parameter such as T5, tissue or T1,tissue is chosen. The choice of T10, T5 or T1 in the healthy tissue region is totally dependent on the choice of clinicians, since it depends on the tumor location, shape and size. The clinicians need to specify a margin of the healthy tissue that has to be protected during the treatment. In future theoretical and clinical studies, one could investigate the effect of the size of the healthy tissue domain surrounding the tumor on the outcome of the optimization algorithm, i.e the value of T10,tissue. If the defined tissue region is very small to result in an optimized T10,tissue higher than 43°C, it only suggests that more injection sites may be needed and/or the injection locations are re-adjusted. In this paper, we present two case studies to demonstrate that the algorithm we developed works in typical clinical situations. The theoretical model has the potential of simulating and optimizing realistic situations of magnetic nanoparticle hyperthermia. Unlike previous theoretical studies Citation17 where the SAR expression was not based on experimental measurements, our model is more realistic because the SAR expressions were obtained from experimental results in tissue-equivalent agarose gel and animal tissue. Furthermore, our approach is more general since it does not rely on weighting and relative importance factors in the choice of the objective function. To our knowledge, the current study is the first attempt to simulate and generally optimize the three-dimensional heating pattern to determine optimal injection parameters in clinical applications of magnetic nanoparticle hyperthermia.
On the other hand, the proposed optimization model has limitations. Uncertainties concerning the tumor location and injection sites are inevitable in clinical applications. The accuracy of the injection sites and sizes of the spheres depends on the accuracy of the modern imaging techniques such as MRI or CT. During clinical study, the optimization algorithm can be applied to a tumor with similar shape, however, it may be slightly bigger or smaller within the measurement margin of the imaging technique. We can provide the clinicians with multiple treatment protocols reflecting the inaccuracy of the size and/or shape of the tumor. However, if the resulting temperature outcomes are significant, the clinicians may utilize another imaging technique which has a better measurement accuracy.
In this study, the locations of the injection sites are pre-selected. The injection sites and the initial sphere diameters d43 are determined in a way so that the thermally affected region maximally matches the actual geometry of the tumor. The diameter of the sphere is selected so that 95% of the injected nanoparticles are located within the sphere. If the optimization result does not satisfy the treatment goal (T90, tumor > 43°C and T10, tissue < 43°C), it suggests that more injection sites are needed than the original sites. As shown in the results, the pre-selection of the locations may or may not lead to an ideal temperature distribution or to a design which satisfies overheating the tumor while protecting the normal tissue, even if the computational algorithm converges to the optimal result. If the result fails to satisfy the design goals, one needs to examine the obtained temperature contours in both the tumor and tissue regions and adjust the injection locations and/or the number of the injection sites to better match the tumor geometry. Moreover, more accurate results can be obtained by considering the three coordinates of each injection site as optimization variables. This approach makes the algorithm computationally expensive since the three spatial coordinates of each injection site are added to the two SAR parameters A and r0. Therefore, the number of variables becomes 5M, where M is the number of injection sites whereas in the current study it is equal to 2M. The developed algorithm can be modified to also optimize the injection locations in the future when computational resources are available.
One notes that the optimization procedures may yield to more than one set of the SAR parameters. Since both A and r0 contribute equally to the heat deposition in the tumor, one has the flexibility to select different combinations of the parameters. However, there is a limit on how high a maximum SAR at the injection site can be achieved. It is well known that the maximum SAR is affected by the particle properties, available magnetic field strength and frequency, as well as the initial ferrofluid concentration, injection amount and injection rate Citation2,Citation3,Citation13,Citation14. In fact, in our ongoing research of nanoparticle hyperthermia, we will initially manipulate the injection volume and rate. The effects of other parameters dependent on the equipment and the available ferrofluids in the market will be investigated later. Future experimental studies performed on tumors of various types in animal and clinical studies are crucial to understanding the limit of SAR strength. Nevertheless, our results have shown that a small variation from the initial guess would converge to the same optimization results of the SAR distributions.
We envisage that the current study has great potential in the clinical study of nanoparticle hyperthermia. Before this can be used in clinical applications, extensive experimental studies are required to generate a database that relates the injection parameters, such as quantity of nanoparticles and injection rate, to the SAR distribution parameters A and r0. It is expected that the clinician will first scan the geometry of the tumor and tissue and measure the local blood perfusion rates of both regions using MRI or other non-invasive imaging techniques. The injection sites are determined based on the tumor geometry. Our optimization algorithm is then implemented to the tumor and its surrounding tissue to determine the optimal SAR parameters of all injection sites. Three-dimensional temperature contours can be plotted and reviewed to see whether there is any thermally sensitive region exposed to excessive heating. After that the clinician will consult the database and find the suitable and realistic injection amount and injection rate. When selecting the injection amount and injection rate, one has to keep in mind how long the patient can tolerate the injection time when the injection rate is slow. Another consideration is the response of local blood perfusion rate to heating during nanoparticle hyperthermia. It is well known that hyperemic response to heating can potentially lower the treatment efficacy due to the relatively cold blood supplied to the tumor region Citation31. However, the response depends on the tumor type and size, and the response may be different from tumor to healthy tissue Citation32. To provide the optimization algorithm with accurate blood perfusion rates, one has to rely on data of experimental studies on heat response during hyperthermia treatment. The advantage of the algorithm developed in the study is that it can be used to provide different scenarios of optimization plan for different blood perfusion rates. Once the injection strategy of each injection site is determined, the Pennes bioheat equation can be re-run to simulate the three-dimensional temperature field during treatment duration. Note that in most hyperthermia treatment, an equivalent time for 43°C (EM43) is usually used to evaluate whether the heating is sufficient to result in tumor cell necrosis Citation27. The simulation of the 3-D transient temperature fields in both tumor and surrounding tissue allows for estimating and mapping the EM43 distribution to further evaluate thermal damage to the targeted region.
In conclusion, our study has demonstrated the feasibility of optimizing heating pattern in tumor treatment using magnetic nanoparticle hyperthermia. The optimization algorithm designed in this study significantly improves the treatment outcome, especially when the tumor is deep seated and irregular in shape. Minor changes in the initial values of the SAR parameters do not affect significantly the optimum solution. It has been shown that the injection site location and number of injections play important roles in determining whether the optimization has achieved the targeted T90,tumor and T10,tissue. Future experimental studies are needed to relate the SAR parameters to the injection strategy for each injection site. We believe that the current study has the potential to provide guidance to clinicians in designing effective and safe treatment protocols for cancer patients.
Acknowledgements
This research was supported in parts by NSF grants CBET-0730732 and CBET-0828728. The research was performed in partial fulfillment of the requirements for the PhD degree from the University of Maryland Baltimore County by Maher Salloum.
Declaration of interest: The authors report no conflicts of interest. The authors alone are responsible for the content and writing of the paper.
References
- Gilchrist RK, Medal R, Shorey WD, Hanselman RC, Parrott JC, Taylor CB. Selective inductive heating of lymph nodes. Ann Surg 1957; 146: 596–606
- Hergt R, Andra W. Physical limits of hyperthermia using magnetite fine particles. IEEE T Magn 1998; 34(5)3745–3754
- Rosensweig RE. Heating magnetic fluid with alternating magnetic field. J Magn Magn Mater 2002; 252: 370–374
- Hilger I, Hergt R, Kaiser WA. Towards breast cancer treatment by magnetic heating. J Magn Magn Mater 2005; 293: 314–319
- Moroz P, Jones SK, Gray BN. Magnetically mediated hyperthermia: Current status and future directions. Int J Hyperthermia 2002; 18(4)267–284
- Matsuki H, Yanada T. Temperature sensitive amorphous magnetic flakes for intra-tissue hyperthermia. Mater Sci Eng 1994; 181/A182: 1366–1368
- Hilger I, Andra W, Hergt R, Hiergeist R, Schubert H, Kaiser WA. Electromagnetic heating of breast tumors in interventional radiology: In vitro and in vivo studies in human cadavers and mice. Radiology 2001; 218(2)570–575
- Johannsen M, Jordan A, Scholz R, Koch M, Lein M, Deger S, Roigas J, Jung K, Loening S. Evaluation of magnetic fluid hyperthermia in a standard rat model of prostate cancer. J Endourol 2004; 18(5)495–500
- Johannsen M, Thiesen B, Jordan A, Taymoorian K, Gneveckow U, Waldofner N, Scholz R, Koch M, Lein M, Jung K. Magnetic fluid hyperthermia (MFH) reduces prostate cancer growth in the orthotopic Dunning R3327 rat model. Prostate 2005; 64: 283–292
- Jordan A, Scholz R, Maier-Hauff K, Van Landeghem FK, Waldoefner N, Teichgraeber U, Pinkernelle J, Bruhn H, Neumann F, Thiesen B, et al. The effect of thermotherapy using magnetic nanoparticles on rat malignant glioma. J Neuro-Oncol 2006; 78: 7–14
- Hergt R, Hiergeist R, Zeisberger M, Glockl G, Weitschies W, Ramirez LP, Hilger I, Kaiser WA. Enhancement of AC-losses of magnetic nanoparticles for heating applications. J Magn Magn Mater 2004; 280: 358–368
- Fortin JP, Gazeau F, Wilhelm C. Intracellular heating of living cells through Néel relaxation of magnetic nanoparticles. Eur Biophys J 2008; 37(2)223–228
- Salloum M, Ma RH, Weeks D, Zhu L. Controlling nanoparticle delivery in hyperthermia for cancer treatment: Experimental study in agarose gel. Int J Hyperthermia 2008; 24(4)337–345
- Salloum M, Ma RH, Zhu L. An in-vivo experimental study of temperature elevations in animal tissue during magnetic nanoparticle hyperthermia. Int J Hyperthermia 2008; 24(7)589–601
- Kumaradas JC, Sherar MD. Optimization of a beam shaping bolus for superficial microwave hyperthermia waveguide applicators using a finite element method. Phys Med Biol 2003; 48(1)1–18
- Siauve N, Nicolas L, Vollaire C, Marchal C. Optimization of the sources in local hyperthermia using a combined finite element-genetic algorithm method. Int J Hyperthermia. Phys Med Biol 2004; 20(8)815–833
- Bagaria HG, Johnson DT. Transient solution to the bioheat equation and optimization for magnetic fluid hyperthermia treatment. Int J Hyperthermia 2005; 21(1)57–75
- Pennes HH. Analysis of tissue and arterial blood temperature in the resting human forearm. J Appl Physiol 1948; 1: 93–122
- Antonio A, Lu WS. Practical Optimization: Algorithms and Engineering Applications. Springer, New York 2007
- Biegler LT, Ghattas O, Heinkenschloss M, Keyes K, Waanders BB. Real-Time PDE Constrained Optimization. SIAM Computational Science and Engineering, Philadelphia 2007
- Lagarias JC, Reeds JA, Wright MH, Wright PE. Convergence properties of the Nelder-Mead simplex method in low dimensions. SIAM J Optim 1998; 9(1)112–147
- Johannsen M, Gneveckow U, Thiesen B, Taymoorian K, Cho CH, Waldöfner N, Scholz R, Jordan A, Loening SA, Wust P. Thermotherapy of prostate cancer using magnetic nanoparticles: Feasibility, imaging, and three-dimensional temperature distribution. Eur Urol 2007; 52(6)1653–1661
- El-Kareh AW, Secomb TW. Theoretical models for drug delivery to solid tumors. Crit Rev Biomed Eng 1997; 25(6)503–571
- He Q, Zhu L, Weinbaum S. Effect of blood flow on thermal equilibration and venous rewarming. Ann Biomed Eng 2003; 31: 659–666
- Dewhirst MW, Sim DA. The utility of thermal dose as a predictor of tumor and normal tissue responses to combined radiation and hyperthermia. Canc Res 1984; 44: 4772s–4780s
- Dewhirst MW, Winget JM, Edelstein-Keshet L, Sylvester J, Engler M, Thrall DE, Page RL, Oleson JR. Clinical application of thermal isoeffect dose. Int J Hyperthermia 1987; 3(4)307–318
- Dewhirst MW, Vuhaskovic Z, Jones E, Thrall D. Re-setting the biologic rationale for thermal therapy. Int J Hyperthermia 2005; 21(8)779–790
- Leopold KA, Dewhirst MW, Samulski TV, Harrelson J, Tucker JA, George SL, Dodge RK, Grant W, Clegg S, Proznitz LR, et al. Relationships among tumor temperature, treatment time, and histopathological outcome using preoperative hyperthermia with radiation in soft tissue sarcomas. Int J Rad Oncol Biol Phys 1992; 22: 989–998
- Thrall DE, Rosner GL, Azuma C, LaRue SM, Case BC, Samulski T, Dewhirst MW. Using units of CEM 43°C T90, local hyperthermia thermal dose can be delivered as prescribed. Int J Hyperthermia 2000; 16(5)415–428
- Thrall DE, LaRue SM, Yu D, Samulski T, Sanders L, Case B, Rosner G, Azuma C, Poulson J, Pruitt AF, et al. Thermal dose is related to duration of local control in canine sarcomas treated with thermoradiotherapy. Clin Cancer Res 2005; 11(14)5206–5214
- Zhu L. Bioheat transfer. Standard Handbook of Biomedical Engineering and Design, M Kutz. McGraw-Hill, New York 2003; 2.3–2.29
- Song CW. Effect of local hyperthermia on blood flow and microenvironment: A review. Cancer Res 1984; 44: 4721s–4730s
- Ozisik MN. Heat Conduction. Wiley-Interscience, New York 1993
- Ozisik MN. Boundary Value Problems of Heat Conduction. International Textbooks in Mechanical Engineering. International Textbooks Company, Scranton, PA 1968
- Carslaw HS, Jaeger JS. Conduction of Heat in Solids. Oxford. Oxford University Press, New York 1986
Appendix
We estimate dTn by solving the Pennes bioheat equation in spherical coordinates in an infinite domain.
Dimensionless parameters are introduced as
The dimensionless equation and boundary conditions become:
We apply the following variable transformation, u = T*·r* Citation33–35 and the equation changes to:where
Applying the sine Fourier transforms to the above equation (Equation IVa) and solving for the sine Fourier transform of u yield:where β is the sine Fourier transform variable. Finally, applying the inverse sine transform results in:
The 1-D temperature distribution can then be written as
In this study, the thermally affected region is defined as a spherical region where the temperature is higher than Tn. The diameter of the sphere dTn can be determined by solving the following equation.
