
Abstract
Purpose: Phase-sensitive optical coherence tomography (PhS-OCT) is proposed, as a new high intensity focused ultrasound (HIFU) imaging guidance to detect and track HIFU focus inside 1% agar samples in this work. The experiments studied the effect of varying HIFU power on the induction of shear wave, which can be implemented as a new technique to monitor focused ultrasound surgery (FUS).
Method: A miniature HIFU transducer (1.02 MHz, 20 mm aperture diameter, 15 mm radius of curvature) was produced in-house, pressure-field mapped, and calibrated. The transducer was then embedded inside a 1% agar phantom, which was placed under PhS-OCT for observation, under various HIFU power settings (acoustic power, and number of cycles per pulse). Shear wave was induced on the sample surface by HIFU and was captured in full under PhS-OCT. The lowest HIFU acoustic power output for the detection of shear wave was found to be 0.36 W (1.02 MHz, 100 cycles/pulse), or with the number of cycles/pulse as low as 20 (1.02 MHz, 0.98 W acoustic power output).
Results: A linear relationship between acoustic power output and the maximum shear wave displacement was found in the first study. The second study explores a non-linear correlation between the (HIFU) numbers of cycles per pulse, and the maximum shear wave displacement.
Conclusion: PhS-OCT demonstrates excellent tracking and detection of HIFU-induced shear wave. The results could benefit other imaging techniques in tracking and guiding HIFU focus. Further studies will explore the relationship between the physical transducer characteristics and the HIFU-induced shear wave.
Introduction
High intensity focused ultrasound (HIFU) is a general term for the application of high-power ultrasonic wave within a well-defined focus. One clinical application of HIFU is known as focused ultrasound surgery (FUS), where HIFU is mainly used as a hyperthermia therapy.
As HIFU delivers high-energy and prolonged ultrasonic pulse into biological tissue within a well-defined focus, the temperature at said focus elevates quickly above hyperthermia threshold in a few seconds [Citation1]. Relying on the hyperthermia effect of HIFU, magnetic resonance imaging (MRI) and ultrasound (US) imaging have been adapted in the past for planning and guiding FUS. Imaging guidance in FUS is extremely important as any form of unwanted and/or extensive tissue damage can be minimised.
Each imaging guidance modality has a different approach in imaging, tracking and guiding FUS. In particular, MRI imaging measures the proton resonance frequency shift, and produces a real-time temperature map of tissue (within a region of interest). This imaging technique was introduced in the late 1980s [Citation2], and is now known as MR thermometry. It took MR thermometry another decade for this imaging technique to be first introduced for monitoring HIFU and subsequently in FUS [Citation3,Citation4]. MR thermometry has been developed and improved ever since to enhance its capabilities in real-time thermometry, e.g. reducing susceptibility in patient breathing motion and inhomogeneity within the tissues. Despite much great progress, MR thermometry is still relatively expensive to maintain and operate. The imaging technique also requires a certain level of temperature elevation (above the hyperthermia threshold) in the targeted tissue in order to track the HIFU focus.
Ultrasound imaging (sonography), on the other hand, is relatively inexpensive and has been employed in almost every clinical setting. The main ultrasound imaging techniques for guiding FUS include B-mode sonography [Citation5], and elastography [Citation6]. There are limitations in each ultrasound imaging technique, namely 1) lack of contrast between the echoic signals of the surrounding tissue and the HIFU lesions in B-mode imaging, and 2) limited real-time monitoring in elastography as the ablated region only becomes visible after damage to tissue has occurred. In normal B-mode imaging the formation of bubble (or cavitation) clouds often indicates the activity at HIFU focus. However, this technique requires HIFU to operate at high power settings and is likely to cause mechanical damage to tissues. On the other hand, sono-elastography differentiates the elasticity difference between the HIFU-induced lesion and the surrounding tissue. However, the elasticity changes in tissue only occur when tissue undergoes a drastic and irreversible denaturation process (caused by hyperthermia).
Phase-sensitive optical coherence tomography (PhS-OCT) is introduced in this work as a new imaging technique to monitor and calibrate HIFU procedures in real time at sub-therapeutic HIFU power level. The approach of this new HIFU imaging guidance is fundamentally different from the rest, where it captures HIFU-induced shear wave, and uses the acquired information to locate the HIFU focusing. This imaging technique also benefits from very high resolution and sensitivity over small deformation [Citation7]. In particular, PhS-OCT is capable of capturing shear wave with an imaging rate of up to 46.8 kHz and axial resolution of less than 1 nm in our system. Therefore, PhS-OCT was adapted in this work for tracking HIFU in real time, and calibrating the HIFU power appropriately for tracking and monitoring purposes. The technique could be an improvement in FUS treatment of superficial tissue at high resolution, e.g. HIFU in dermatology and ophthalmology [Citation8,Citation9]. Shear wave induced by HIFU is studied at different HIFU power settings and different pulse length. The result of this study will demonstrate and provide a new method for tracking and monitoring HIFU procedures, especially complementing the newly adopted shear wave ultrasound imaging [Citation10].
Materials and methods
High intensity focused ultrasound transducer
A HIFU transducer was fabricated in-house from PZ-54 material focusing bowl (Meggitt Sensing Systems, Kvistgaard, Denmark). The focusing bowl has a resonant frequency at 1.02 MHz, 20 mm aperture diameter, and 15 mm radius of curvature. The backing material is a composite epoxy (EpoFix and glass microsphere, weight ratio 60:40 respectively). The quarter-wave impedance matching layer is made of silver-epoxy.
The acoustic power output of the HIFU transducer (1.02 MHz, 20 mm aperture diameter, 15 mm radius of curvature) was calibrated using a radiation force balance (Precision Acoustics, Dorchester, UK). The pressure field around the HIFU focus is mapped using a0.5-mm needle hydrophone (Precision Acoustic) mounted on a 3D-linear stepping motor (Velmex, Bloomfield, NY, USA). The scanning resolution was set to 0.02 mm.
Pressure field mapping
The needle hydrophone records acoustic pressure at each location around the HIFU focus, forming a 2D pressure field map. This set-up requires the HIFU transducer to be immersed entirely in water. The relative intensity acoustic map was tabulated from a 2D pressure field map (15 mm range in the axial direction, 8 mm range in the radial direction, 0.02 mm resolution in both directions), by
where i and j are pixel coordinates of the column and row, and pmax is the maximum pressure found in the 2D pressure map.
The logarithm of the intensity mapping is converted from the pressure field mapping using the equation:
where LI (i, j) is the relative intensity in logarithmic scale at (i,j) coordinates. ) shows the logarithm of the intensity mapping in the axial and traverse planes from the HIFU transducer.
Figure 1. Logarithm of acoustic intensity map in (a) traverse plane and (b) axial plane at maximum intensity along the beam axis.
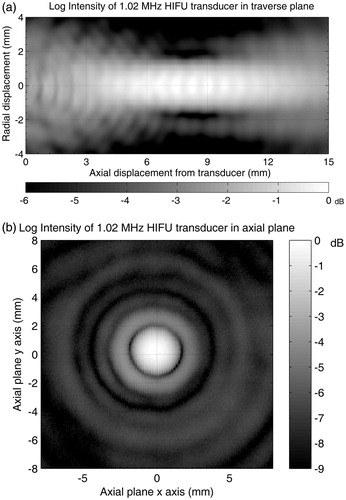
The logarithmic HIFU intensity maps help in approximating the PhS-OCT scanning range for optimising spatial and temporal imaging resolution. Since the full width at half-maximum (FWHM) intensity is less than 2.0 mm in the radial dirrection, the PhS-OCT scanning range was set at 2.5 mm.
The fringe pattern at the HIFU focus in the traverse plane is due to (forced) focus within the near-field region (frequency 1.02 MHz, 20 mm aperture diameter, 15 mm radius of curvature). This oscillating near field is not to be confused with the standing ultrasonic wave. More details regarding the near-field (Fresnel) zone construction from a focused sound field can be found in the Ultrasonic Testing of Materials text book [Citation11].
Acoustic power output
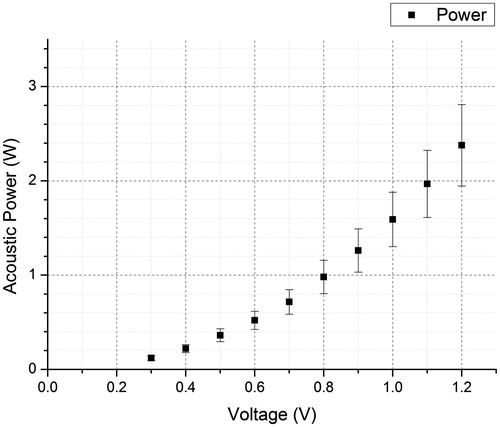
HIFU acoustic power output is an important parameter for quantifying the intensity of an acoustic pulse. The acoustic power output needs to be predictable with a reference input power (or any other similar parameter) that can be read easily. Since pre-amplified voltage from the signal generator provides a simple reference to the acoustic power output, the HIFU transducer was calibrated against the pre-amplified voltage readings. This direct reference is convenient for performing experiments since the radiofrequency (RF) power output (from the RF power amplifier) versus the acoustic power output (from the HIFU transducer) is non-linear due to imperfections in the power amplification and power transfer/impedance matching circuit at high frequency. Harmonic frequency is usually present in the amplified voltage waveform.
A typical result between the output signal from the signal generator (V) and the HIFU acoustic power output (W) is shown in . This acoustic power output will be the prime parameter for quantifying the power of a HIFU pulse in this paper.
Figure 2. Signal generator input signal versus HIFU acoustic power output.
Phase-sensitive optical coherence tomography (PhS-OCT)
PhS-OCT was developed by the Bioinstrumentation and Optics Group at the University of Dundee, based on phase detection between each consecutive frame [Citation7]. PhS-OCT uses a broadband laser source and is a spectral-domain optical coherence tomography set-up. The scanning mirror is a mirror galvanometer that is integrated into the PhS-OCT system for 2D scanning protocols.
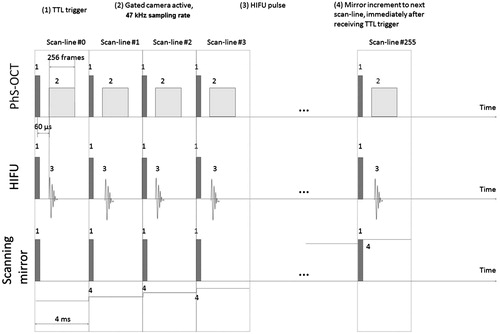
The PhS-OCT (camera exposure 17.4 μs, sensitivity 450 e-/count) performs a 46.8-kHz sampling rate (approximately 21.4 μs per frame), acquiring 256 frames over approximately 5.47 ms (256 A-scans forming 1 M-scan), in each scan line (forming 1 M-scan). The scan line repeats (horizontally) across the imaging plane forming 256 M-scans. This results in a complete M-B-scan. The data format is 1024 pixel-depth ×256 frames ×256 scan lines. The complete data acquisition takes approximately 2 s. Each B-scan (frame) was processed with respect to the previous one to determine the phase shift, and thus the displacement due to the HIFU-induced shear wave.
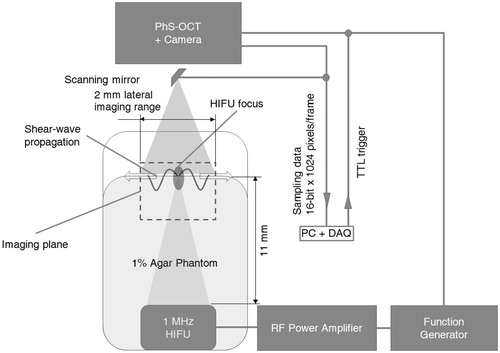
illustrates our scanning protocol in our experimental set-up. The HIFU pulse is a constant amplitude for any given pulse length. The durations between pulses are only relative and not drawn to scale in , unless expressly stated.
Figure 3. Scanning protocols for the PhS-OCT and HIFU transducer for 2D capture of HIFU-induced shear wave (TTL trigger is sent by the PC + DAQ card to both PhS-OCT and HIFU every 4 ms).
We have also developed real-time scanning software that utilises the PhS-OCT to detect shear wave propagation on demand. The real-time PhS-OCT technique will be described in more detail in a separate paper since it has a different approach and produces data at much lower spatial resolution. In summary, the software detects phase changes in signals between each consecutive scan line, and not between each frame (assuming that the lateral resolution is small enough). This technique would minimise the total time required to accurately locate the shear wave source, at the expense of reduced image quality, however. A final confirmation step is required to determine the exact location of the HIFU focus within the agar sample, and is described more in the results section.
Sample preparation and experimental set-up
The sample used in this experimental set-up is a 1% agar phantom. The agar powder (Fisher Scientific, Loughborough, UK) was first mixed in hot water (approximately 90 °C) at 1:99 (agar: water) weight-to-weight ratio. The mixture was then left to dissolve completely on a hot plate at 100 °C temperature setting. The solution was then poured into a mould which has the HIFU transducer fixed in place at the bottom of the mould.
The experimental set-up is summarised as in . A personal computer (Intel I7 4820K CPU, 16 GB DDR3 RAM) collects and processes acquired data. NI PCIe-6713 DAQ card (National Instruments, Newbury, UK) sends TTL trigger output and synchronises both the OCT and HIFU apparatus. The DAQ card then waits and collects data from the high-speed line-scan camera (SUI-LDH2, Sensors Unlimited, Princeton, NJ), upon receiving an internal trigger from the camera.
Figure 4. Schematic of experimental set-up for the PhS-OCT and HIFU transducer in order to capture the HIFU-induced shear wave. Note that the distance between the aperture plane and the focus of the HIFU transducer is approximately 11 mm, and can be calculated from the aperture size and radius of curvature of a spherically curved HIFU.
The agar sample is cylindrical in shape, with dimensions of 30 mm (diameter) by 12 ± 1 mm (height). The dimension of the scanning imaging plane is 2.0 mm (width) by 2.5 mm (depth).
There are 16 sets of experiments; each was repeated three times, dividing into two qualitative studies. The first study was to investigate the effect of increasing/reducing input voltage to the HIFU transducer, and the second study was to investigate the effect of increasing/reducing the number of cycles per pulse applied to the HIFU transducer at a fixed acoustic power output. The fixed acoustic power output was chosen so that when the minimum number of cycles in one HIFU pulse was selected, PhS-OCT could still give a good signal-to-noise ratio (0.98 W acoustic output in this case).
Locating shear wave source and data processing
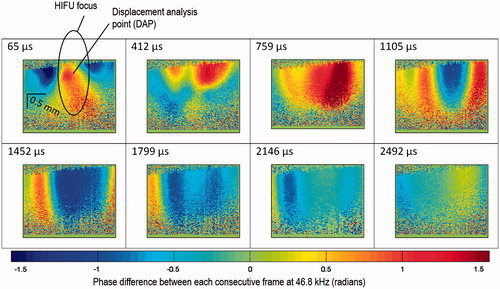
Once real-time tracking software locates the shear wave source, several sets of data were captured at slightly different imaging planes (approximately ±0.2 mm displacement in direction perpendicular to the imaging plane). This step finds and confirms the location of the HIFU focus. The imaging plane that captured the shear wave source (HIFU focus) would yield the strongest shear wave displacement. The HIFU transducer (1.02 MHz) was set to output 100 cycles per pulse at 2.37 W acoustic power output for this confirmation step. The first capture was at 21.7 μs after the first HIFU pulse. The first observable displacement induced by the HIFU pulse was at 65 μs after the first TTL trigger. This 65-μs delay was consistent across different experiments, regardless of whether we changed the total acoustic power output (keeping cycles per pulse constant), or the number of cycles per pulse (keeping acoustic power output constant). The constant delay suggests that the HIFU-induced shear wave is not dependent on the pulse length. By keeping total acoustic power constant and changing number of cycles per pulse, the second part of this study will explore more about this constant delay.
The data acquired from PhS-OCT were the phase differences φ between successive frames of A-scans, which are vertical lines (256 vertical lines in each frame). There are 256 frames in total, resulting in 255 frames of 2D (256 × A-scans) phase difference. The datasets of 2D phase difference are visualised with limits between −π/2 and + π/2, and can be easily converted to vertical displacement Δ z by:
where i, j are the horizontal and vertical coordinates of a given pixel in the M-scan, t is the time difference between each A-scan, λ = 1310 nm is the superluminescent diode (OCT light source) central wavelength, and n is the sample refractive index (assumed to be 1.4 for this experiment).
Results and discussions
Effect of HIFU acoustic power on shear wave generation
The study began with locating the shear wave source as discussed in Materials and methods above. An example of the final confirmation step, which shows the time evolution of shear wave at the HIFU focus, is shown in . Once the position giving strongest shear wave displacement is located, the sample was fixed for further experiments. We chose the 64th frame for qualitative analysis of this study (HIFU power versus shear wave displacement), which is at 1452 μs (64 frames×21.67 μs) after the HIFU trigger signal. At this proposed frame, HIFU-induced shear wave is fully established. The waveform only propagates inside the sample without changing the general pattern (alternating maxima and minima), after this 64th frame. There is a slow bulk recovery, which is not considered as part of the shear wave.
Figure 5. 2D map of phase differences between each consecutive frame at 46.8 kHz with respect to the time after the first TTL trigger, at the shear wave source (HIFU focus, 1.02 MHz, 100 cycles/pulse at 2.37 W acoustic powers). The equivalent limit on the scale bar is −117 to +117 nm displacement difference between each consecutive frame at 46.8 kHz.
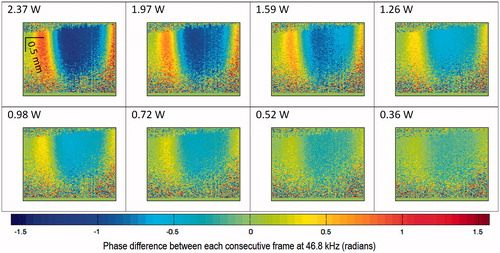
Eight different sets of PhS-OCT capture in different acoustic power and constant number of cycles per pulse (100 cycles per pulse at 1.02 MHz) are displayed on the same scale of phase difference () for visual comparison.
Figure 6. (a) 2D map of phase difference (radians) with respect to different acoustic power output (W) at 1452 μs after the first TTL trigger. (b)Shear wave displacement versus time at the displacement analysis point (DAP). (c) Linear relationship between HIFU acoustic power output and shear wave displacement at DAP. The equivalent limit on the scale bar is −117 to +117 nm displacement difference between each consecutive frame at 46.8 kHz.
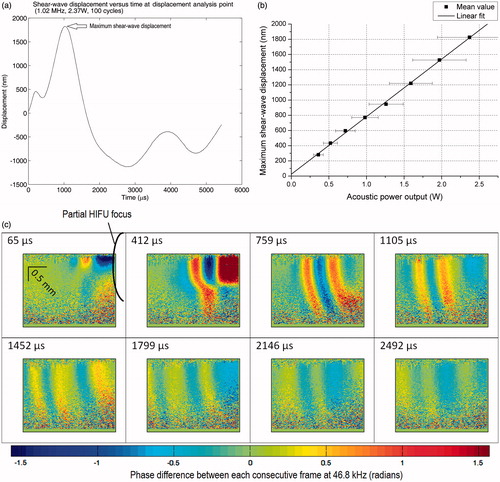
The difference in shear wave displacement versus different acoustic power settings can be quantified using the displacement analysis point (see ). An example of the shear wave displacement at the displacement analysis point (2.37 W, 1.02 MHz, 100 cycles/pulse) with respect to time is shown in . There is an unexpected negative bulk displacement after the first strong positive (+ve) push as indicated in . Further study into this bulk displacement could help understand more about the interaction of HIFU on this agar sample, and possibly on animal tissues.
Another interesting result from comparing the maximum (+ve) shear wave displacement (see ) versus the acoustic power output can be seen in . The maximum displacement for each acoustic power output was obtained from the displacement analysis point (DAP). A simple linear fitting model is proposed for the relationship between maximum shear wave displacement and HIFU acoustic power output (1.02 MHz, 100 cycles/pulse):
where max(Δ z(DAP)) is the maximum shear wave displacement at DAP, Pac is the HIFU acoustic power output, a and b are linear fitting parameters (a = 758 ± 11 nm.W- 1, b = 25 ± 15 nm). This model shows a very good linear relationship between the shear wave displacement and the HIFU acoustic power output (Pearson’s r = 0.9994). The maximum shear wave displacement is approximately zero when the acoustic power output is at zero as predicted. Note that the error from the HIFU acoustic power output measurement far exceeds the error from the shear wave displacement measurement.
This linear relationship provides a simple correlation between shear-wave displacement field with respect to the HIFU acoustic power output. Other imaging modalities with a fixed sensitivity to displacement detection would greatly benefit from this finding. Changing acoustic power output, above which HIFU-induced shear wave is detectable for a given imaging system (with fixed spatial resolution), is one example.
Effect on shear wave generation of the number of cycles per HIFU pulse
Although reducing the number of cycles per HIFU pulse is equivalent to reducing the total power deposited into the sample, the former is not exactly the same as the latter regarding the HIFU-induced shear wave. The objective of this study is to find whether there is a simple relationship between increasing/reducing the number of cycles per pulse with a fixed HIFU acoustic power output, and the HIFU-induced shear wave displacement.
Similar to the first study, a confirmation step was performed to determine the best time and location for the qualitative analysis. The evolution of the HIFU-induced shear wave over time was captured with the focus located at 1) the same position as in previous study, as well as 2) at the edge of the frame in the second experiment. The reason for the second imaging location is that: 1) the shear wave propagation can be approximated as symmetric in a homogenous sample (which can be seen in the previous study, ), 2) there are more observations from HIFU-induced shear wave that occurred relatively far away from the focus, and 3) minimising the range of imaging reduces data acquisition and processing time.
The observation from the second imaging location shows that more fringes were produced almost at the same instant () after the first trigger. This phenomenon suggests a more complex interaction between the HIFU pulse and the agar sample. We attribute this observation to the side lobes of the HIFU pressure field. However, more work is required to confirm that the spacing of the side lobes is similar to the spacing of the shear wave from the very first set of results.
Figure 7. 2D map of phase differences between each consecutive frame (46.8 kHz) at different times, with respect to the TTL trigger time; HIFU operates at 2.37 W acoustic power output, 100 cycles/pulse. The equivalent limit on the scale bar is −117 to +117 nm displacement difference between each consecutive frame at 46.8 kHz.
Qualitative analysis of the PhS-OCT data in this position also delivers better propagation characteristics of the HIFU-induced shear wave, e.g. shear wave speed and shear wave dispersion.
As described in the first study for quantitative analysis, an example of the shear wave displacement (HIFU 1.02 MHz, 2.37 W, 100 cycles/pulse) versus time at DAP (see for DAP) is shown in . The imaging location and the position of HIFU focus remain the same as in the previous study. This imaging location should not be confused with the imaging location which is shown in and a (discussed in the previous paragraph above).
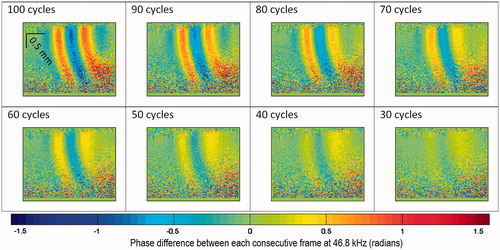
Figure 8. (a) HIFU-induced shear wave with reducing number of cycles per pulse at 759 μs after HIFU is triggered (2.37 W acoustic power, 100 cycles/pulse). (b) Shear wave displacement versus time at displacement analysis point (DAP) with HIFU operating at 0.98 W acoustic power, 100 cycles/pulse. (c) Plot of the number of cycles per pulse versus shear wave displacement at DAP (constant 0.98 W acoustic power). The equivalent limit on the scale bar is −117to +117 nm displacement difference between each consecutive frame at 46.8 kHz.
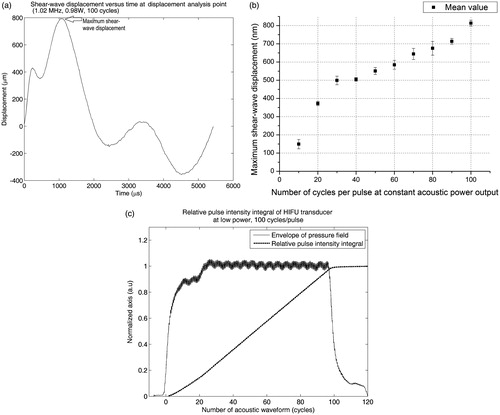
In this study the errors in measurement are mainly from 1) the imaging technique, and 2) the assumed constant acoustic power output of the HIFU transducer, with respect to the number of cycles per pulse. We do not consider the error in acoustic power measurement any more, since the acoustic power is set at a constant level (2.37 W). We addressed the error from our imaging technique by calculating the shear wave displacement from repeated data acquisition (3 samples per set), in each dataset of different cycles per pulse versus shear wave displacement. The acoustic power output of the HIFU transducer was tested with a needle hydrophone (Precision Acoustics) at low power inside a water tank. shows the HIFU transducer response at different continuous cycles. The relative pulse intensity integral was then calculated from the pulse intensity integral. Since the relative pulse integral intensity versus cycles per pulse is linear we can assume that the acoustic power output of the HIFU transducer is constant with respect to the number of cycles per pulse.
Figure 9. HIFU response (pressure field) measured by needle hydrophone at 1.02 MHz and 100 cycles/pulse, and the pulse intensity integral.
shows the relationship between the shear wave displacements versus number of cycles per pulse. The displacement is adequately linear to varying number of HIFU cycles per pulse (in a range between 40 to 100 cycles/pulse). At less than 30 cycles/pulse, shear wave displacement quickly dropped to zero, at a faster rate. In contrast, the acoustic energy from the HIFU transducer dropped at a lower rate from 1–20 cycles/pulse (). This non-linear relationship at 30–40 cycles/pulse suggests an ideal number of cycles/pulse, in which the (minimum) acoustic energy deposited into tissue and the (maximum) shear wave displacement are optimised. This hypothesis, however, requires a more robust analysis. For example, the stability of the HIFU transducer may differ at medium–high power, which could contribute to the non-linear relationship between shear wave displacement and HIFU cycles/pulse. Acoustic reflection and the standing wave at the phantom/air interface might play a role in this non-linear shear wave induction. The large acoustic impedance between phantom and air might enhance the ‘acoustic radiation force impulse’ phenomenon, and thus the induced shear wave displacement could be exaggerated. Regarding the acoustic standing wave, however, any acoustic waves (away from the focus) would quickly diverge and attenuate inside the (agar) phantom, since the HIFU transducer is a focusing bowl type.
Further work on PhS-OCT set-up for HIFU, and current limitations
PhS-OCT could quantitatively analyse the interaction of HIFU in the agar sample at the sub-therapeutic power level. Further work will explore the interaction of HIFU in biological tissues using PhS-OCT in order to confirm the usefulness of this system in clinical applications.
Apart from the HIFU acoustic power output and number of cycles per pulse, other acoustic parameters such as frequency and f-number could also be significant regarding HIFU-induced shear wave. The effects of said parameters on HIFU-induced shear wave within biological tissues have not been very well understood until now. Effect of different acoustic parameters on the induction of the shear wave can be quantitatively analysed. We have shown from our initial results the possibility of using acoustic power and the number of cycles per pulse to increase the shear wave displacement. Future work will explore the possibility of using repeated pulses for continuous shear wave generation. Many shear wave–elastography imaging techniques would benefit from these quantitative results. For example, for ultrasound-guided HIFU with a fixed imaging (axial) resolution, a HIFU transducer can be designed to induce shear wave with displacement well above the imaging resolution. Further investigations on this subject would greatly improve the design of the HIFU transducer for planning and tracking efforts.
Although superior in terms of spatial and temporal resolution, PhS-OCT suffers from limited penetration depth, typically operating within only a few millimetres of the sample’s surface. This limitation exacerbates the measurement where the acoustic impedance mismatch between air and sample is relatively large. Our initial observations reveal that the acoustic impedance mismatch might have enhanced HIFU-induced shear wave phenomenon. Therefore the sample may need a coupling material that is both optically transparent under PhS-OCT, and acoustically similar to the sample’s acoustic impedance.
The HIFU transducer in this experiment operates at maximum 2.37 W (spatial-average pulse-average intensity ISAPA = 97 W.cm- 2 at maximum acoustic power). Since the objective of this paper is to detect and track HIFU focus with minimum damage to the sample (reducing total acoustic power), the acoustic power output from HIFU is far less than the therapeutic HIFU transducer’s acoustic output, which is typically a few hundred W.cm−2 [Citation12].
Conclusions
PhS-OCT displayed exceptional capabilities in tracking, detecting and calibrating HIFU focus. The system can detect HIFU-induced shear wave with the HIFU acoustic power output set to as low as 0.36 W (or spatial-average pulse-average intensity ISAPA = 11 W.cm- 2, 100 cycles/pulse at 1.02 MHz). High spatial and temporal resolutions from PhS-OCT enable the calibration of HIFU acoustic power, correlating the displacement of HIFU-induced shear wave with different HIFU power settings, and/or different physical characteristics of HIFU.
Predictions of tissue behaviour under certain HIFU power settings are important for detection and tracking of HIFU. This shortens the planning steps in HIFU treatment by accurately locating and tracking the HIFU focus within the tissues. We would like to exploit the usefulness of this technique for skin cancer testing (elastography) and treatment (hyperthermia).
We also demonstrated that the shear wave displacement induced by acoustic radiation force(ARFI) can be studied in depth using PhS-OCT. By varying the pulse shape and carrier frequency the shear wave could be manipulated to suit different imaging modalities whilst operating at diagnostic level. For example, we have demonstrated that increasing acoustic power or number of cycles per pulse can improve signal to noise ratio regarding shear wave displacement. The knowledge on this subject could improve the quality of shear wave elastography imaging in tissue using ultrasound.
There are a few limitations in building up and operating PhS-OCT for HIFU guidance. The cost of the system is one, which is approximated to be between the cost of ultrasound and that of an MRI systems. The cost multiplies for building and maintaining such a system. However, the biggest disadvantage in PhS-OCT is the low penetration depth which therefore limits the number of PhS-OCT’s clinical applications.
Disclosure statement
The authors report no conflicts of interest. The authors alone are responsible for the content and writing of the paper.
References
- Ter Haar GR. High intensity focused ultrasound for the treatment of tumors. Echocardiography 2001;18:317–22.
- Bihan DL, Delannoy J, Levin RL. Temperature mapping with MR imaging of molecular diffusion: application to hyperthermia. Radiology 1989;171:853–7.
- Bohris C, Schreiber WG, Jenne Ju, Simiantonakis I, Rastert R, Zabel HJ, et al. Quantitative MR temperature monitoring of high-intensity focused ultrasound therapy. Magn Reson Imaging 1999;17:603–10.
- Tempany CMC, Stewart EA, McDannold N, Quade BJ, Jolesz FA, Hynynen K. MR imaging-guided focused ultrasound surgery of uterine leiomyomas: a feasibility study. Radiology 2003;226:897–905.
- Vaezy S, Shi X, Martin RW, Chi E, Nelson PI, Bailey MR, et al. Real-time visualization of high-intensity focused ultrasound treatment using ultrasound imaging. Ultrasound Med Biol 2001;27:33–42.
- Bercoff J, Pernot M, Tanter M, Fink M. Monitoring thermally-induced lesions with supersonic shear imaging. Ultrason Imaging 2004;26:71–84.
- Song S, Huang Z, Nguyen T-M, Wong EY, Arnal B, O’Donnell M, et al. Shear modulus imaging by direct visualization of propagating shear waves with phase-sensitive optical coherence tomography. J Biomed Optics 2013;18:121509.
- Aptel F, Lafon C. Therapeutic applications of ultrasound in ophthalmology. Int J Hyperthermia 2012;28:405–18.
- Xing Y, Lu X, Pua EC, Zhong P. The effect of high intensity focused ultrasound treatment on metastases in a murine melanoma model. Bioch Biophys Res Commun 2008;375:645–50.
- Bercoff J, Tanter M, Fink M. Supersonic shear imaging: a new technique for soft tissue elasticity mapping. IEEE Trans Ultrason Ferroelectr Freq Control, 2004;51:396–409.
- Krautkrämer J, Krautkrämer H. Ultrasonic Testing of Materials, 4th ed. Berlin: Springer, 1990.
- Ebbini ES, Ter Haar G. Ultrasound-guided therapeutic focused ultrasound: current status and future directions. Int J Hyperthermia 2015;31:77–89.