
Abstract
Purpose: To develop computer models to mimic the impedance-controlled pulsing protocol implemented in radiofrequency (RF) generators used for clinical practice of radiofrequency ablation (RFA), and to assess the appropriateness of the models by comparing the computer results with those obtained in previous experimental studies.
Methods: A 12-min RFA was modelled using a cooled electrode (17G, 3 cm tip) inserted in hepatic tissue. The short (transverse) diameter of the coagulation zone was assessed under in vivo (with blood perfusion (BP) and considering clamping) and ex vivo (at 21 °C) conditions. The computer results obtained by programming voltage pulses were compared with current pulses.
Results: The differences between voltage and current pulses were noticeable: using current instead of voltage allows larger coagulation zones to be created, due to the higher energy applied by current pulses. If voltage pulses are employed the model can accurately predict the number of roll-offs, although the waveform of the applied power is clearly not realistic. If current voltages are employed, the applied power waveform matches well with those reported experimentally, but there are significantly fewer roll-offs. Our computer results were overall into the ranges of experimental ones.
Conclusions: The proposed models reproduce reasonably well the electrical-thermal performance and coagulation zone size obtained during an impedance-controlled pulsing protocol.
Introduction
Radiofrequency ablation (RFA) is a minimally invasive technique widely employed to destroy tumours [Citation1] in which radiofrequency (RF) electrical currents (≈500 kHz) are delivered to the tissue by means of an electrode in order to selectively heat the tumour by raising its temperature over 50 °C. The aim of RFA is to produce a successful coagulation zone in terms of the tumour being completely surrounded by a zone in which tissue has been irreversibly destroyed by heat. During heating, the charring and dehydration of the tissue around the electrode produces an electrical impedance increase (a phenomenon known as roll-off), which significantly reduces energy diffusion and limits coagulation zone size. Changing the power delivery protocol and electrode design are the primary ways of overcoming this limitation and achieving larger coagulation zones. Probably the most clinically used approach in tumour RFA is using a needle-like cooled electrode combined with an impedance-controlled pulsing protocol [Citation2]. This protocol increases coagulation zone size, since periods of low current deposition alternate with higher peak current, which allows the tissue near the electrode to cool while the deeper tissue is heated [Citation3]. RF power is switched off once the impedance exceeds a threshold (usually 20 − 30 Ω higher than the initial value) and is switched on again after a few seconds. This protocol is followed up to the end of the pre-set ablation time.
Numerous modelling studies have been published on RFA with needle-like cooled electrodes [Citation4–11] although they rarely provide sufficient details of the pulsing protocol used. In some cases, the model simply reduces the applied voltage to the maximum level at which no tissue is heated beyond 100 °C [Citation4–6]. Others do not provide details of the RF power delivery protocol [Citation7], so we cannot be sure whether an impedance-controlled pulsing protocol was really modelled. In others, although the authors state that the impedance-controlled pulsing protocol was implemented [Citation8–11], the results do not contain details of the evolution of the electrical variables (voltage and impedance), which would show whether the protocol had been realistically modelled. In a recent modelling study, Zhang et al. [Citation12] implemented an impedance-controlled protocol based on voltage pulses, trying to mimic the actual algorithm used by RF generators employed in clinical practice. However, some issues still need to be included in the computer models. Firstly, it is known that commercial RF generators use an optimised protocol based on progressively reducing the power applied at each pulse when power-on periods (tON) cannot be sustained for a minimum period of 10 s [Citation3]. Even though this optimised protocol can create larger coagulation zones than a simple pulsing protocol, to date no computer model has reached this level of detail. Secondly, the impedance-controlled protocol was initially described using constant-current pulses [Citation3] rather than voltage pulses. In spite of this, we have observed in previous experimental studies that the RF generator really applies either current pulses or constant voltage pulses in the same RFA, probably depending on the tissue impedance encountered. This means it is also necessary to study the differences between models based on voltage pulses and those based on current pulses.
Our objective was thus to build RFA models that included an impedance-controlled pulsing protocol similar to that implemented in current RF generators in order to study the differences between voltage and current pulses and to compare the computer results with those obtained in previous experimental studies.
Method
Description of the model
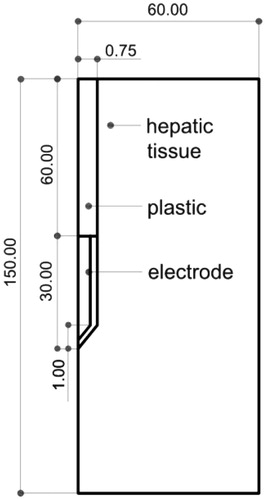
We considered the Cool-tip™ (Covidien, Boulder, CO, USA), a conventionally cooled, needle-like, 17G electrode (1.5 mm diameter) with a 3 cm active tip. It is internally cooled by chilled saline to keep electrode temperature below 10–15 °C [Citation13]. We assumed that the electrode was completely inserted in hepatic tissue, as shown in . The problem presents axial symmetry and hence a two-dimensional analysis is possible. The dispersive electrode was modelled as an electrical condition on outer boundaries at a distance from the active electrode.
Figure 1. Geometry of the model used in the study (out of scale, dimensions in mm). The outer dimensions (60 mm wide and 150 mm long) were calculated by means of a convergence test (see text for more details). The active electrode is labelled as ‘electrode’ while the dispersive electrode is really modelled as a boundary condition (zero voltage) applied at the top and bottom surfaces of the model.
Governing equations, boundary conditions and material characteristics
The model was based on a coupled electric-thermal problem, which was solved numerically using COMSOL Multiphysics software (COMSOL, Burlington, MA, USA). The governing equation for the thermal problem was the bioheat equation modified by the enthalpy method to take into account the vaporisation phenomenon [Citation14]:
(1)
where ρ is tissue density, h enthalpy, k thermal conductivity, T temperature and t time. The term q refers to the heat source from RF power, Qp refers to the BP heat and Qmet refers to the metabolic heat which is negligible in RFA. For biological tissues enthalpy is related to tissue temperature by the following expression [Citation14]:
(2)
where ρi and ci are density and specific heat of tissue respectively at temperatures below 100 °C (i = l) and at temperatures above 100 °C (i = g), hfg is the product of water latent heat of vaporisation and water density at 100 °C (2.17 × 10⁹ J/m3·K), and C is tissue water content inside the liver (68%) [Citation15]. The characteristics of materials used in the model are shown in [Citation14–16]. The BP heat Qp is zero for an ex vivo situation. In an in vivo situation Qp is computed from:
(3)
where ρb is density of blood, cb specific heat of blood, Tb blood temperature (37 °C), ωb BP coefficient (0.019 s−1) [Citation17] and β is a coefficient which took the values of 0 and 1 depending on the value of the thermal damage: β = 0 for Ω ≥ 4.6, and β = 1 for Ω < 4.6. The parameter Ω is assessed by the Arrhenius damage model [Citation18], which associates temperature with exposure time using a first-order kinetics relationship:
(4)
where R is the universal gas constant, A (7.39 × 1039 s−1) is a frequency factor and ΔE (2.577 × 10⁵ J/mol) is the activation energy for the irreversible damage reaction [Citation19]. We employed the D99 thermal damage contour to compute the coagulation zone contour dimension, which corresponds to Ω = 4.6 (99% probability of cell death). We found that this value offers a better prediction of coagulation zone size than Ω = 1 (68% probability of cell death) when compared to experimental results.
Table 1. Characteristics of the materials used in the theoretical model [Citation14–16].
The heat source from RF power q (Joule losses) was given by q = σ|E|2, where E is the electric field which was obtained from the electrical problem and σ was electrical conductivity. ∇·σ∇V = 0 was the governing equation for the electric problem, V being the voltage. The electric field was calculated by means of E = −∇V. We used a quasi-static approach due to the resistive current being much higher than displacement current at RF (≈500 kHz) [Citation20]. Electrical conductivity σ is a temperature-dependent piecewise function [Citation21,Citation22]:
(5)
where σ(37) represents the electrical conductivity assessed at 37 °C (see ). Initial and boundary temperatures were 37 °C and 21 °C for the in vivo and ex vivo situations, respectively. The cooling effect of the liquid circulating inside the electrode was modelled using a thermal convection coefficient hr with a value of 3127 W/K·m2 and a coolant temperature of 5 °C, following Newton’s law of cooling. The value of hr was calculated by considering the electrode length (3 cm) and a flow rate of 45 mL/min through an area equivalent to half the cross section of the inner diameter of the electrode. Tissue boundary conditions were set at electrical insulation, except the bottom and top surfaces, which were set at V = 0, since they represent the dispersive electrode. Once roll-off occurred, power was switched off for 15 s and then a new energy pulse was applied until the next roll-off [Citation3]. This procedure, common in clinical practice, was repeated for a period of 12 min.
Current and voltage pulses were applied to the electrode as boundary conditions. In the case of voltage pulses, impedance was evaluated (at any time) as a ratio between the applied voltage constant value and the total current flowing, which was computed by integrating the current density on the surfaces with a boundary condition of 0 V. For current pulses, impedance was evaluated (at any time) as a ratio between the value voltage computed at a point on the active electrode and the applied current constant value.
The model mesh was heterogeneous, with a finer mesh size at the electrode–tissue interface, where the highest electrical and thermal gradients were expected. All the mesh elements used were triangular. The size of the finer mesh was estimated by a convergence test. We used the value of the maximum temperature (Tmax) reached in the liver at the first roll-off time as a control parameter in these analyses. When there was a difference of less than 0.5% in Tmax between simulations we considered the former mesh size as appropriate. A similar convergence test was used to estimate the optimal outer dimensions. To find the solution to the time-dependent problem the implicit time-stepping method backward differentiation formulas (BDF) was used. The BDF method has been used for a long time and is well known for its stability. To modify how the time-stepping method selects the time steps, the free option was selected, i.e. to choose time steps freely. The multifrontal massively parallel sparse (MUMPS) direct solver method was chosen to solve the linear system equations of the finite element method (FEM) problem. To improve the convergence of the multiphysics problem, the segregated algorithm was used. This attribute makes it possible to split the solution process into substeps. No preconditioner was needed. The mean run time was 10 h.
All computer simulations were performed on a Dell T7500 workstation with Six Core 2.66 GHz Xeon processors and 48 GB RAM running on a Windows 7 Professional 64-bit operating system. The degrees of freedom in the final simulations of the finer mesh was 14.010 and the RAM requirements were 13.13 GB: 6.15 GB physical memory +6.98 GB virtual memory.
Variables analysed and cases considered
The following outcomes were analysed: 1) progress of the short (transverse) diameter of the coagulation zone, 2) time when first roll-off occurred and time between two consecutive roll-offs, and 3) evolution of electrical variables (current, voltage, power, and impedance). Moreover, energy was calculated as the integral of power over the simulation time, including periods in which power was switched off. Three conditions related to tissue temperature and BP were considered: 1) in vivo without clamping manoeuvre, which means considering the BP term (Qp in EquationEquation 1(1) ) and assuming a tissue temperature of 37 °C, 2) in vivo with clamping surgical manoeuvre in order to stop blood perfusing into the liver during RFA, which implies that the Qp = 0 and the tissue temperature is 37 °C, and 3) ex vivo, which models a bench-test situation and entails excluding Qp and assuming a tissue temperature of 21 °C.
Both current and voltage pulses were simulated. In the case of current, which seems to be the most relevant from the clinical point of view, the three above-mentioned conditions were considered. In the case of voltage, ex vivo and in vivo conditions (without clamping) were considered for a broad range of voltage values (45–100 V), while in vivo with clamping was only simulated with 90 V. The coagulation zone diameters computed with current pulses were compared to minor transverse diameters reported in previous experimental studies, since it is assumed that RF generators deliver current pulses rather than voltage pulses. Only experimental data corresponding to the same electrode design (17G, 3 cm) and same RFA duration (12 min) were appraised. When the experimental study did not specify the current value used, we assumed that the RF generator worked at maximum power (200 W) and therefore delivered pulses with a mean value of 1600 mA [Citation13].
The procedure proposed in Goldberg et al. [Citation3] was followed for both current and voltage pulses. In brief, we first searched for the level of current or voltage which allowed continuous application without the need for pulsing (i.e. without observing roll-off episodes). Pulses with a prefixed amplitude large enough to cause roll-offs were then applied, i.e. the pulsing protocol was put to work. Finally, we implemented the optimised pulsing protocol based on pulses with variable amplitude and dependent on the duration of the time in which RF is being applied (tON), i.e. amplitude was progressively reduced (5 V in the case of voltage pulses and 100 mA in the case of current pulses) if tON did not take a duration of 10 s.
Results
Current pulses
The value of the current which could be continuously applied for 12 min without a rise in impedance (roll-off) was 750 mA, regardless of the tissue condition. With this value, the coagulation zone diameters were 1.43 cm, 2.40 cm and 3.40 cm in the case of in vivo, ex vivo, and in vivo with clamping (i.e. without BP), respectively. For higher current values, roll-off episodes were observed and hence the pulsing protocol came into action. However, unlike the case of voltage pulses (see below), the gradual reduction in the duration of the pulses (tON) throughout the ablation was much less marked and in fact tON was always longer than 10 s, which prevented the optimised protocol being put into operation. shows the coagulation zone diameters for different current values and tissue conditions. As expected, the coagulation zones were larger without BP (ex vivo and in vivo with clamping). As expected, tissue temperature also affected coagulation zone size, since the diameters obtained at 21 °C (ex vivo case) were smaller than at 37 °C (in vivo without BP). The coagulation zone diameters created under ex vivo conditions were ≈1 cm larger than those created under in vivo conditions with BP and ≈1 cm smaller than those created under in vivo conditions without BP. The effect of increasing current from 1500 mA to 2000 mA on coagulation zone size was more pronounced in the in vivo case without clamping. For comparative purposes, also includes the values reported in previous experimental studies [Citation3,Citation13,Citation23–26].
Table 2. Coagulation zone diameters (in cm) computed finite element method (FEM) for different current values and tissue conditions (temperature and blood perfusion). Values reported in previous experimental studies are also included [Citation3,Citation13,Citation24–26].
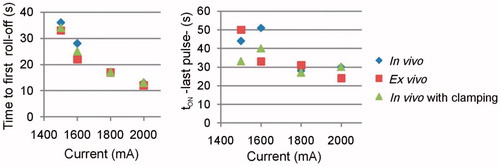
shows the evolution of the electrical variables during an RFA of 1500 mA pulses in the in vivo case. Voltage and power in general remained below 100 V and 200 W, respectively, except for the brief moments in which roll-offs occurred, which are not significant compared to the duration of the ablation. plots the times when the first occurred and tON at the end of the RFA for different current values and tissue conditions. Time to first roll-off was more or less similar regardless of tissue condition, and increased from 13 s to ≈35 s when current was reduced from 2000 mA to 1500 mA. The tON behaviour when current changed was more erratic (between 20 and 50 s) but tended to decrease in value at higher current values.
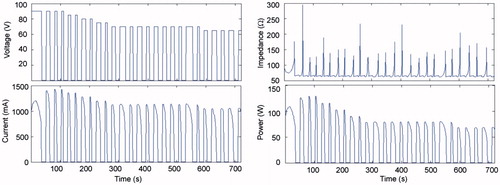
Figure 2. Evolution of voltage, impedance and power during a 12-min RFA using pulses of 1500 mA in the in vivo case.
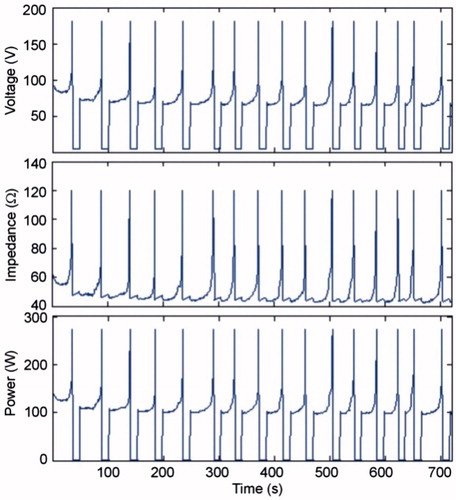
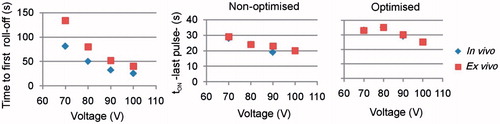
Figure 3. Effect of amplitude of current pulses and tissue conditions on the time of first roll-off and tON at the end of the 12-min RFA.
Voltage pulses
The voltage which could be continuously applied for 12 min without impedance increase (roll-off) was 45 V, regardless of the tissue condition. With this value, the coagulation zone diameters were 1.88 cm and 2.5 cm in the in vivo and ex vivo cases, respectively. Roll-off episodes were observed at higher voltages, which showed that the pulsing protocol was active. Unlike the case of current pulses, the duration of the pulses (tON) got gradually shorter throughout the ablation (see ), which meant that the optimised pulsing protocol had acted. shows the evolution of the electrical variables for the optimised protocol with initial pulses of 90 V.
Figure 4. Current, impedance and power evolution during a 12-min RFA using 90-V pulses and a non-optimised pulsing protocol (in vivo plots).
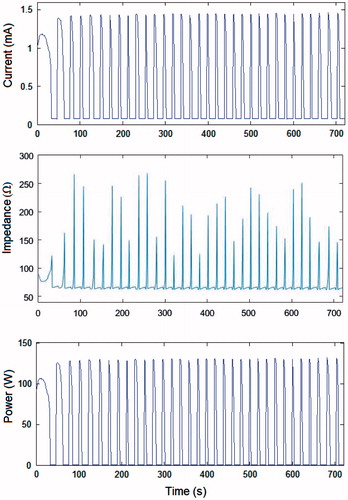
Figure 5. Voltage, current, impedance and power evolution during a 12-min RFA using 90-V pulses and an optimised pulsing protocol (in vivo plots). Note that the amplitude of the voltage pulses progressively decreased from 90 V to 65 V in order to keep tON longer than 10 s throughout the 12-min ablation.
gives the first roll-off time and the tON at the end of the RFA. Times to first roll-off were in general longer in the ex vivo case and increased dramatically when voltage dropped from 100 V to 70 V: from 25 s to 81 s in the in vivo case, and from 40 s to 134 s in the ex vivo case. These values were obviously identical for the non-optimised and optimised protocols. The tON values tended to decrease when voltage increased, were in general unrelated to the voltage level, and were longer for the optimised protocol.
Figure 6. Effect of voltage amplitude on the time of first roll-off and tON at the end of the 12-min RFA, for optimised and non-optimised pulsing protocols.
and show the coagulation zone diameters at different voltages and tissue conditions for the non-optimised and optimised pulsing protocols. No important differences in coagulation zone diameters were found between these protocols after 12 min of RFA for different values of applied voltage over 60 V. The optimised protocol produced a coagulation zone diameter 0.2 cm larger in vivo (from ≈2.4 cm to ≈2.6 cm) than the non-optimised protocol. This improvement was much less ex vivo (from ≈3.25 cm to ≈3.30 cm).
Figure 7. Coagulation zone diameters at different voltages in vivo at 37 °C and ex vivo at 21 °C and non-optimised and optimised pulsing protocols.
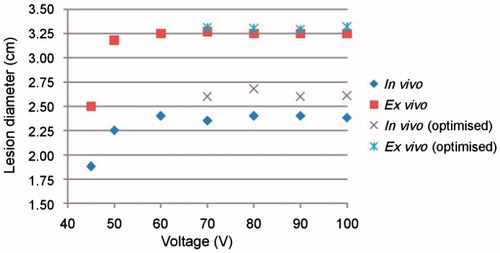
Table 3. Coagulation zone diameters (in cm) computed for different voltage values and tissue conditions.
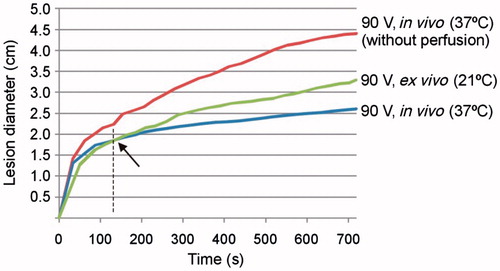
shows the time progress of the thermal diameter during a 90-V pulse RFA for the three cases: 1) in vivo with BP and 2) without BP (at 37 °C) and 3) ex vivo (at 21 °C). As expected, coagulation zone diameter in vivo was larger when perfusion was not considered. The difference with respect to the case with perfusion can be noted from approximately 40 s. On the other hand, the coagulation zone diameter, although initially smaller in the ex vivo case, changed this tendency after around 2 min and the coagulation zone finally created ex vivo (21 °C) was, as expected, larger than in vivo (37 °C).
Figure 8. Evolution with time of thermal diameter throughout 12 min of RFA for three cases in which 90-V pulses were applied in an impedance-controlled mode: in vivo with and without blood perfusion and tissue temperature of 37 °C, and ex vivo (without blood perfusion and tissue temperature of 21 °C). Note that the coagulation zone is initially larger in vivo (37 °C) than ex vivo (21 °C), but this tendency changes at the point signalled by the arrow.
In order to explain the differences between voltage and current pulses, we finally analysed the applied energy in each case, and also estimated mean power as the ratio between the applied energy and the accumulated time for which the energy was really applied, i.e. the sum of tON. shows the values of energy and mean power for voltage and current pulses in the in vivo case. Energy was considerably higher in the current pulse case.
Table 4. Comparison between voltage and current pulses in terms of electrical parameters and coagulation zone diameters (in vivo case, 37 °C, with blood perfusion).
Discussion
Comparison between current pulses and voltage pulses
The simulations in which current pulses were programmed showed interesting differences from the case involving voltage pulses. In essence, tON was always longer than 10 s, thus making it unnecessary to use the optimised protocol. The number of roll-offs up to 720 s of RFA was around 15, while there were about 23 with voltage pulses. This last value is more in agreement with those obtained in experimental studies (see in Romero-Méndez et al. [Citation27] and in Lee et al. [Citation26]). However, the waveforms of the electrical variables obtained when current pulses are employed were more similar to those observed in the experiments compared to those created with voltage pulses.
The coagulation zone diameters created with current pulses were larger than those created with voltage pulses (e.g. 2.61 cm with 100 V, versus 2.8 cm with 1500 mA). There could be two reasons for this fact. First, the peak power, which was higher with current pulses (around 150 W, see ) compared to voltage pulses (around 125 W, see ). And second, the difference in accumulated energy (see ), which is up to three-times higher with current pulses because tON is in general longer (see versus and , and versus ). We think that the delay in roll-off with constant current (I) is because even though impedance (Z) is gradually decreasing during heating, power (P = I2 × Z) is also dropping and this acts as a protecting mechanism which delays overheating and avoids triggering roll-off.
All the above suggests clinical implications: using current instead of voltage would allow larger coagulation zones to be created. In fact, observing the experimental waveforms of the electrical variables throughout an RFA, we can conclude that the present RF generators normally deliver current pulses rather than voltage pulses. The general performance is as follows: RF generators have a maximum power and limited current and voltage. For instance, a 200-W RF generator has limits of 100 V and 2000 mA. With these technical specifications the generator will be able to provide 200 W at a tissue impedance of 50 Ω (V/I = 100 V/2000 mA). However, power will be lower than 200 W when tissue impedance is 100 Ω, and in these circumstances the voltage will be limited to 100 V, while maximum current will be 1000 mA (= 100 V/100 Ω). In general, therefore, tissue impedances higher than 50 Ω will imply that the RF generator provides a maximum voltage of 100 V and current will depend on the impedance value. In contrast, power will also be lower than 200 W when tissue impedance is 40 Ω, for instance, and in these circumstances current will be limited to 2000 mA, while maximum voltage will be 80 V (= 2000 mA ×40 Ω). Tissue impedances below 50 Ω will imply that the RF generator provides a maximum current of 2000 mA and voltage will depend on the impedance value. This means that the same RF generator will work with either current or voltage according to the tissue impedance it encounters. Our computer results suggest that delivering RF power by current pulses delays roll-off and creates larger coagulation zones. A possible way of ensuring this working condition would be to reduce tissue impedance, for instance, by saline infusion before heating [Citation28].
Optimised versus non-optimised pulsing protocol
Unlike the findings of Goldberg et al. [Citation3], the computer results using current pulses showed that the optimised protocol was not necessary, since tON was always longer than 10 s. In contrast, voltage pulses significantly reduced tON to less than 10 s. As observed in Goldberg et al. [Citation3], coagulation zone diameter was independent of the voltage value (for values higher than 60 V), with both a non-optimised and optimised protocol. Although our results show that the optimised protocol can create larger coagulation zones than non-optimised, the improvement was much smaller than that reported in Goldberg et al. [Citation3] with current pulses under ex vivo conditions (0.05 versus 1.1 cm).
Effect of tissue conditions (BP and initial temperature)
With both current and voltage pulses, coagulation zone diameters under ex vivo conditions were larger than those created in vivo, and smaller than in vivo without BP. This suggests that both tissue temperature (21 °C versus 37 °C) and BP impact on coagulation zone size, regardless of whether voltage or current pulses are used. In fact, our computer results match well qualitatively with those reported in Belous and Podhajsky [Citation23]: 3.3 ± 0.4 cm for ex vivo at 22 °C, 1.8 ± 0.5 cm for in vivo at 37 °C, and 4.0 ± 0.6 cm for ex vivo at 37 °C. In the in vivo case, our results with and without clamping closely agree with those observed experimentally since the coagulation zone diameters were always larger with clamping [Citation29]. Surprisingly, our results also showed that in vivo coagulation zones were larger than ex vivo at the start of heating (see ). We had already observed this fact in previous computer and experimental studies involving short durations (20–60 s) [Citation30,Citation31]. We believe that the initial tissue temperature (room versus body) could be a conditioning factor right from the start of ablation and would be almost the only factor in tissue 12 mm away, while the thermal sink effect caused by BP would have almost no effect in the first few seconds and would mainly affect distant tissue (>10 mm [Citation32]), i.e. would not be influenced by direct heating. Our computer results seem to confirm this hypothesis.
Comparison with experimental data
In the computer simulations, the optimised protocol only came into action when voltage pulses were programmed. If we assume that the real protocol is based on current pulses, our results do not match with previous experimental results either ex vivo [Citation3] or in vivo [Citation26], where a progressive decrease in the amplitude of current pulses is observed. However, the computer results with voltage pulses reproduced the findings of Goldberg et al. [Citation3] in terms of a progressive reduction of tON to values of 2–3 s, and coagulation zone diameters were larger when the optimised protocol was used.
In spite of the disagreement on the necessity for the optimised protocol with current pulses, the computed waveforms of the electrical variables with current pulses (see ) matched well with those reported experimentally [Citation26]. The computed current value which could be continuously applied for 12 min without roll-off (750 mA) coincided exactly with the experimental ex vivo results [Citation3], but not in vivo (1100 mA in Goldberg et al. [Citation3]). The computed in vivo coagulation zone diameter with 1600 mA pulses (3 cm) was between the values obtained by Goldberg et al. (3.7 cm) [Citation3] and those reported by others (1.8 cm [Citation23] to 2.6 cm [Citation13,Citation26]). Likewise, the computed ex vivo coagulation zone diameters were in general smaller than those reported by Goldberg et al. [Citation3] and larger than those reported by others (see ). In general, Goldberg et al’s experimental values [Citation3] were the largest of those reported in the literature. Our results were always within the range of the reported experimental results.
Comparing the in vivo computer results using both current () and voltage () pulses, with those reported in experimental studies (coagulation zone diameters between 1.8 and 2.6 cm [Citation13,Citation23,Citation26]), we conclude that in order to model a 12-min RFA at 200 W nominal power, two options could be chosen, both with pros and cons:
Voltage pulses of 100 V: These allow coagulation zone diameters of 2.38 and 2.61 cm to be predicted without and with an optimised protocol, respectively, which are very close to the reported experimental values. The number of roll-offs during the RFA matches well with those observed experimentally. However, the computed waveforms, especially applied power, do not match with the experimental results.
Current pulses of 1600 mA: Programming current pulses achieved a more realistic evolution of the electrical variables. As a negative, the coagulation zone diameters computed are slightly larger than those reported in most experiments (3.0 versus 2.6 cm) and there are fewer roll-offs than experimentally observed.
It is important to note that these conclusions are valid when coagulation zones are estimated using D99 at a BP coefficient of 0.019 s−1 [Citation17]. We obtained larger coagulation zones with D63 and lower values of BP coefficient, e.g. 0.003 s−1 [Citation33].
Limitations of the study
Trying to match computer results with experimental results is without doubt a complex task due to the many factors involved and the variations in experimental conditions. To date, computer studies on RFA have examined the effect of specific factors related to the procedure and different modelling approaches [Citation4–11]. None have focused on a direct comparison of different experimental results in terms of coagulation zone size and the evolution of electrical variables. The task is even harder if clinical results are used, since they can vary immensely, from 1.7 to 5.3 cm [Citation34]. This is possibly due to variations in tissue characteristics and procedural factors such as multiple applications of RF power on the same target to increase total coagulation zone size by overlapping.
We must also point out a technical detail: the computer simulations with voltage pulses could only be run with a direct solver, while those with current pulses could be run with the iterative solver. Another option was not possible due to convergence problems at the first roll-off. Both methods are available with COMSOL to solve systems of linear equations; however, while the direct solvers use more memory than the iterative solvers and are more robust, iterative solvers approach the solution gradually and hence have fewer convergence problems. Unfortunately we were not able to compare both methods with the same pulse type (voltage or current). However, we found that both methods showed identical solutions in terms of coagulation zone size, at least until the arrival of the first roll-off.
The goal of this study was to set a computational model to mimic the impedance-controlled pulsing protocol implemented in RF generators used for clinical practice of RFA. For this reason, and despite it being clearly out of the scope of this study, we could comment about how the model parameters could be obtained in a specific patient in order to plan the treatment. The high number of model parameters, along with some of the parameters’ temperature dependence, suggests that it is still difficult to run in a reasonable period of time a realistic simulation based on a patient-specific setting with the computer resources currently available. Despite this, we could suggest that the electrical conductivity could be estimated indirectly from pre-RFA impedance measurement. Also, prior to RFA, BP and thermal characteristics could be indirectly estimated from measurements of the electrode temperature response (without internal cooling) following the application of low-power brief RF pulses, as proposed in Schumacher et al. [Citation35] and Petersen et al. [Citation36].
Conclusions
The proposed model reflects electrical-thermal performance during an impedance-controlled pulsing protocol reasonably well. Differences between voltage and current pulses protocol are noticeable: using current instead of voltage would allow larger coagulation zones to be created. If voltage pulses are employed, the model can accurately predict number of roll-offs, although the waveform of the applied power is clearly not realistic. If current voltages are employed, the applied power waveform matches well with those reported experimentally, but there are significantly fewer roll-offs. Even though the size of the coagulation zone reported in previous experimental studies varies widely, our computer results are within the same ranges.
Declaration of interest
This work was supported by the Spanish Plan Estatal de Investigación, Desarrollo e Innovación Orientada a los Retos de la Sociedad under grant number TEC2014–52383-C3-R (TEC2014–52383-C3–1-R). The authors alone are responsible for the content and writing of the paper.
References
- Hocquelet A, Balageas P, Laurent C, Blanc JF, Frulio N, Salut C, et al. Radiofrequency ablation versus surgical resection for hepatocellular carcinoma within the Milan criteria: a study of 281 western patients. Int J Hyperthermia 2015;31:749–57.
- Fukushima T, Ikeda K, Kawamura Y, Sorin Y, Hosaka T, Kobayashi M, et al. Randomized controlled trial comparing the efficacy of impedance control and temperature control of radiofrequency interstitial thermal ablation for treating small hepatocellular carcinoma. Oncology 2015;89:47–52.
- Goldberg SN, Stein MC, Gazelle GS, Sheiman RG, Kruskal JB, Clouse ME. Percutaneous radiofrequency tissue ablation: optimization of pulsed-radiofrequency technique to increase coagulation necrosis. J Vasc Interv Radiol 1999;10:907–16.
- Ahmed M, Liu Z, Humphries S, Goldberg SN. Computer modeling of the combined effects of perfusion, electrical conductivity, and thermal conductivity on tissue heating patterns in radiofrequency tumor ablation. Int J Hyperthermia 2008;24:577–88.
- Lobo SM, Liu ZJ, Yu NC, Humphries S, Ahmed M, Cosman ER, et al. RF tumour ablation: computer simulation and mathematical modelling of the effects of electrical and thermal conductivity. Int J Hyperthermia 2005;21:199–213.
- Solazzo SA, Liu Z, Lobo SM, Ahmed M, Hines-Peralta AU, Lenkinski RE, et al. Radiofrequency ablation: importance of background tissue electrical conductivity – an agar phantom and computer modeling study. Radiology 2005;236:495–502.
- Barauskas R, Gulbinas A, Barauskas G. Investigation of radiofrequency ablation process in liver tissue by finite element modeling and experiment. Medicina (Kaunas) 2007;43:310–25.
- Haemmerich D, Wood BJ. Hepatic radiofrequency ablation at low frequencies preferentially heats tumour tissue. Int J Hyperthermia 2006;22:563–74.
- Haemmerich D, Chachati L, Wright AS, Mahvi DM, Lee FT Jr, Webster JG. Hepatic radiofrequency ablation with internally cooled probes: effect of coolant temperature on lesion size. IEEE Trans Biomed Eng 2003;50:493–500.
- Schutt DJ, Haemmerich D. Effects of variation in perfusion rates and of perfusion models in computational models of radio frequency tumor ablation. Med Phys 2008;35:3462–70.
- Haemmerich D. Mathematical modeling of impedance controlled radiofrequency tumor ablation and ex-vivo validation. Conf Proc IEEE Eng Med Biol Soc 2010;2010:1605–8.
- Zhang B, Moser MA, Zhang EM, Luo Y, Zhang W. Numerical analysis of the relationship between the area of target tissue necrosis and the size of target tissue in liver tumours with pulsed radiofrequency ablation. Int J Hyperthermia 2015;31:715–25.
- Solazzo SA, Ahmed M, Liu Z, Hines-Peralta AU, Goldberg SN. High-power generator for radiofrequency ablation: larger electrodes and pulsing algorithms in bovine ex vivo and porcine in vivo settings. Radiology 2007;242:743–50.
- Abraham JP, Sparrow EM, A thermal-ablation bioheat model including liquid-to-vapor phase change, pressure- and necrosis-dependent perfusion, and moisture-dependent properties. Int J Heat Mass Transfer 2007;50:2537–44.
- Pätz T, Kröger T, Preusser T, Simulation of radiofrequency ablation including water evaporation. IFMBE Proc 2009;25/IV:1287–90.
- Trujillo M, Alba J, Berjano E, Relation between roll-off occurrence and spatial distribution of dehydrated tissue during RF ablation with cooled electrodes. Int J Hyperthermia 2012;28:62–8.
- Hall SK, Ooi EH, Payne SJ, Cell death, perfusion and electrical parameters are critical in models of hepatic radiofrequency ablation. Int J Hyperthermia 2015;31:538–50.
- Chang IA. Considerations for thermal injury analysis for RF ablation devices, Biomed Eng Online 2010;4:3–12.
- Jacques S, Rastegar S, Thomsen S, Motamedi M. The role of dynamic changes in blood perfusion and optical properties in laser coagulation tissue. IEEE J Sel Top Quantum Electron 1996;2:922–33.
- Doss JD. Calculation of electric fields in conductive media. Med Phys 1982;9:566–73.
- Byeongman J, Aksan A. Prediction of the extent of thermal damage in the cornea during conductive thermokeratoplasty. J Therm Biol 2010;35:167–74.
- Haemmerich D, Chachati L, Wright AS, Mahvi DM, Lee FT, Webster JG. Hepatic radiofrequency ablation with internally cooled probes: effect of coolant temperature on lesion size. IEEE Trans Biomed Eng 2003;50:493–9.
- Belous A, Podhajsky RJ. The effect of initial and dynamic liver conditions on RF ablation size: a study in perfused and non-perfused animal models. Proc SPIE 2009;7181:71810B.
- Song KD, Lee MW, Park HJ, Cha DI, Kang TW, Lee J, et al. Hepatic radiofrequency ablation: in vivo and ex vivo comparisons of 15-gauge (G) and 17-G internally cooled electrodes. Br J Radiol 2015;88(1050):20140497.
- Cha J, Choi D, Lee MW, Rhim H, Kim YS, Lim HK, et al. Radiofrequency ablation zones in ex vivo bovine and in vivo porcine livers: comparison of the use of internally cooled electrodes and internally cooled wet electrodes. Cardiovasc Intervent Radiol 2009;32:1235–40.
- Lee JM, Han JK, Chang JM, Chung SY, Kim SH, Lee JY, et al. Radiofrequency ablation of the porcine liver in vivo: increased coagulation with an internally cooled perfusion electrode. Acad Radiol 2006;13:343–52.
- Romero-Méndez R, Tobajas P, Burdío F, Gonzalez A, Navarro A, Grande L, et al. Electrical-thermal performance of a cooled RF applicator for hepatic ablation with additional distant infusion of hypertonic saline: in vivo study and preliminary computer modeling. Int J Hyperthermia 2012;28:653–62.
- Ahmed M, Lobo SM, Weinstein J, Kruskal JB, Gazelle GS, Halpern EF, et al. Improved coagulation with saline solution pretreatment during radiofrequency tumor ablation in a canine model. J Vasc Interv Radiol 2002;13:717–24.
- Chinn SB, Lee FT Jr, Kennedy GD, Chinn C, Johnson CD, Winter TC III, et al. Effect of vascular occlusion on radiofrequency ablation of the liver: results in a porcine model. Am J Roentgenol 2001;176:789–95.
- Arenas J, Perez JJ, Trujillo M, Berjano E. Computer modeling and ex vivo experiments with a (saline-linked) irrigated electrode for RF-assisted heating. Biomed Eng Online 2014;13:164.
- González-Suárez A, Trujillo M, Burdío F, Andaluz A, Berjano E. Feasibility study of an internally cooled bipolar applicator for RF coagulation of hepatic tissue: experimental and computational study. Int J Hyperthermia 2012;28:663–73.
- Schramm W, Yang D, Wood BJ, Rattay F, Haemmerich D. Contribution of direct heating, thermal conduction and perfusion during radiofrequency and microwave ablation. Open Biomed Eng J 2007;1:47–52.
- Chang IA, Nguyen UD. Thermal modeling of lesion growth with radiofrequency ablation devices. Biomed Eng Online 2004;3:27.
- Montgomery RS, Rahal A, Dodd GD III, Leyendecker JR, Hubbard LG. Radiofrequency ablation of hepatic tumors: variability of lesion size using a single ablation device. Am J Roentgenol 2004;182:657–61.
- Schumacher B, Eick O, Wittkampf F, von Pezold C, Tebbenjohanns J, Jung W, et al. Temperature response following nontraumatic low power radiofrequency application. Pacing Clin Electrophysiol 1999;22:339–43.
- Petersen HH, Svendsen JH. Can lesion size during radiofrequency ablation be predicted by the temperature rise to a low power test pulse in vitro? Pacing Clin Electrophysiol 2003;26:1653–9.