
Abstract
Purpose: A hyperdense rim is commonly observed at the periphery of ablation zones during post-ablation imaging (e.g. ultrasound) in tumours. A mathematical model has been developed here to investigate the occurrence of this enhanced rim, caused by the ablated cells, giving an indication of the location of the final ablation region.
Materials and methods: The enhanced rim has been assumed here to be due to a tissue-level oedematic response of viable cells, which necessitated coupling multiple modelling elements in a spatially distributed system: thermal cell death, tissue-state dependent ion concentration dynamics, ion transport in the extracellular space, and osmotic cell volume regulation.
Results: In response to the imposed temperature function, an ablation zone was predicted, distinguishing the tissue state between ‘dead’ and ‘alive’. A disturbance in intracellular/extracellular ion concentrations was induced due to ion redistribution, which acted as an osmotic stress and contributed to significant cell swelling in a thin rim at the periphery of the ablation zone. It was also found that the rim size only changed slightly with varying lesion size, in response to different temperature profiles.
Conclusions: The study presents a novel mathematical model to understand the enhanced rim surrounding the ablation zone by assuming tissue-level cell oedema as the primary potential cause. The model links the direct response to thermal injury to an observable secondary response, which could be of clinical value in that the location of this bright ring could potentially be used for more accurate determination of the extent of the ablation zone.
Introduction
Minimally invasive hyperthermic ablations with guidance from imaging play an increasing role in cancer treatment. Radiofrequency ablation (RFA) and microwave ablation (MWA) are two of the most commonly used treatments. The underlying mechanism of thermal therapies is that irreversible cell damage is induced in response to hyperthermic temperatures (≥50 °C), with cells ultimately undergoing coagulative necrosis [Citation1]. Incomplete ablation is one major cause of failure of thermal therapies, and this can often be attributed to the heat-sink effect of the tumour vasculature [Citation1] and the lack of experience of the radiotherapists [Citation2]. Mathematical modelling provides a valuable tool to assist in treatment planning, with considerable effort being spent on the development of bio-heat transfer models [Citation3] and on modelling thermal damage processes and cell death [Citation4].
Clinically, the response of thermal treatments is assessed by post-treatment imaging, often contrast-enhanced computed tomography (CT), with the appearance and size of ablation regions being of primary concern. In addition, a rim of enhancement has been observed at the periphery of the ablation region in different phases, ranging from immediately after treatment to several months, indicating an increase in density of tissue [Citation5–7]. It has been postulated to be a physiological response to thermal injury, which initially results from hyperaemia, and subsequently from fibrosis and giant cell reaction [Citation5]. The hyperintense rim is also a common finding from post-ablative MR-diffusion-weighted imaging, which indicates a significant drop in the apparent diffusion coefficient (ADC), one that might be correlated to oedema as a reaction to thermal stress [Citation8]. Cellular oedema is also hypothesised to contribute to its presence [Citation9]. Analogous to cytotoxic oedema in the field of neuroradiology [Citation10], oedema may be induced in response to the osmotic stress which results from the movement of active ions in the extracellular space due to impairment of trans-membrane ion pumps as a consequence of thermal cell death. In this regard, the presence of the rim is closely tied to the final lesion size, which could be of clinical value in terms of providing supplementary information about and evaluation of the ablation volume.
This study presents a novel mathematical model to capture the occurrence of cellular swelling at the periphery of ablation zones, which was presumed to be the dominant mechanism for the rim of enhancement. As there are few published studies for modelling such behaviour, an initial step was taken to develop a mathematical model that integrates three essential components: (1) a three-state thermal cell death model [Citation11] was adopted to predict the size of the ablation region, (2) an ion-based model has been included to account for the kinetics of ionic trans-membrane transport and regulation of cell volume controlled by osmotic processes, (3) ion transport in the extracellular space plays a key role in the movement of the effects of thermal cell death on trans-membrane ionic kinetics in the lesion zone to its neighbouring region, generating a redistribution of ion concentrations and thus imposing osmolality stresses. By having all the elements assembled in a well-controlled computational modelling set-up, clear explanations can be provided on how cell swelling is induced as the physiological response of cells at the periphery of ablation zones.
Methods
illustrates the components of the model and their interplay contributing to cellular oedema. A mechanical thermal cell death model has been used to predict the tissue state in terms of the spatial distribution of cell viability in response to hyperthermia damage. Up to now, most of the modelling efforts on cellular oedema have been made in the cardiac or nervous systems [Citation12–16]. Despite very sparse literature being available with respect to the tumour environment, a generic Hodgkin–Huxley formulation for ionic currents has been used here to track ionic transport dynamically. Sodium, potassium and chloride were specified due to their well-established transport (pump-leak) modes, and the cell volume control was regulated by transmembrane osmotic pressure [Citation15,Citation16]. Therefore, the ion-based model has been presented in general terms without referring to any specific cell type, the details related to which (e.g. the specific ion species and transport systems involved) could and should be examined individually in future.
Figure 1. Schematic diagram of model of cell oedema post-ablation.
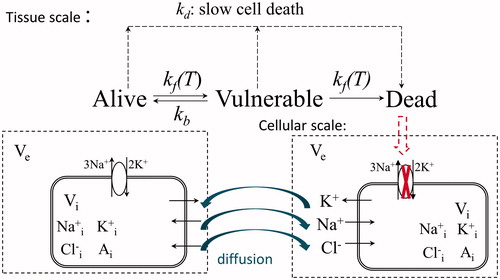
An alteration in the dynamics of ion concentrations is caused by the transition of cell states. When embedded in a spatially distributed system, any disturbance in local behaviour is not isolated; rather, it is transported to its neighbourhood by ion movement. In this way any deviation in ion concentrations from their physiological levels can be potentially presented as a stress signal, which induces an osmotic response, with a potential increase in cell volume being observed.
Modelling dynamics of intracellular ionic concentrations
In the current work, concentrations of ions have been denoted by Nae/i, [K]e/i and [Cl]e/i with subscripts ‘e’ and ‘i’ referring to the extracellular and intracellular spaces respectively. In normothermia, intracellular ion quantities are balanced by ion currents across the cell membrane through ion channels (iNa, iK, iCl), and the ion pump (the Na-K-ATP pump with exchange of Na+ and K+ ions in the ratio 3:2, iNaK), as shown in and described in the following equations, based on the pump-leak mechanism [Citation15]:
(1)
(2)
(3)
where F is Faraday’s constant, and vc is the cell volume (dynamically regulated by osmolality). The ion currents from passive ion transport were assumed to be described by a Hodgkin–Huxley-type model, in terms of membrane conductances, the membrane potential (Em) and the Nernst potentials (vion):
(4)
(5)
(6)
For Na+ and K+, the membrane conductances were a combination of the background leak conductances (gNal and gKl) and voltage-dependent gated conductances as a function of voltage-dependent gating variables taken from the Hodgkin–Huxley model [Citation16]. These were assumed to be at quasi-steady state (m∞, h∞ and n∞) due to the very fast timescales of the gating of ions, as given in . Though the time constants of channel gating (i.e. ion channel dynamics) were more sensitive to the temperature change [Citation17], the variables at quasi-steady state were of interest. Thus, it has been assumed that the impact of temperature on ion dynamics can be neglected in the current study.
Table 1. Gating variables at quasi-steady state (m∞, h∞ and n∞).
The leak current for Cl- has a constant membrane conductance (gCl), as do those of Na+ and K+ (gNal and gKl); Eeq was the resting potential, set here to be −70 mV.
The membrane potential (Em) was calculated by applying Kirchoff’s law with the assumption that the cell membrane acts as a capacitor, with Cm denoting membrane capacitance:
(7)
The Nernst potentials (vion) of an ion with valence zion are given by:
(8)
where R is the universal gas constant and T is the absolute temperature.
The pump current rate was modelled by the formula introduced by Luo and Rudy [Citation18]:
(9)
where Pmax represents the maximum pump current, and Km, Nai and Km, Ke the half saturation concentrations for [Na]i and [K]e, respectively. fNaK reflects the effect of rectification of membrane potential on the Na/K pump:
(10)
Modelling cell volume
The volume of a cell (vc) was assumed to be regulated in response to the osmotic pressure difference, which drives water into or out of the cell:
(11)
where Lp is the membrane permeability to water flow, and As is the cell membrane surface area. The cell membrane surface area was assumed here to be constant for simplicity despite changes in the shape and hence the volume of the cell. Non-permeable organic molecules inside cells also contribute to cell volume regulation, and their concentration (Ai) varies inversely with intracellular volume, assuming a fixed total amount present.
The interstitium was assumed to be a continuum, in which cells are uniformly distributed at constant number density (Nc) and collectively constitute the intracellular space, surrounded by the extracellular space. Making the assumption of homogeneous cells, the intracellular volume at tissue scale is given by Vi = vc Nc. The volumes of intracellular and extracellular space were allowed to vary according to Vi + Ve = V0, where V0 is a representative elementary volume. In terms of volume fraction, the relationships read:
(12)
(13)
where ∅i and ∅e are the volume fractions of intracellular and extracellular space, respectively.
Modelling ion transport in extracellular space
In addition to the local influx and efflux of ions across the cell membrane locally, ions also transport via the mode of diffusion (concentration gradient as the dominant driving force, neglecting electrodiffusion) in the extracellular space. Extracellular ion concentrations were derived from the mass balance of the ion species:
(14)
(15)
(16)
where Dion* are the effective diffusion coefficients of the ions in the extracellular space, incorporating the effect of varying extracellular volume fraction on diffusion coefficients in free media as:
(17)
The term Sion represents a source/sink term for ions, i.e. influx/efflux of ions across the cell membrane is reflected at the tissue scale with the assumption of a collection of homogeneous cells lumped into the intracellular space:
(18)
(19)
(20)
In the current study, the geometry has been set to be a one-dimensional spherically symmetrical coordinate space. Therefore, conservation equations of extracellular ions can be expressed explicitly as:
(21)
(22)
(23)
Modelling thermal cell death
It is of great importance to have proper descriptions relating tissue temperature to tissue state; this was chosen as cell viability in the current study. The hyperthermic cell death model developed by O’Neill et al. [Citation11] was adopted here, since this takes into account both fast cell death during ablation (cell transition among three states proposed as alive (denoted by A), vulnerable (V), and dead states (D)), and slow cell death days after thermal treatment. A schematic of this model is shown in . Using standard reaction kinetics, the system is described by two simultaneous differential equations, given the constraint that A + D + V = 1:
(24)
(25)
(26)
where kf is the forward rate whilst kb is the backward rate. It was noted that kf is a function of temperature, with kf being a scaling factor and Tk a parameter that calibrates the exponential dependence on temperature; this term also incorporates the factor (1 - A) to acknowledge the potentially greater effect of the damaged state of surrounding cells on the reaction dynamics. A continuous decrease in cell viability through the slow cell death mechanism was assumed to initiate 2 h post-treatment, when cell viability was below a critical post-heating cell viability threshold (1 - Dτ).
(27)
(28)
where ks is the transition rate of a secondary, slow cell death mechanism and includes a baseline scaling factor ks, and the threshold value. The incorporation of D(1 − D) was done to give the best fit to the data while satisfying the restrictions imposed on ks (see O’Neill et al. [Citation11] for more details).
The final part of the model was the inclusion of the impact of thermal cell death on the other sub-models.
Effect on trans-membrane ionic kinetics
It was assumed here that the cell membrane does not rupture during ablation, thus providing a continuous barrier between ion concentrations in the intracellular and extracellular spaces. It was further assumed that active ionic transport (iNaK) was disrupted when cells transition into the dead state, while having a negligible effect on passive ionic transport (iNa, iK, and iCl). However, passive ionic transport was also affected as it was essentially determined by the ion concentrations. In other words, upon cell death, ionic transmembrane transport was purely a passive process, dependent on chemical and electrical driving forces without biological regulation through Na-K pumps.
Despite there being heterogeneous cell types (dead versus alive) induced by thermal treatments, ‘averaged’ intracellular ion concentrations at the tissue scale can be approximated by linearly correlating the fraction of cell viability to the active ionic currents. Note that the vulnerable (V) cell state is the cell state located between the fully alive (A) and dead (D) states. In a biological sense, it is intended to represent a state in which the cell’s normal functions may be impaired but when the cell is not yet fully dead. It has been assumed here that only fully alive cells are capable of powering ion pumps and regulating osmotic volume to maintain homeostasis during and after thermal ablation. Thus, the modified form of intracellular Na+ mass balance at the tissue scale (EquationEquation 18(18) ) is given as:
(29)
Similarly for K+, the final expression is:
(30)
Effect on cell volume
It was assumed that the change of cell volume undergoes two phases. In the first phase the cell volume follows osmotic regulation during ablation, and then it is deprived of such regulation due to non-viability of cells within the ablated zone, upon which it stops changing and remains at the final volume independent of further change in transmembrane ion concentrations. Thus EquationEquation 12(12) describing change of volume fraction at the tissue scale was modified by correlating it with cell viability; this permitted a consistent description of cell volume change by osmosis in the unablated region:
(31)
Numerical methods
In total, the model contains 10 independent variables, which can be written in vector form as u = ([Na]e, [K]e, [Cl]e, [Na]i, [K]i, [Cl]i, ∅i, Em, A, D)T. The system of governing equations was correspondingly finalised by EquationEquations 21(21) , Equation22
(22) , Equation23
(23) , Equation29
(29) , Equation30
(30) , Equation20
(20) , Equation31
(31) , Equation7
(7) , Equation24
(24) and Equation25
(25) /Equation27
(27) . Three of the governing equations are partial differential equations dealing with ion diffusion in the extracellular space while the others are intrinsically ordinary differential equations (ODE) based. When the space-dependent terms are discretised in a standard finite difference method, the spatial derivatives are converted into a source term, which allows the system of equations to be written in the form
(32)
where M corresponds to the mass matrix in accordance with the temporal derivative vector of the 10 variables, whilst Fdiff are forcing functions associated with extracellular diffusion. The resulting system of ODEs was solved in MATLAB using a stiff solver, with ode15s being chosen based on considerations of numerical accuracy as well as the time and state dependence of the mass matrix.
Temperature function
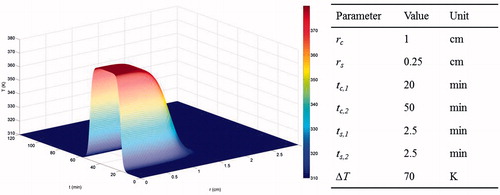
For simplicity, a representative tempo-spatial temperature profile during ablation [Citation19] was assigned to initiate simulations:
(33)
where T0 is the baseline temperature and ΔT is the maximum temperature rise. The hyperbolic tangent function is specified by parameters (rc, tc,1 and tc,2) that set the offsets of the centre points, and parameters (rs, ts,1 and ts,2) that scale the stretches of spatial and temporal distributions. The temperature profile is depicted in using the given baseline parameter values.
Figure 2. Temperature profile imposed on the system.
Parameter values
Parameters in the study were roughly divided into three categories: those involved in the ion-based model, those relating to ion transport, and those describing thermal cell death. For the typical Hodgkin–Huxley type of ionic currents in the present study, values of the conductance parameters were chosen to ensure that the system was at its steady state at t = 0, i.e. null currents of each ion species, according to initial conditions, and capable of displaying long-term stability even under physiological conditions, i.e. the variables return to their original steady state after minor perturbations to them. The initial concentrations of intracellular non-permeable anions were calculated to fulfil osmotic balance at the initial state. Diffusion coefficients of ions were used as those estimated in brain tissue, which also acts as a porous medium. Such a choice was capable of reflecting the timescale of diffusion transport in the tumour extracellular space. Finally, parameter values in Φ the thermal death model were readily available from the work by O’Neill et al. [Citation11]. A complete list of parameter values and their sources is given in .
Table 2. Parameter values.
Initial and boundary conditions
Initial conditions for all variables were set to be those values determined under physiological temperature and are listed in . To complete the diffusion–convection–reaction equations of extracellular ions, a zero flux boundary condition was assigned at the origin, and baseline physiological concentrations were set at the outer radius which was assumed to be sufficiently far away from the origin.
Table 3. Initial values of variables.
Results
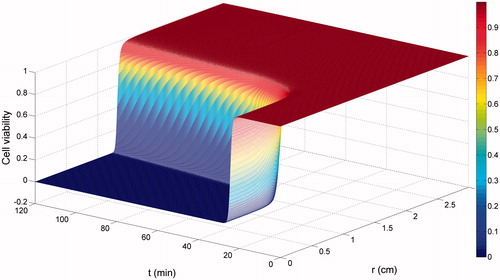
shows the simulation results of cell viability based on the fast cell death kinetics, which was sufficiently accurate to represent the ablation volume in response to the imposed temperature profile here. Irreversible cell death was induced and completed rapidly within minutes, generating an ablation region with zero cell viability, beyond which cells stayed undamaged.
Figure 3. Cell viability in response to the imposed temperature profile.
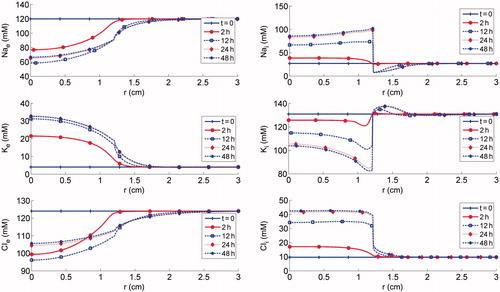
shows the spatial distribution of ion concentrations using the given temperature profile at varying time points. Shortly after the ablation, large changes in the intracellular/extracellular ion distributions were seen in the ablation region, as the activity of the Na-K-ATP pumps diminishes with decreasing cell viability. These changes are seen as the accumulation of sodium in the intracellular space with a corresponding depletion of potassium, with the reverse trend in the corresponding ions in extracellular space. Consequently, the cell membrane potential undergoes a sudden change, from a negative intracellular charge to a positive one, which in turn causes an influx of chloride ions into the tumour cells. As time goes on, deviations of the intracellular/extracellular ion concentrations from their baseline values were observed beyond the ablation region. The steep concentration gradient in the periphery of the cell death domain provides a powerful driving force for ion diffusion in the remaining domain, where cells were still alive and thus capable of regulating the intracellular ions concentrations with the functioning Na-K-ATP pumps.
Figure 4. Simulation results of ion concentrations: top panels Nae and Nai; middle panels Ke and Ki; bottom panels Cle and Cli.
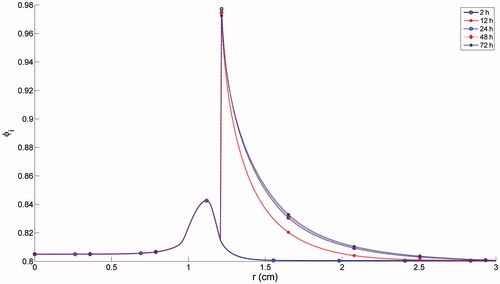
shows the spatial trend in φi (the intracellular volume fraction). φi increasing slightly until cells were completely killed, then staying at a constant level in the ablation zone (from the origin to r ≈ 1.2 cm). Beyond the ablation region, φi was regulated in accordance with the tempo-spatial distributions of intracellular/extracellular ion concentrations. It was shown that φi rises rapidly to a peak and then decays rapidly, generating a peripheral rim surrounding the ablation zone with a significant increase in φi. In the far region, only a minor increase in φi was found, with a time frame of days, due to the long timescale of ion diffusion.
Figure 5. Simulation result of volume fraction of intracellular space.
The influence of the parameters defining the temperature function, including the maximum temperature rise (ΔT), temporal and spatial ‘stretch’ (ts and rs) of the hyperbolic tangent temperature function upon the ablation volume and φi, are shown in . The radial width for which φi ≥90% ≥ 90% at t = 24 h t = 24h post-ablation (i.e. a 12.5% increase relative to the baseline level), denoted by r90%, was arbitrarily chosen to reflect the rim of cell swelling.
Figure 6. Dependence of the ablation volume and r90% upon variations in: (a) ΔT; (b) ts; and (c) rs.
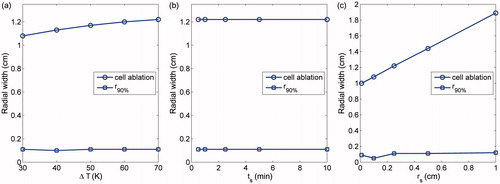
shows that the width of the ablation region increases slightly with increasing ΔT, while r90% shows only marginal variation with various values of ΔT (r90% being approximately 10% of the size of ablation zones here). It is shown in that neither the ablation volume nor r90% was dependent on ts. Although varying ts affects the rate of temperature rise from T0 to the peak (T0 + ΔT) by ‘squeezing’ or ‘stretching’ the temperature profile, thus delaying or advancing initiation of cell death, its effect was confined within the same heating zone from the origin up to r≈rc, resulting in an identical ablation volume. As shown in , the ablation volume increases with greater rs, which spatially stretches the temperature profile, rendering a broader region with temperature rise to certain extent. However, the rim of cell swelling seems to be of approximately constant width irrespective of rs except at rs = 0.1.
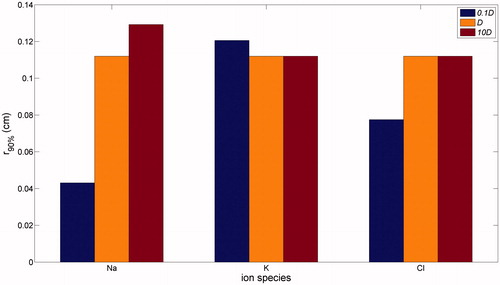
Presented in is the impact of ion diffusion coefficients on the rim width, which displays a non-trivial dependence on diffusion coefficient values when they are varied in the range from one tenth to ten times baseline values. When diffusivity was reduced by a factor of 10, a wider swelling rim was found for K+, while the rim was narrower for Na+ and Cl−, this effect being more significant for Na+. On the other hand, when diffusivity was increased 10-fold, the rim width was unchanged for changes in K+ and Cl−, while a slight increase was found for Na+. Overall, therefore, an increase in diffusivity of Na+ can lead to an increase in the rim width, while the rim width is essentially independent of the diffusivity of K+ and Cl− within a certain range.
Figure 7. Dependence of r90% upon ion diffusion coefficients.
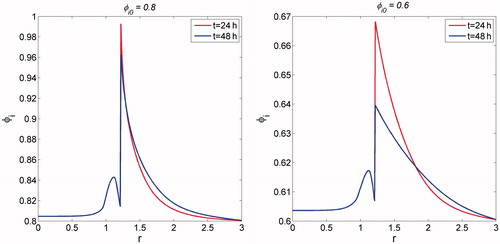
shows the spatial dependence of the intracellular cell volume fraction on various initial intracellular volume fractions. Given that the volume of a single cell is fixed, the effect of initial intracellular volume fraction is analogous to that of cell packing density. For the lower value of ∅i0, despite a significant increase in ∅i at the peripheral region, its intensity was somewhat weaker than that for the greater value of ∅i at 24 h. As time progressed, the intracellular volume fraction dropped quickly for φi, 0 = 0.6 = 0.6. This reflects the effect of cell packing density on ion diffusivity, which is inversely dependent on extracellular volume fraction (i.e. the increased intracellular volume fraction tends to block ion transport space).
Figure 8. Dependence of intracellular volume fraction on its initial level: (a) φi, 0 = 0.8; and (b) φi, 0 = 0.6.
Discussion and conclusions
In this study a novel mathematical model was developed to describe the enhanced rim on the periphery of the ablation region, which is ascribed to cellular oedema as a physiologically osmotic response. It captures the information flow, which is the redistribution of ions, initiated with ion exchange between intracellular and extracellular space locally perturbed by thermal injury, followed by global ion movement between the ablated region and its surrounding normal tissue, with cell swelling as a final consequence. As an initial effort, the mathematical model incorporates minimally essential elements in a spatially distributed system, namely components of (1) ion concentration dynamics, (2) cell volume regulation, (3) ion transport, and (4) thermal cell death. It should be noted this represents a proof-of-concept example to illustrate a potentially indirect response to thermal injury, thus supplementing evaluation of the ablation volume. Indeed, an analogous but more evident example is the immunogenic response post ablation, which has been indicated by a range of pre-clinical and clinical evidence [Citation20–23] and which is believed to be induced by release of inflammatory cytokines from the ablated tumour cells and subsequent infiltration, and thus is observed at the margin of the ablation region as well as in distant, untreated regions post-ablation (within a time frame ranging from hours to days).
Thermal cell death generates an ablation zone, distinguishing the tissue state from ‘alive’ to ‘dead’, which indicates that ion dynamics should be dependent on the tissue state. Continuous descriptions of ion dynamics were adopted in distinct regions from the ablation zone to the undamaged regions by assuming that the effect of ablation on ion dynamics is modelled by correlating cell viability with activity of the Na-K pumps, as it has been suggested that Na-K pumps stop functioning in the temperature range for ablation [Citation24]. Another likely biological response that could be proposed is cell membrane rupture; however, from a mathematical modelling point of view, this is computationally highly demanding due to its discontinuous nature. Were it to happen, extracellular ion concentrations would need to be corrected to account for all ions suddenly appearing in the extracellular volume; although this would be in a volume fraction averaged form, this would yield a sudden decrease in Nae and Cle and a sudden increase in Ke. The same changing trend in ion concentrations was qualitatively predicted by the continuous description used here.
The intracellular volume fraction was the target output of the model, and this was regulated in response to osmosis. Regarding the choices of ion species involved and their transport modes through ion channels, the model was formulated to have general and well-established descriptions of Na+, K+ and Cl−, to reflect a qualitative trend in intracellular volume fraction when subject to a disturbance of ion concentrations of all species upon thermal ablation. In addition, it was assumed that intracellular volume regulation was not limited due to neglecting the mechanical force exerted by the tumour extracellular matrix, which was composed of mainly collagen fibre bundles and proteoglycan filaments, thus providing resistance to large changes in the extracellular volume. Such aspects can be incorporated preliminarily by including a linear reaction term (representing the restoring force) [Citation16], which may weaken the extent of cell swelling; however, this is not likely to alter the qualitative trend. Furthermore, the impact of cell mechanics on cell volume regulation has not been taken into account in the current study. It is reported that changes in membrane tension tend to induce mechano-sensitive channels (passive membrane proteins) to open, through which ion transport is driven by the concentration gradient [Citation25]. Such aspects of the behaviour could be naturally included in the current model setting and will be examined in the future.
Ion transport in extracellular matrix is the only means to provide a spatial link to connect the locally dependent modelling components of ion dynamics and cell volume regulation in a spatially distributed system. In the current model, diffusion was assumed as the only mode of ion transport without accounting for the other transport modes via convection and migration. Despite this, it is still complex to understand the highly non-linear dependence of the rim width upon varying ion diffusion coefficients, as the change in the diffusion coefficient of individual ions can lead to changes in all ion concentrations simultaneously in a highly non-linear manner, which in turn work in concert to regulate the cell volume. However, there are several areas for potential refinement of ion transport. Firstly, though the interstitial fluid velocity has been found to be negligible in the tumour core region due to uniformly elevated interstitial fluid pressure in this region it cannot be so easily neglected in the tumour boundary [Citation26], where convection may overwhelm diffusion, driving outward ion movement from the ablation region to the periphery, thus affecting the spatio-temporal distribution of ions, and consequently the timescale and spatial extent of cell swelling.
In addition, when considering the tumour microenvironment as containing fixed interstitial proteins with negative charge (e.g. glycosaminoglycans) as well as potentially ‘ablation-enhanced’ diffusion, local built-in electric fields (self-fields) can be induced, which indicates that ion migration along voltage gradients should be included in further study. It would be of great importance to test our hypothesis and to further assess the timescale and extent of cell swelling, thus reaching a qualitatively solid conclusion of the occurrence of cell swelling and revealing any correlation between it and the ablation volume.
A mathematical model has been developed with essential descriptions of the minimally necessary components to capture cellular swelling at the margin of the ablation region after thermal treatments, providing a possible cause of the bright rim observed from imaging and a valuable link between the interpretation of the underlying physiological process and post-treatment imaging. In addition to the primary response to the thermal injury the model demonstrates a potential interaction between the ablated cells and the non-ablated cells. It is worth noting that one potential interaction that the upstream hyperthermic zone has is cell detachment in the downstream non-hyperthermic zone; this has been demonstrated in an in vitro microchannel [Citation27], which was illuminating within our context for experimental verification of cell swelling within a controllable experimental platform. Alongside experimental progress and advancing imaging techniques, the model could also be of great use in two ways: on one hand the model serves as a simulation platform and is capable of incorporating more detailed descriptions (i.e. ion transport), on the other hand it could be integrated into the already validated mathematical models for thermal therapies (e.g. a multi-scale model for radiofrequency ablation in liver tumours by Payne et al. [Citation28]), which provides both the outputs of the bio-heat model and of the cell death model with a known degree of confidence, thus allowing for the testing of predictions of the cell swelling rim in a more realistic scenario. In a clinical setting, the location of this bright rim could be of considerable potential use for determination of the extent of the ablation region.
Disclosure statement
The authors alone are responsible for the content and writing of the paper.
Funding
The research has been funded by the European Commission under [Grant Agreement No. 600641], FP7 Project Go-Smart.
References
- Chu KF, Dupuy DE, Thermal ablation of tumours: biological mechanisms and advances in therapy. Nat Rev Cancer 2014;14:199–208.
- Hildebrand P, Leibecke T, Kleemann M, Mirow L, Birth M, Bruch HP, Bürk C. Influence of operator experience in radiofrequency ablation of malignant liver tumours on treatment outcome. Eur J Surg Oncol 2006;32:430–4.
- Payne SJ, Peng T, O'Neill DP. Mathematical modeling of thermal ablation. Crit Rev Biomed Eng 2010;38:21–30.
- Pearce JA. Comparative analysis of mathematical models of cell death and thermal damage processes. Int J Hyperthermia 2013;29:262–80.
- Abtin FG, Eradat J, Gutierrez AJ, Lee C, Fishbein MC, Suh RD. Radiofrequency ablation of lung tumors: imaging features of the postablation zone. Radiogaphics 2012;32:947–69.
- Chheang S, Abtin F, Guteirrez A, Genshaft S, Suh R. Imaging features following thermal ablation of lung malignancies. Semin Intervent Radiol 2013;30:157–68.
- Park MH, Rhim H, Kim YS, Choi D, Lim HK, Lee WJ. Spectrum of CT findings after radiofrequency ablation of hepatic tumors. Radiographics 2008;28:379–90; discussion 390–2.
- Hoffmann R, Rempp H, Schraml C, Schwenzer N, Grözinger G, Blumenstock G, et al. Diffusion-weighted imaging during MR-guided radiofrequency ablation of hepatic malignancies: analysis of immediate pre- and post-ablative diffusion characteristics. Acta Radiol 2015;56:908–16.
- Kwan KG, Matsumoto ED. Radiofrequency ablation and cryoablation of renal tumours. Curr Oncol 2007;14:34–8.
- Liang D, Bhatta S, Gerzanich V, Simard JM. Cytotoxic edema: mechanisms of pathological cell swelling. Neurosurg Focus 2007;22:E2.
- O’Neill D, Peng T, Stiegler P, Mayrhauser U, Koestenbauer S, Tscheliessnigg K, Payne SJ. A three-state mathematical model of hyperthermic cell death. Ann Biomed Eng 2011;39:570–9.
- Orlowski P, O'Neill D, Grau V, Ventikos Y, Payne S. Modelling of the physiological response of the brain to ischaemic stroke. Interface Focus 2013;3:79.
- Dronne MA, Boissel JP, Grenier E. A mathematical model of ion movements in grey matter during a stroke. J Theor Biol 2006;240:599–615.
- Terashima K, Takeuchi A, Sarai N, Matsuoka S, Shim EB, Leem CH, Noma A. Modelling Cl- homeostasis and volume regulation of the cardiac cell. Philos Trans A Math Phys Eng Sci 2006;364:1245–65.
- Mori Y. Mathematical properties of pump-leak models of cell volume control and electrolyte balance. J Math Biol 2012;65:875–918.
- Yi C-S, Fogelson AL, Keener JP, Peskin CS. A mathematical study of volume shifts and ionic concentration changes during ischemia and hypoxia. J Theor Biol 2003;220:83–106.
- Georgiev G, Valova I, Gueorguieva N, Brady D. Simulating influence of channel kinetics and temperature on Hodgkin–Huxley threshold dynamics. Procedia Comput Sci 2014;36:464–9.
- Luo CH, Rudy Y. A model of the ventricular cardiac action potential. Depolarization, repolarization, and their interaction. Circ Res 1991;68:1501–26.
- O'Neill DP, Peng T, Payne SJ. The response of hepatocyte cell volume to hyperthermia and its role in oedema. Conf Proc IEEE Eng Med Biol Soc 2011;2011:4305–8.
- Haen SP, Pereira PL, Salih HR, Rammensee HG, Gouttefangeas C. More than just tumor destruction: immunomodulation by thermal ablation of cancer. Clin Dev Immunol 2011;2011:160250.
- Fietta AM, Morosini M, Passadore I, Cascina A, Draghi P, Dore R, et al. Systemic inflammatory response and downmodulation of peripheral CD25 + Foxp3+ T-regulatory cells in patients undergoing radiofrequency thermal ablation for lung cancer. Hum Immunol 2009;70:477–86.
- Ali MY, Grimm CF, Ritter M, Mohr L, Allgaier HP, Weth R, et al. Activation of dendritic cells by local ablation of hepatocellular carcinoma. J Hepatol 2005;43:817–22.
- Nikfarjam M, Muralidharan V, Christophi C. Mechanisms of focal heat destruction of liver tumors. J Surg Res 2005;127:208–23.
- Yang D. Measurements, antenna design and advanced computer modeling for microwave tissue ablation. Doctoral dissertation, Madison, University of Wisconsin; 2006.
- Jiang H, Sean X. Sun, cellular pressure and volume regulation and implications for cell mechanics. Biophys J 2013;105:609–19.
- Baxter LT, Jain RK. Transport of fluid and macromolecules in tumors. I. Role of interstitial pressure and convection. Microvasc Res 1989;37:77–104.
- Wang F, Li YH, Chen L, Chen DD, Wu XL, Wang H. Mapping of hyperthermic tumor cell death in a microchannel under unidirectional heating. Biomicrofluidics 2012;6:014120.
- Payne S, Flanagan R, Pollari M, Alhonnoro T, Bost C, O’Neill D, et al. Image-based multi-scale modelling and validation of radio-frequency ablation in liver tumours. Philos Trans A Math Phys Eng Sci 2011:369:4233–54.