
Abstract
Microwave thermal ablation (MTA) is a minimally invasive therapeutic technique aimed at destroying pathologic tissues through a very high temperature increase induced by the absorption of an electromagnetic field at microwave (MW) frequencies. Open problems, which are delaying MTA applications in clinical practice, are mainly linked to the extremely high temperatures, up to 120 °C, reached by the tissue close to the antenna applicator, as well as to the ability of foreseeing and controlling the shape and dimension of the thermally ablated area. Recent research was devoted to the characterisation of dielectric, thermal and physical properties of tissue looking at their changes with the increasing temperature, looking for possible developments of reliable, automatic and personalised treatment planning. In this paper, a review of the recently obtained results as well as new unpublished data will be presented and discussed.
Keywords:
1. Introduction
Microwave thermal ablation (MTA) is a minimally invasive therapeutic technique aimed at destroying pathologic tissues, such as tumours, by way of a very high and localised temperature increase induced by the absorption of an electromagnetic field at microwave (MW) frequencies. Thermal ablation is achieved when the temperature of the tissue reaches at least 55–60 °C: at these temperatures an almost instantaneous irreversible cellular damage occurs [Citation1,Citation2]. Potential therapeutic applications of MTA procedures are whenever unhealthy tissue should be destroyed, as in the case of cardiac arrhythmias [Citation3] or endometrial disorders [Citation4]; nevertheless, the most recent and widespread applications are the treatment of several types of tumours, for example, in the liver, lung, kidney, etc. [Citation5–8]. In MTA treatment of tumours, the goal of the therapy is to ablate the entire tumour volume plus a safety margin of healthy tissue, which for liver tumours is about 0.5–1.0 cm [Citation2].
MTA principles can be understood starting from hyperthermia, which is usually more commonly known, since both techniques are based on the absorption of an electromagnetic field to induce a temperature increase in the tissue. However, the goal of MTA is quite different from that of hyperthermia treatments, where temperatures of 40–45 °C should be kept in the target tissue for at least 60 min. Moreover, hyperthermia is usually applied in conjunction with radio and/or chemotherapy, because it makes cancer cells more sensitive to radiation, and harms cells that radiation cannot damage [Citation9]. Conversely, MTA lasts about 10–15 min and is a stand-alone technique, able to destroy tumours whose dimensions are about 5 cm [Citation10]. On the other hand, hyperthermia has been studied and developed for a longer time than MTA; therefore, some useful lessons can be learnt from it, as evidenced in this paper.
MTA clinical set-ups usually include a MW power generator, an interstitial antenna applicator and a cooling system. The clinical practice consists in positioning the antenna applicator in the centre of the tumour to be treated, usually through image-guided procedures, and in supplying it with a certain MW power for the time of choice. Accordingly, the treatment planning consists of defining the optimum position of the applicator, the MW power to be radiated by the antenna and the time of irradiation needed to cover all the target area.
Several devices are now on the market, some operating at 915 MHz (MicroThermX® BSD Medical, Salt Lake City, UT; Avercure™, MedWaves, Drive San Diego, CA) and others at 2.45 GHz (Certus® 140, NeuWave Medical, Madison, WI; Acculis MTA, AngioDynamics, Latham, NY; AMICA™, HS Hospital Service, Rome, Italy; Emprint™, Covidien/Medtronic, Minneapolis, MN) [Citation11–21]. The maximum MW power ranges from 32 W (AveCure™), 100 W (Emprint™) or 140 W (Certus®, Acculis, AMICA™) at a single antenna, to 60 W (MicroThermX®) at each of three antennas, or 195 W (Certus®) synchronous at three applicators. The MW antennas have different diameters, ranging from 11 to 17 gauge; most of them are equipped with an embedded temperature sensor and a cooling system to keep their temperature at a safe value. In Japan and China, multiple systems have been developed: most of them use 2.45-GHz generators with monopole, dipole or slotted coaxial antennas. Examples are the Forsea system (Qinghai Microwave Electronic Institute, Nanjing, China) and Kang-Yu Medical, Microtaze device (Nippon Shoji, Osaka, Japan). Recently, ex vivo efficacy of a novel 14.5-GHz MW system in creating rapid and reproducible ablation zones with a spherical shape was demonstrated [Citation22].
All the commercial devices available in the USA and European market have been tested and their clinical safety assessed as dictated by local regulatory guidelines. The manufacturing companies provide tables and literature references, recommending the most suitable power–time protocol to obtain the desired dimension of the thermal ablation zone in the different organs, based on ex vivo and/or in vivo evaluations. However, these data are not standardised, and commonly not accurately detailed; furthermore, the power indications usually concern the generator’s output and do not take into account the attenuation of the connecting cable, even if in some cases they refer to the value estimated at the antenna’s tip. Additionally, the devices’ displays show different data: the time elapsed or the time left, the set power or the power effectively supplied; in some cases other information is provided such as the delivered energy, the percentage of reflected power, the temperature measured from an embedded sensor and so on. In general, the user has limited possibility of intervention, supervision and control, and has to fully trust the device. Accordingly, the ultimate treatment planning is still left to the experience of the physician and to his knowledge of the apparatus in use [Citation23].
2. Framework
As cited above, MTA outcomes are critically linked to the capability of reaching at least 60 °C in the whole tumour region. Several factors can act against this goal, as the presence of big blood vessels or the location of the tumour, for example, close to critical organs that should be preserved from high temperature increases. Hyperthermia faces similar difficulties in keeping the target temperature in the treatment area for the duration of the procedure. Recently, it was shown that real-time optimisation of the hyperthermia treatment avoids hot spots in healthy tissues and thus helps maintain the optimal thermal dose (i.e. 43 °C for 60 min) improving clinical outcomes [Citation9]. Accordingly, in hyperthermia the most recent developments are mainly related to treatment planning and real-time optimisation. It is worth noticing here that personalised treatment planning is already in routine clinical use in ionising radiation therapy, and is the aim of recent developments in other thermal ablation applications as well; examples are cryoablation (e.g. [Citation24,Citation25]), laser therapies (e.g. [Citation26]) and radiofrequency ablation (e.g. [Citation27]).
Following hyperthermia experience, the idea of developing an automatic and personalised treatment plan in MTA is straightforward. Simpler than hyperthermia, real-time MTA treatment optimisation is not required: the very short procedure does not actually need adjustments of the radiated power. Conversely, a pre-clinical study performed on the actual patient anatomy and a real-time temperature monitoring system, to stop power supply in case of temperature increase in critical organs or structures (e.g. blood vessels), are certainly needed to help obtain reproducible and repeatable results, as well as to improve MTA reliability.
Treatment planning workflow should consist of at least three steps:
development of an anatomical model of the patient anatomy;
evaluation, through numerical simulations, of the optimum clinical protocol in terms of antenna location, power to be radiated and duration of the treatment;
real-time monitoring of the procedure, both in terms of antenna positioning and temperature monitoring.
While the development of the anatomical model of the patient does not seem a critical issue, only requiring the knowledge of the position of the tumour and a few centimetres of surrounding tissue, higher difficulties arise from both numerical simulations and temperature real-time monitoring. The latter two issues will be considered in detail in the following paragraphs.
3. State of the art in MWA treatment planning
Actual clinical protocols are built over a great number of experiments performed either ex vivo or in vivo on animal models. The corresponding data are usually reported in tables or graphs relating thermally ablated area dimensions with MW power and time. To the authors’ knowledge, the most advanced tool for procedure planning is a tool presented by Medtronic, which helps to define the best introduction path for the applicator considering the target location into the actual anatomy of the patient (http://www.medtronic.com/covidien/products/ablation-systems/emprint-ablation-system). However, to define the power and the time settings to be used in the procedure, the software does not solve the electromagnetic and thermal problems, but simply overlaps previously evaluated dimensions of the thermally ablated area on the patient’s anatomy. On the other hand, several factors influence MWA outcomes, such as type and dimension of the antenna applicators, frequency of operation, location of the applicator in the human anatomy and the characteristics of the target tissue (both related to different tissues and different conditions, i.e. ex vivo, in vivo animals and patients). If these factors are not accurately known, the developed clinical protocol could be misinterpreted and used incorrectly.
Table A1, reported in the Appendix, shows data obtained from recently published papers which gave measurements of the dimensions of the thermally ablated area in terms of long-axis length (LA) and short-axis length (SA) as defined in .
Figure 1. Appearance of the thermally ablated area after a microwave thermal ablation (MTA) procedure performed in ex vivo bovine liver.
From the data in Table A1, some considerations can be drawn regarding the different aspects affecting MTA outcomes, as reported in the following sections.
3.1. Antenna design
The influence of antenna design on MTA outcomes can be evidenced by comparing performances obtained by different applicators using the same experimental protocol on similar targets (i.e. ex vivo porcine or bovine liver). In Table A1, the most frequent protocol is made by a power of 50 W, at 2.45 GHz, radiated for 10 min in ex vivo liver. In [Citation28], a dual-slot antenna produced more spherical ablation zones (LA: 4.92 ± 0.21 cm; SA: 3.47 ± 0.24 cm), with respect to a monopole one (LA: 5.96 ± 0.63 cm; SA: 3.11 ± 0.21 cm). However, more recently, the same research group obtained an opposite result comparing the performances of a 17-gauge cooled dual-slot antenna (LA: 5.14 ± 0.64 cm; SA: 3.01 ± 0.29 cm) with those of a 17-gauge cooled monopole antenna (LA: 4.71 ± 0.51 cm; SA: 3.02 ± 0.16 cm) by employing the same ablation protocol on ex vivo bovine liver [Citation29]. In particular, it can be noted that, thanks to the new antenna design, the length of the thermally ablated area obtained by the dual-slot antenna slightly increased (5.14 ± 0.64 cm vs. 4.92 ± 0.21 cm), whereas it greatly decreased in the monopole case (5.96 ± 0.63 cm vs. 4.71 ± 0.51 cm) [Citation28,Citation29]. An even shorter length of the thermally ablated area with respect to the previously cited studies was obtained in ex vivo porcine liver (3.57 ± 0.30 cm) using a 15-gauge cooled-shaft antenna, while no significant difference was obtained in the SA (2.78 ± 0.16 cm) [Citation30]. Similar dimensions were obtained with a 1.9-mm-diameter antenna in ex vivo porcine liver (LA: 3.64 ± 0.15 cm; SA: 2.64 ± 0.11 cm) using the same experimental protocol [Citation31].
Other studies can be compared considering a delivered power of 40 W at 2.45 GHz for 10 min in ex vivo bovine and porcine liver. In [Citation32], a 14-gauge cooled coaxial asymmetric dipole antenna was used: a thermally ablated area with a LA of 4.33 ± 0.18 cm and a SA of 3.63 ± 0.08 cm was obtained, whereas a smaller ablated zone (LA: 3.57 ± 0.06 cm; SA: 2.73 ± 0.15 cm) was reported in [Citation33] using a 2-mm-diameter cooled-shaft antenna. It is interesting here to note that the SA length reported delivering 40 W for 10 min is analogous to the data obtained using 50 W for 10 min. With reference to this point, when comparing different studies, the way in which the MW power is reported should be considered; in fact, at MW frequencies the feeding cable, which connects the MW power generator to the antenna, introduces losses in the propagating electromagnetic field. These losses can be as high as 50% of the power available at the generator, depending on the length of the line. Accordingly, the net MW power radiated by the antenna can greatly differ if the power delivered to the applicator is measured at the output of the power generator or at the antenna feeding connector. This information should be standardised in future studies, by introducing at least information about cable losses.
The applicator cooling system’s influence on the ablated zone was investigated in [Citation34,Citation35]. Both studies reported larger thermally ablated areas using cooled antennas. In particular, in [Citation34] experiments were conducted at 2.45 GHz on both ex vivo porcine liver and in vivo canine liver by considering different ablation protocols and using 14-gauge antennas both un-cooled and cooled. Results showed that the cooled antenna was able to minimise heating along the antenna shaft and reduce tissue charring. Moreover, the cooled antenna created larger and more spherical ablated zones in liver tumours, due to a shorter LA and a longer SA with respect to the un-cooled antenna.
3.2. Microwave settings
A further parameter studied in relation to treatment planning is the possibility of delivering the MW power as a continuous wave (CW) or a pulsed one [Citation36,Citation37]. In radiofrequency (RF) ablation, pulsed protocols are usually used for single electrode procedures to avoid tissue charring close to the RF electrode, which would lead to an increase of the tissue impedance and a consequent reduction of the conduction current transferred from the electrode to the tissue. This phenomenon is not present in MW ablation, thanks to the ability of the electromagnetic field to propagate both in dissipative as well as in non-dissipative media. However, pulsed protocols could influence the thermal conduction and consequently the thermally ablated area, particularly when several antennas are introduced at the same time into the target tissue. In [Citation36], experiments were conducted in both ex vivo and in vivo bovine liver using different CW as well as pulsed protocols with a single antenna applicator. In the ex vivo experiments, results showed no significant differences in size or roundness of the ablated zone, while differences were obtained in the in vivo cases despite equivalent energy delivered. In particular, the pulsed protocol obtained greater ablated area than the CW one: this led to the conclusion that, in the presence of blood perfusion, pulsed energy delivery can generate larger ablation zones at low average powers compared to continuous energy delivery. In [Citation37], ex vivo experiments on swine loin were carried out employing a dual applicator MTA system operating at 2.45 GHz and using three different feeding techniques: synchronous mode, asynchronous mode and switched mode. The outcomes of the study suggested that the three feeding modalities were substantially equivalent in terms of ablative performance, thus confirming the ex vivo results of [Citation36]. However, due to the counterintuitive in vivo results [Citation36], these experiments are worth replicating.
With reference to the MW settings of the thermal ablation system, a further parameter to be considered is the frequency. As a general rule, the higher the frequency the lower the penetration depth of the electromagnetic field into the tissue. However, it should not be forgotten that in MTA the interaction between the electromagnetic field and biological tissues occurs mostly in the near field of the antenna applicators, therefore far-field concepts, as penetration depth, should be applied with great care. Looking at the data in Table A1, an ablated area with a longer LA and a shorter SA is obtained at 915 MHz with respect to that at 2.45 GHz, using an asymmetrical coaxial dipole antenna radiating 30 W in ex vivo porcine muscle [Citation38]. The difference on the LA is clearly linked to the greater length of the 915 MHz dipole antenna with respect to the 2.45 GHz one, so that if the radial extension of the ablated area and its sphericalness are taken into account, the higher frequency behaves better than the lower one. The same was obtained in porcine liver, both ex vivo and in vivo, using a 15-gauge cooled antenna radiating 60 W for 10 min [Citation39]. This result can be explained looking at the near field of dipole antennas [Citation40]. As an example, shows, on the horizontal plane, the electric field generated by a Hertzian dipole in liver tissue at different distances from the dipole and at different frequencies. The field values were normalised at the values obtained at 1 mm distance from the dipole. From the figure it is evident that, close to the elemental dipole, higher field values are obtained at higher frequencies, due to the near field structure of the electric field; as an example, a Hertzian dipole working at 2.45 GHz gives a higher field value than at 915 MHz up to about 7 cm from the antenna. This leads to comparable dimensions of the thermally ablated area as well as faster heating times [Citation38]. The same results were obtained comparing MTA outcomes at 1.9 GHz with those achieved at 10 GHz [Citation41].
Figure 2. Electric field radiated on the horizontal plane by a Hertzian dipole, working at different frequencies, in liver tissue. The electric field values were normalised at the values at 1 mm distance from the antenna.
3.3. Ex vivo vs. in vivo and geometry of thetarget tissue
Some studies were dedicated to the evaluation of the influence of blood perfusion, looking at the differences between ex vivo and in vivo experiments, with outcomes often conflicting. In [Citation35], no statistically significant differences were found in the ablated area induced by a 14-gauge 2.45-GHz antenna delivering 80 W for 5 min in ex vivo bovine liver and in vivo porcine livers. Similar results were described in [Citation39], by using a 15-gauge 2.45-GHz cooled antenna delivering 60 W for 10 min in porcine liver. On the other hand, other studies evidenced statistical differences between ex vivo and in vivo experiments. In [Citation31], SA was significantly smaller in in vivo porcine liver than in ex vivo porcine liver. A smaller ablated area in vivo with respect to the ex vivo case was also obtained in [Citation42]. Here, MTA experiments on in vivo and ex vivo porcine liver were performed delivering different power–time settings to a 14-gauge 2.45-GHz cooled-shaft antenna. As an example of the obtained results, 80 W for 25 min produced an ablation zone whose LA was 7.4 ± 0.5 cm ex vivo and 5.9 ± 0.3 cm in vivo, and whose SA was 5.6 ± 0.1 cm ex vivo and 3.5 ± 0.3 cm in vivo, respectively. In the same study, the results of a clinical trial conducted on 90 patients with liver cancer were reported. With the power–time settings fixed at 80 W for 25 min, a LA of 5.0 ± 0.7 cm and a SA of 3.6 ± 0.4 cm were measured, very close to the in vivo animal data.
In [Citation16], MTA procedures were conducted at 2.45 GHz in ex vivo bovine liver and in vivo porcine liver. Approximately the same power (135 W ex vivo, 140 W in vivo) was delivered by a 17-gauge gas-cooled antenna for different times: the ablation zone sizes were similar in the first few minutes, but as time progressed the in vivo ablation zones did not continue to grow as much as the ex vivo ones. The authors offered a possible explanation that the ablation zone expansion was counteracted by blood perfusion at the ablation zone boundary. This point is in agreement with previous data on porcine liver showing that the thermally ablated area was greater in vivo than ex vivo for high power values (100 and 150 W) and short irradiation times (up to 8 min) [Citation10]. In that work the greatest variation was seen at the highest power setting, 150 W, where at 8 min duration, the in vivo ablation SA was 5.7 ± 0.2 cm, significantly greater than the in vivo one (4.9 ± 0.2 cm). After 8 min, the in vivo ablated zone ceased to grow, while the ex vivo one continued expanding [Citation10].
A further consideration reported in [Citation16] to explain the obtained results is related to the dimensions of the ex vivo and in vivo targets, because the porcine hepatic lobes were somewhat thinner than those of bovine livers. Accordingly, some of the in vivo MW ablations were constrained by the tissue surface, especially at longer time points. With respect to this last consideration, in [Citation43] a 7.5% increase in the LA was experimentally observed when the height of the target tissue was smaller than the SA measured in unrestricted samples; when both the height and width of the sample were smaller than the SA measured in unrestricted samples, an elongation of about 23.4% was obtained. Accordingly, it can be stated that performances of MW ablation devices are notably influenced by the shape and dimension of the tissues undergoing the procedure.
New experimental results are hereinafter presented in order to gain further insight into the role played by size and surface characteristics of the target tissue. MTA experiments (60 W, 10 min) were carried out on ex vivo porcine liver specimens, whose height was smaller than the achievable SA length, both incorporating the lobe capsule (six trials, specimens with a mean thickness of 21 mm, range 16–28 mm), as well as removing it prior to the trial (six trials, specimens with a mean thickness of 19 mm, range 14–24 mm). The experimental set-up consisted of a 2.45-GHz MW power generator (HS AMICA-GEN, HS Hospital Service S.p.A., Rome, Italy) supplying a 14-gauge coaxial dipole antenna applicator (HS AMICA PROBE, HS Hospital Service S.p.A., Rome, Italy). The dimensions (LA and SA) of the thermally coagulated zone as well as of the central carbonised region () were measured by visual inspection with a ruler (accuracy ±0.5 mm) at the end of the MTA procedures, after sectioning the specimens along the plane aligned with the antenna axis and orthogonally to the plane reported in .
Figure 3. Thin sample of ex vivo porcine liver before (a) and after (b) a microwave thermal ablation (MTA) procedure.
Measured data were compared with data achieved from MTA experiments (60 W, 10 min) performed with the same set-up on ex vivo unrestricted liver specimens (“bulky” samples). A comparative statistical analysis was accomplished by Wilcoxon rank sum test, assuming a 5% significance level (p < 0.05); results are reported in .
Table 1. Comparative statistical analysis among microwave thermal ablation (MTA) experiments accounting for target tissue in terms of size and surface characteristics.
In , both the long-axis lengths of the ablated and of the central carbonised regions (LA and LAc, respectively), as well as the short-axis lengths (SA and SAc) are shown; statistically significant differences are reported in bold characters. Some considerations can be drawn from these data. The first is related to the SA lengths measured in thin samples, with and without the capsule, which are greater than the average height of the considered samples. This can be explained by tissue expansion occurring close to the antenna’s active tip during the procedure, as shown in . Comparing the different experimental conditions, the elongation of the central carbonised region (LAc) obtained in the cases with the capsule with respect to those without the capsule could be possibly accounted for by a limiting action of the lobe capsule on the thermal exchange with the surrounding environment. The same mechanism could explain the LA elongation observed in experiments on tissue specimens with the capsule with respect to experiments in bulky samples. Finally, the smaller SA length observed in the no-capsule experiments with respect to the unrestricted ones could be due to the smaller height of the samples under test and to an increased heat exchange along the vertical direction in the absence of the capsule. Further investigations should be carried out to gain further insight into this issue and its influence on MTA outcomes.
3.4. Final considerations
Besides evidencing the several factors influencing MTA outcomes, from the above reported review of experimental data it is possible to identify several aspects that should be further investigated, due to conflicting results obtained by the previous studies. However, to make the new studies effective, attention should be paid to all aspects of the MTA procedure, and all parameters and variables should be monitored and reported in the study in a standardised and reviewable way.
4. Numerical models
Numerical models solve Maxwell’s equations to find the electromagnetic field distribution into the tissue starting from the model of the antenna and of the anatomy where the antenna is located. The electromagnetic field distribution is directly linked to the power absorbed in the tissue, which in turn causes the temperature increase. The temperature increase is numerically obtained solving the so-called thermal problem, which considers all the mechanisms of heat deposition and dissipation into the tissue and which is usually represented by Pennes’ bio-heat equation (BHE) [Citation44]. In MTA, Pennes’ BHE is able to give reliable results, in particular when the temperature is calculated away from big vessels, as proved by several studies that compared numerical with experimental data (e.g. [Citation45–48]). Nevertheless, some researchers used a modified BHE according to a porous media approach, in which the tissue is divided into a solid matrix, representing the cells, and a liquid phase flowing in the interspace [Citation49,Citation50]. Other studies, particularly those linked to hyperthermia procedures, included the presence of discrete vasculature models [Citation51]. As an example, in [Citation52], the temperature increases obtained simulating a hyperthermia treatment of the prostate including a detailed model of the patient’s vessel tree were compared with those obtained from the classical Pennes’ equation, that is, considering a homogeneous perfusion of the organ. The vessel tree was obtained from a computed tomography (CT) angiogram, recognising blood vessels down to 1 mm diameter. The comparison showed differences in the evaluated temperature increases of 1–2 °C [Citation52]: while this difference is fundamental in hyperthermia studies, it is not significant in MTA. It can be noted here that the very high temperatures reached close to the radiating antenna in a small amount of time make MTA less influenced by the presence of blood vessels with respect to hyperthermia or RF (e.g. [Citation53]). As an example, in [Citation54] it was experimentally shown that a MTA procedure at 68 W was able to coagulate a blood vessel as big as 5 mm ×9 mm in in vivo porcine liver. However, the presence of blood vessels in the treated area influences the obtained temperature distribution depending on both vessel dimension and blood flow velocity: a thorough study of the effect of these two parameters on the achievable temperature increase in MTA procedures would be required.
Both Maxwell’s equations and BHE can be solved by way of different numerical methods; the methods most frequently used in MTA are the finite difference time domain (FDTD) method and the finite element method (FEM) [Citation55]. In both cases, the knowledge of the dielectric and thermal properties of the tissues is essential in finding a valid solution to the problem. In particular, a fundamental aspect of MTA numerical studies is linked to the very high temperatures obtained in the tissue close to the radiating antenna (up to 120 °C [Citation56]): these values cause a change in the dielectric and thermal properties, which cannot be ignored in the numerical studies. However, few studies have been concerned with this aspect and even fewer considered its influence on the numerical results, even if it is worth noting here that an increasing amount of research has been focused on this topic in the last few years.
4.1. Dependence of dielectric and thermal properties on the temperature
Several studies in the literature report measurements of dielectric properties of tissues at several frequencies, performed ex vivo on freshly excised tissue or in vivo on accessible parts of the body [Citation57–64]. Recent studies looked at differences in dielectric properties between normal and cancerous tissue, with particular reference to liver tissue, finding higher values for both relative permittivity and electric conductivity of pathologic tissue with respect to healthy liver [Citation63,Citation64]. In particular, Peyman et al. [Citation64] found no statistically significant differences in the dielectric properties in samples of normal liver tissue obtained from different patients, while they found lower values for liver with steatosis and higher values for cirrhotic liver. At the same time, liver tumour showed significantly higher dielectric properties with respect to healthy liver. It must be noted however that while in [Citation64] no significant differences were found between ex vivo and in vivo data, as could be expected in the MW range [Citation65], in [Citation63] higher values were measured in vivo with respect to the ex vivo condition. This point needs to be investigated further in order to clarify if the great body of ex vivo measurements can be considered representative of the in vivo case or not.
Most literature studies concern tissues at room or body temperatures, while those looking at the influence of the temperature usually focused on a limited interval, thus neglecting phenomena occurring at the very high temperatures reached during thermal ablation treatments. The studies conducted at 915 MHz found a linear dependence of the dielectric parameters on the temperature with a negative trend for dielectric permittivity and a positive one for electric conductivity [Citation66–70]. Lazebnik et al. [Citation70] measured the dielectric parameters as a function of the temperature (from room temperature to about 60 °C) in the 0.5–20 GHz band; they found a consistent linear decrease of the dielectric permittivity with the temperature, whereas the electric conductivity showed an increasing trend for lower frequencies and a decreasing trend for higher ones, with the cross-over point located near 2.45 GHz. More recently, studies were conducted during MTA procedures in ex vivo bovine liver, thus reaching very high temperature values [Citation56,Citation71–73]. In [Citation71], the dielectric properties were characterised at both 915 MHz and 2.45 GHz: a decrease of dielectric permittivity with increasing temperature was found at both frequencies; whereas the electric conductivity showed a different behaviour. In particular, the conductivity decreased for increasing temperatures at 2.45 GHz, whereas at 915 MHz exhibited an increasing trend up to about 90 °C, followed by a steep decrease for higher temperature values, thus confirming the presence of a cross-over point as pointed out by Lazebnik et al. [Citation70]. This result was confirmed later [Citation72,Citation73].
With reference to thermal properties, studies were devoted to the measurement of the temperature dependence of specific heat and thermal conductivity up to temperatures of about 80–90 °C, while almost no data exists on blood perfusion changes with the temperature in the ablative range of temperature. In MTA procedures, close to the radiating antenna, the temperature increases very fast so that blood vessels coagulate almost immediately. However, it would be interesting to study blood perfusion changes in the periphery of the thermally ablated area, where temperatures lower than about 50–60 °C are obtained, to determine eventual influence on the shape and dimension of the obtained necrosis. Studies devoted to the characterisation of blood perfusion changes linked to hyperthermia where mostly devoted to the tumour environment and found varying results for different tumour types [Citation74]. Few studies considered normal tissue, which is the one that should be of interest at hyperthermic temperatures in MTA procedures, finding that blood flow increases in response to the increasing temperature up to about 43 °C and then starts decreasing and finally collapses [Citation75–78]. In particular, Sturesson et al. [Citation77] measured blood flow in liver parenchyma kept at 41 or 44 °C for 30 min during a laser heat treatment: at the lowest temperature blood flow started increasing after 2–16 min from the beginning of the treatment, at the highest temperature it decreased throughout the procedure.
The thermal conductivity showed an increasing linear dependence from the temperature up to about 90 °C [Citation79–81]. However, different percentage increases were measured, the lowest being a 5% increase from 25 to 80 °C for human liver [Citation81], the highest being 45% from 35 to 90 °C for porcine liver [Citation80]. While measurements up to 80 °C showed a reversible behaviour [Citation79,Citation81], measurements up to 90 °C were irreversible, that is, the highest measured value was mostly maintained also when the tissue was allowed to cool down [Citation79,Citation80].
To measure specific heat, two routes were followed by experimental studies: the first measured it directly, usually determining the thermal conductivity at the same time; in the second case the water content of the tissue was measured during a heating procedure [Citation82,Citation83], and then related to the specific heat. This latter approach places emphasis on the decreasing trend of water content during MTA procedures, due to water vaporisation at temperatures close to 100 °C. Most of the studies that measured the specific heat directly were concerned with temperatures up to about 45 °C, very low with respect to those encountered in MTA [Citation74]. The few studies which considered temperatures up to about 80–90 °C measured a linear increase with temperature, with a percentage increase of about 17% [Citation80,Citation84]; the highest measured value was maintained during cooling down to room temperatures [Citation80]. However, the specific heat value is critically linked to the tissue water content [Citation84,Citation85], so that there is a need for a greater number of studies performed in the experimental conditions typical of MTA.
4.2. Shrinkage of the ablated tissue
Recently, it was experimentally demonstrated that a tissue undergoing ablative temperatures shrinks, that is, at the end of the thermal procedure its dimensions are smaller than the initial ones [Citation86–88]. Preliminary studies were performed introducing polytetrafluoroethylene (PTFE) tubes in bovine liver and lung, looking at their deformation at the end of a thermal ablation procedure performed either at MW or at RF [Citation86]. In liver, the contraction along the direction orthogonal to the active device was about 30% for MW ablation and about 15% for RF. It is worth noting here that MW provokes higher temperatures in the tissue with respect to RF. Compatible results were obtained in the kidney, measuring volume reduction after the procedure by way of the water displacement technique; moreover, it was confirmed that the higher the deployed energy, the higher the measured contraction [Citation87]. Experiments that heated porcine liver evenly for 15 min at different temperatures between 60 and 95 °C showed a shrinkage between 12%, obtained at 60 °C, and 22%, at 95 °C [Citation88], with the most significant contraction occurring in the first 2 min of heating [Citation86,Citation88].
Tissue contraction means that the dimensions of the ablated tissue evaluated immediately after the procedure, e.g. by way of CT images, underestimate the actual treated tissue. Such an underestimation could lead to inaccurate conclusions about the achievement of the goal of the procedure, and in a worst-case scenario could motivate an unnecessary second treatment. For this reason, it is very important to evaluate tissue shrinkage correctly and quantitatively in the different clinical conditions. To this end, CT could be very useful: in [Citation89], CT images were used to show tissue movements during a MTA procedure still using PTFE tubes to evidence tissue contraction. New set-ups foresee the use of lead markers, easily locatable in the CT images, to try following tissue movements during MTA [Citation90,Citation91].
A different approach was to measure tissue shrinkage using small specimens of bovine liver cut in cuboidal shapes: cuboid dimensions were measured before and after the thermal procedure thus allowing a precise evaluation of tissue contraction [Citation92]. Results comparable to those previously reported, such as the increasing shrinkage for increasing temperatures, were found. Additionally, using cubes of different dimensions allowed evidencing that the contraction of carbonised tissue stopped as soon as the carbonised state was reached, and that the tissue shrinkage is non-symmetric in the parallel and orthogonal directions with respect to the MW antenna axis.
It must be noted here that monitoring the tissue during MTA with CT images evidences an expansion of the tissue in the first few minutes of the ablation [Citation89,Citation92]. In [Citation92], CT images were taken during MTA experiments performed on cuboid specimens. The images showed that tissue expansion occurs within the first 3 min of the treatment, prior to the contraction phenomenon, and allowed tissue expansion to be linked to the presence of gasses. These are generated by water vaporisation, and tend to move from the hottest points, close to the radiating antenna, towards colder ones farther from it.
4.3. Numerical studies
Many numerical studies were performed on MTA. Most of them were devoted to the design and characterisation of new MW antenna applicators (reviews in [Citation93,Citation94]; other more recent examples are in [Citation38,Citation95–97]), evaluating antenna performance in terms of antenna matching and shape as well as dimension of the thermally ablated area. Recently, the importance of introducing the temperature dependence of dielectric and thermal properties into numerical simulations was put into evidence [Citation98–100]; however, only a few studies considered measured values for representing this kind of dependence [Citation32,Citation72,Citation83].
In [Citation83], the specific heat temperature dependence was introduced modelling the tissue’s water content, which in turn was linked to the temperature reached by the tissue itself [Citation82]. Moreover, in the same work it was argued that the water vapour generated by water vaporisation condenses at points far from the antenna, introducing a new heat source term into the model. Comparison of simulation results with measurements performed during a MTA procedure with 75 W radiated for 180 s showed a good agreement; however, close to the radiating antenna (2.5 and 4.5 mm) simulations obtained very high temperature values after 50 and 140 s, respectively, with respect to the measured values.
Ji and Brace [Citation72] introduced into the numerical model the temperature dependence of the dielectric properties according to a sigmoid function, which fitted measured data. By comparing simulations with experiments performed radiating 50 W for 5 min, a good agreement was obtained for the evaluated temperature increases close to the radiating antenna, while lower values were obtained by simulations farther from the antenna surface.
Cavagnaro et al. [Citation32] performed a deep analysis on the influence of dielectric properties and specific heat dependence on the temperature by comparing temperature increases measured during MTA procedures with simulations performed introducing the temperature dependence of each parameter separately and all together. The dependence of dielectric properties was obtained both from values measured by the same research group [Citation56,Citation73] and from published data [Citation72]. The two models differ from the values measured at the highest temperatures with significantly lower values reported in [Citation72] with respect to [Citation56]. The specific heat dependence was derived from [Citation83]. No temperature dependence was considered for the thermal conductivity due to lack of experimental data related to MTA. Experiments were conducted for 10 min for increasing values of the radiated power (5, 10, 15, 20 and 40 W) in order to put into evidence the onset of the different phenomena.
To push the study further, in the following the numerical models with the temperature-dependent dielectric and thermal properties are tested for an ex vivo MTA procedure performed at the frequency of 2.45 GHz with a power of 60 W delivered for 10 min. shows a sketch of the experimental set-up.
Figure 4. Ex vivo experimental set-up for temperature measurements during microwave thermal ablation (MTA) procedures.
A plastic box (120 × 100 × 100 cm3), substantially transparent to the MW field, was used to confine the tissue; holes were made in the box walls to facilitate and guide the insertion of the MW antenna and of the temperature sensors. The considered antenna (HS AMICA PROBE, HS Hospital Service S.p.A., Rome, Italy) was an asymmetric coaxial dipole with a mini-choke [Citation95]. The antenna is equipped with an internal cooling system: water circulates from a bath at environmental temperature (about 18 °C) into the antenna up to the choke section, with a constant velocity (40 ml/min) led by a peristaltic pump. The antenna was supplied with a CW signal at 2.45 GHz from a MW power generator (HS AMICA-GEN, HS Hospital Service S.p.A., Rome, Italy). A two-channel power meter (Agilent E4419B, Agilent Technologies Inc., Santa Clara, CA) was used for monitoring, through a dual-coaxial directional coupler (Narda 3022, Narda Microwave – East, Hauppauge, NY), the power supplied to and reflected by the MW ablation antenna. Temperatures were monitored by a four-channel fibre-optic thermometer (Fotemp FTC-0038, Optocon AG, Dresden, Germany – measurement accuracy ±0.5 °C) positioned in correspondence to the antenna feed point (i.e. at about 10 mm from the antenna tip), at the nominal distances of about 5, 10, 20 and 30 mm from the antenna surface.
Three ablation experiments were performed on ex vivo samples of bovine liver. Temperature measurements at the point closest to the antenna surface (5 mm) were performed only in the first experiment: as the fibre-optic temperature sensor was positioned very close to the antenna, temperatures higher than 100 °C were reached causing tissue charring and thus making it very difficult to remove the sensor at the end of the procedure. Therefore, to prevent a possible risk of damage, in the other two experiments no sensor was placed at 5 mm from the antenna, while two sensors were located at a distance of 10 mm, in symmetric positions with respect to the antenna axis. Software, purposely developed in Labview™ and running on a laptop computer, managed the whole MTA session, and automatically stored measured data. At the end of each ablation trial, the tissue sample was sectioned along the insertion plane of the MW antenna, thus exposing the thermally ablated area for visual inspection and measurement of its dimensions (LA and SA).
In the simulations, an initial temperature of 22.1 °C was assigned to the tissue sample, corresponding to the average temperature measured by the fibre-optic temperature sensors at the beginning of the experimental trials. Simulations were performed through different numerical codes to introduce the temperature dependence of dielectric properties and specific heat one at a time, and then to combine them. In this way the contribution of the different parameters could be evidenced. In particular the following were considered:
The standard BHE (BHE-S).
BHE with a model of water vaporisation derived from [Citation81], which leads to a specific heat dependent on the temperature (BHE-V).
BHE including the temperature dependence of the electric conductivity, introduced as a heat source term related to the temperature according to the two models ([Citation72]: BHE-ST_B; [Citation56]: BHE-ST).
BHE with a model of water vaporisation and including the dependence of the electric conductivity on the temperature according to the two models ([Citation72]: BHE-V-ST_B; [Citation56]: BHE-V-ST).
Dynamic solution of Maxwell’s equations and BHE, including the model of water vaporisation and the dependence of the dielectric permittivity and electric conductivity on the temperature; the dielectric parameters were updated every minute, according to the two models ([Citation72]: SAR-T-1min_B; [Citation56]: SAR-T-1min).
show the comparison between measurements and simulations of the temperature increments as a function of time over the MTA procedure, for the different distances from the antenna surface. In particular, refers to the distance of 5 mm from the antenna (one experimental data), to 10 mm (five experimental data), to 20 mm (three experimental data) and to 30 mm (three experimental data). In , since the experimental trials were sufficient to evaluate a standard deviation, measurements are reported as mean value (black line) with error bars (light grey) to evidence the experimental standard deviation. In the other figures, as the number of experimental data is limited, all measurements are reported.
Figure 5. Temperature increments as a function of time (60 W radiated for 10 min) at 5 mm from the antenna surface.
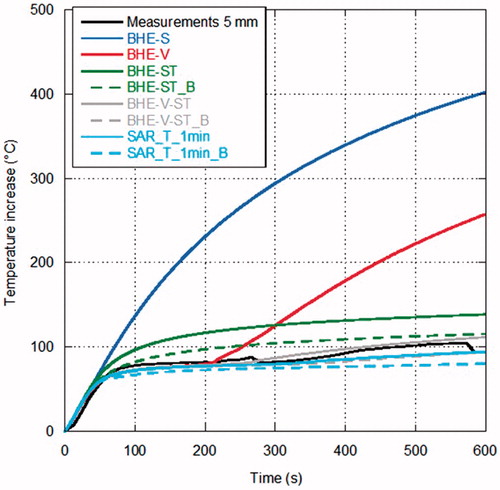
Figure 6. Temperature increments as a function of time (60 W radiated for 10 min) at 10 mm from the antenna surface.
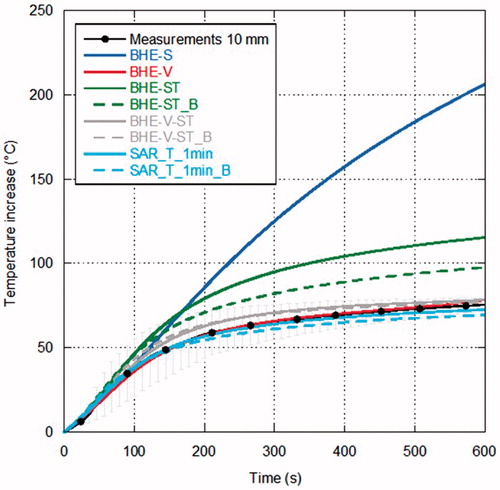
Figure 7. Temperature increments as a function of time (60 W radiated for 10 min) at 20 mm from the antenna surface.
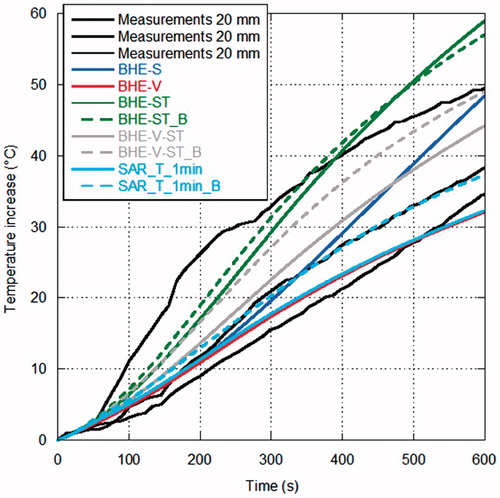
Figure 8. Temperature increments as a function of time (60 W radiated for 10 min) at 30 mm from the antenna surface.
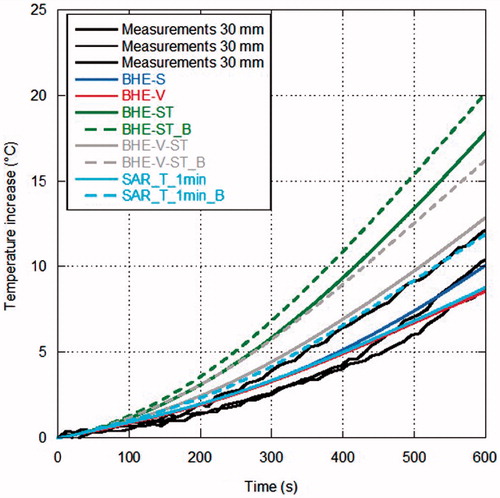
Looking at the measurements, some considerations can be drawn. In the points closer to the MW antenna ( and ) the temperature increases almost linearly during the first minutes of treatment; then, as it approaches about 80 °C, its behaviour changes reaching a sort of plateau at about 100 °C, which is related to water vaporisation within the tissue. Farther from the antenna, the experimental curve presents a different behaviour, showing a transition from the direct heating due to the electromagnetic field to the heating related to thermal conduction ( and ).
Considerations in agreement with those previously obtained for lower power values can be made when comparing measurements with simulations, in particular at the points closest to the antenna [Citation32]. In particular, simulations with the BHE-S provided unrealistic temperature increments close to the antenna surface, as previously found starting from MTA procedures carried out with 10 W [Citation32]. The model of water vaporisation (BHE-V) allows the prediction of the temperature plateau at about 100 °C experimentally found; however, at the closest distance from the antenna (5 mm) an unrealistic increase of the temperature begins after about 3 min, indicating that other mechanisms are present besides the water vaporisation phenomena. Such an unrealistic increase was not found in the simulations related to MTA procedures up to 20 W while it was already present at 40 W [Citation32] and it is in agreement with the findings of [Citation83].
The models considering the electric conductivity changes with the temperature (BHE-ST and BHE-ST_B) are able to find the plateau evidenced by the experimental data but they stabilise at temperature values higher than the measured ones, exactly as obtained at lower radiated powers in [Citation32]. The dynamic simulations, including the model of water vaporisation and the dependence of both the relative permittivity and electric conductivity on the temperature (SAR-T-1min and SAR-T-1min_B), are able to follow the experimental data at all the considered experimental conditions and measurement points. However, it must be noted here that, in the previous study, comparisons at points close to the antenna surface near to the antenna cooling system showed that the dynamic models give higher temperature values than those measured [Citation32].
With reference to the dimensions of the zone of ablation, reports LA and SA measured in the three experimental trials together with the results from the different numerical models. Percentage differences between the mean values of the measured dimensions and the corresponding numerical data are also reported. In the table, the simulation time is also reported to allow appreciating the trade-off between accuracy of simulation and computational burden. Simulations were performed using an Intel [email protected] processor, with 32 GB RAM.
Table 2. Measured and simulated dimensions of the zone of ablation with percentage differences.
In , all simulations, with the exception of the SAR-T-1min_B, find a LA shorter than measurements; on the other hand, most models that include water vaporisation find a SA within the experimental variability (exception is BHE-V-ST_B). The full-dynamical models provide the closer results to the experimental data.
In the comparison related to the dimension of the thermally ablated area, some considerations should be performed. First of all, the dimension of the ablated area is affected by the shrinkage phenomena cited above, and this should be introduced into the numerical study [Citation50,Citation72]. Then, the presence of the cooling system should be considered. In the numerical study the cooling system was modelled through heat convection characterised by a constant parameter and considering the cooling liquid at the same temperature all along the antenna length. However, the cooling liquid heats up during its path along the antenna axis, due to losses in the coaxial cable: this heating could affect the length of the ablated area. Last but not least, the numerical definition of the thermally ablated area must be cited. In the data reported in , ablation was defined as soon as the tissue reached a temperature of 60 °C. However, cells of different tissues may have varying sensitivity regarding heat. For instance, a thermal ablation threshold of about 54 °C was found in normal liver, while a threshold of 50 °C was obtained in liver tumour [Citation101]. Moreover, a study on human renal carcinoma cells showed a cell viability of about 20% after 2 min at 60 °C, and a viability almost instantaneously reduced to zero at 70 °C [Citation102]. Accordingly, different temperature thresholds were used in the literature, whereas some researchers used concepts directly derived from hyperthermia and related to the thermal history of the tissue, as the Arrhenius model or the CEM43 (i.e. cumulative number of equivalent minutes at 43 °C) parameter [Citation103–105]. This point is worth further investigation.
5. Real-time monitoring of the procedure
To achieve minimal invasiveness in MTA procedures, image guidance is currently used for planning, targeting, real-time monitoring of ablation therapy, as well as for assessing treatment response.
Planning refers to the imaging before the ablation procedure, in order to help determine whether patients are suitable candidates for MTA. Imaging aspects that are particularly important in this phase of the treatment include tumour location and delineation in terms of number, size and shape, together with visualisation of the surrounding anatomy. Several imaging techniques, including CT, ultrasound (US), magnetic resonance imaging (MRI) and, more recently, positron emission tomography (PET)-CT are used [Citation106]. Dynamic MRI, after application of contrast media, can also be useful for planning the ablation procedure in case of small hypervascularised tumours [Citation107].
The same imaging techniques are used for assessing treatment response, with a propensity for CT. Immediate assessment at the end of the MTA procedure should demonstrate that the target end point has been reached. Two types of image findings are typically identified following an ablation procedure, those related to zones of decreased perfusion [Citation108] and those in which the signal intensity (at MRI), echogenicity (at US), attenuation (at CT) or tracer uptake (at PET) are altered [Citation109]. In the case of lung tumour, post-treatment CT images show a ground glass opacification in the treated zone, which probably overestimates the zone of ablation of about 3–4 mm. This glass opacification represents the transition between non-viable and viable cells, so that when its extension covers all the tumour area plus a sufficient safety margin there is a good correlation with treatment success [Citation8,Citation110]. Over a week this zone changes to a denser opacification; in a few months it becomes still denser, consistent with fibrosis, and a little greater than it appeared after a week from the treatment, while at about 6 months it begins decreasing in dimensions unless a recurrence takes place [Citation8].
Targeting corresponds to the initial step of the MTA procedure, in order to guide proper placement of the antenna applicator into the tumour tissue while avoiding vascular structures [Citation111]. To help targeting, the imaging modality should provide a visualisation of the target tissue, applicator and surrounding anatomy. Contrast-enhanced US and CT are the commonly used imaging techniques. In addition, interventional magnetic resonance (MR) systems have been proposed [Citation112]. However, apart from requiring special MR-compatible applicators, a simultaneous MRI and applicator placement is not possible; consequently, the applicator has to be advanced step by step into the target tissue with the assistance of intermittent MRI. Therefore, this technique does not provide an immediate feedback during applicator positioning. Cone-beam CT (CBCT) imaging has also become increasingly important for treatment planning and diagnosis in interventional radiology; this tool incorporates both real-time fluoroscopy and CT-like imaging in the same device, thus allowing rapid planning of needle trajectories and safe needle deployment along the planned trajectory under real-time fluoroscopy [Citation113].
Monitoring concerns the observation of therapy effects during the intervention, including real-time measurement of the temperature increase as well as important aspects such as how well the tumour is being covered by the zone of coagulation and whether any adjacent healthy cells are being affected at the same time [Citation111]. In particular, temperature monitoring is an essential part of thermal ablation treatment, as it provides a feedback to decrease the risk for unwanted thermal damage to blood vessels or other critical structures surrounding the target region, as well as information about under-treated tissue. Historically, thermocouples, thermistors and fibre-optic-based sensors have been used to monitor the temperature in MTA procedures [Citation114]; however, these techniques require the insertion of the sensing probe in the target tissue, thus increasing the invasiveness of the treatment, and provide a limited amount of information. Moreover, thermocouples should be used with great care because they interfere with the electromagnetic field.
Non-invasive temperature monitoring methods, which include among others infrared (IR)- and MR-based thermometry, appear particularly attractive for application in MTA procedures. Traditional US, which is typically used to guide the ablation needle into the pathological target, is a poor predictor of ablation extent during the ablation procedure because of a hyper-echogenic focus, related to presence of microbubbles of gas that form in the heated tissue, obscuring the antenna applicator and the tumour [Citation108]. Nowadays, MR-based thermometry is the most accurate non-invasive technique and several methods, exploiting T1 relaxation time or proton resonance frequency (PRF) shift, have been developed to measure temperature [Citation115]. MRI can perform temperature monitoring in a range from 40 to 110 °C, enabling a spatial resolution of 1–2 mm; temperature gradients of 4 °C/mm may be registered, with a precision of 5 °C [Citation112]. The main limitations of the technique with reference to MTA procedures are high cost and low availability of MR-compatible MW instruments. These limitations might be less important for X-ray CT scan thermometry, which shows a potential for use in thermal ablation; CT offers also the chance to perform non-invasive thermometry on tissue (e.g. fat) where MR thermometry is prone to inaccuracies. However, MR-based thermometry allows monitoring tissue temperature without radiation exposure, whereas the CT-based one requires repeated CT scans with an equivalent dose depending on the treated organ and duration of the procedure. Cazzato et al. [Citation116] recently investigated the technical feasibility of flat-panel CBCT-guided RF ablation of very small (<1.5 cm) liver tumours on 3 patients, evidencing no peri- or post-procedural complications or cases of incomplete ablation after 1-month follow-up. Pandeya et al. [Citation117] carried out a feasibility study on a CT scan for non-invasive temperature assessment during RF ex vivo liver ablation in a temperature range from 20 to 98 °C, finding a CT thermal sensitivity of −0.60 Hounsfield Units (HU)/°C. The negative correlation for the relationship between temperature and HU value was confirmed in [Citation118], where CT thermometry (sequential multi-slice CT scans) was performed during both ex vivo and in vivo experiments on porcine liver specimens undergoing RF ablation. A sensitivity in a range from −0.44 to −0.35 HU/°C was found for ex vivo data, whereas in vivo experiments showed a thermal sensitivity between −0.025 and −0.43 HU/°C, even if with severe beam hardening artefacts. A detailed overview on existing knowledge on CT-based thermometry can be found in [Citation119], wherein a comparative analysis between CT thermal sensitivity and reconstruction parameters from different studies on ex vivo and in vivo tissues is presented. Differences in thermal sensitivity values can be attributed to different protocols, individual composition of liver tissue, different heating procedures, as well as to inter- and intra-scanner variability.
Intraprocedural imaging with CT, CBCT, PET, MRI or US may be used for assessment of ablation treatment in order to control it. In fact, the operator can exploit image-based information obtained during monitoring to modify the ablation treatment. This may simply consist of repositioning the applicator based on physician experience, or could be an automated system that terminates the ablation at a critical point in the procedure [Citation106]. However, all the above-mentioned techniques have shown ambiguity in differentiating ablated, untreated malignant and untreated normal tissue, suggesting the opportunity to investigate other imaging modalities for monitoring the effects of MTA procedures during the treatment. Byrd et al. [Citation120] investigated the possibility of exploiting colour Doppler US to visualise the thermo-coagulation zone in real time during MTA. Experiments, performed on ex vivo bovine liver specimens using a 915-MHz ablation antenna set to 45 W for 6 min concomitant with Doppler US imaging, suggested a correlation in size and shape between the actual thermo-coagulation zone observed in the tissue and the obtained images. Ultrasound elastography techniques that image tissue stiffness have also been considered: a recent work [Citation121] investigated electrode vibration elastography (EVE), a technique which uses transient vibration of the ablation applicator to estimate shear wave velocity of the treated tissue around a RF electrode or MW antenna. Results from ex vivo experiments suggested that EVE is potentially capable of imaging thermal ablations, but refinement of the technique is necessary before it can be used to monitor thermal ablation procedures clinically. Finally, a proof of concept on the use of MW imaging for sensing the temperature increase by taking advantage of the dependence of the tissue dielectric properties from the temperature has been recently presented [Citation122].
Besides image guidance, other methods could be hypothesised for the observation of therapy effects during the intervention; for instance, echoes of signals, emitted from the ablation probe, could be exploited to monitor progress of the thermo-coagulation zone in real time. Researchers from University of Wisconsin–Madison have recently developed a method that uses RF signals transmitted from a MW ablation probe which also detects the echoed signals, to monitor the boundaries between a tumour, ablation zone and background healthy tissue during the MTA procedure [Citation123].
Finally, use of a contrast agent during ablation procedures should be well described, including agent volume and timing of imaging, as it is important to acknowledge that image findings in tumour ablation differ based on ablation protocol, imaging modality, tumour type and organ site of ablation.
6. Conclusions and future perspectives
In this paper, several aspects of MTA applied for tumour treatment have been considered and discussed. MTA is a relatively new technique, which has already showed great potential and induced larger ablation zones compared with RF thermal ablation. However, this potential corresponds to greater risks of burning healthy tissues surrounding the target area; accordingly, the necessity to develop personalised and accurate clinical protocols as well as real-time non-invasive monitoring systems is high.
Several types of tumours, both primary and/or metastatic, benign and/or malign, can be treated with MTA in liver, kidney, lung, soft tissues and bone; each organ has different physical, biological and systemic peculiarities that can influence and affect the outcomes and the success of the ablation treatment. Large studies have been conducted on both ex vivo and in vivo conditions on animal models, involving heterogeneous ablation systems and procedures, so that there is a wide variability in published results and practice; moreover, a lack of controlled and comparative trials increases the difficulties in interpreting the results and the uncertainties about best practice in patients.
To date, the main component for a successful ablation procedure is the operator who significantly bases the treatment planning on personal experience, which is by definition variable and not standardised. The image guidance is thus a fundamental support for physicians and radiologists, improving the ability to accurately place the antenna applicators and attest appearance of successful or unsuccessful ablations and complications at immediate post-procedural imaging.
The future developments of the technique are based on the deep understanding of the different and complex phenomena occurring in the tissue at the very high temperatures reached during MTA, such as dielectric and thermal property changes and tissue shrinkage. Some studies already tackled these points, but further analyses are still needed to characterise the process. The achieved information would allow the development of numerical predictive tools for MTA treatments, which in turn would allow the study and optimization of personalised treatment planning as in hyperthermia procedures. From the data reported in this paper, it can be concluded that the numerical treatment planning should not necessitate sophisticated computational resources. However, it must be cited here that, to the authors’ knowledge, no study reporting comparison between numerical treatment planning and outcomes in in vivo situations for MTA procedures exists. This is a fundamental step in the development of the technique.
Moreover, while the different imaging techniques are routinely used for planning, targeting and assessing treatment response in clinical practice, with a preference for US or CT imaging according to the physician’s experience, no standardised method for real-time temperature monitoring is currently available. Accordingly, the real-time non-invasive monitoring of the temperature increases achieved in the treatment target area is still an open point that should be investigated in the near future.
Disclosure statement
The authors report no conflicts of interest.
References
- Ryan TP, Turner PF, Hamilton B. (2010). Interstitial microwave transition from hyperthermia to ablation: historical perspectives and current trends in thermal therapy. Int J Hyperthermia 26:415–33.
- Ahmed M, Brace CL, Lee FT Jr. et al. (2011). Principles of and advances in percutaneous ablation radiology. Radiology 258:351–69.
- Lin JC. (1999). Catheter microwave ablation therapy for cardiac arrhythmias. Bioelectromagnetics 20:120–32.
- Yeasmin S, Nakayama K, Ishibashi M, et al. Microwave endometrial ablation as an alternative to hysterectomy for the emergent control of uterine bleeding in patients who are poor surgical candidates. Arch Gynecol Obstet (2009). 280:279–282.
- Brace CL. (2009). Radiofrequency and microwave ablation of the liver, lung, kidney and bone: what are the differences. Curr Probl Diagn Radiol 38:135–43.
- Lin Y, Liang P, Yu X, et al. (2014). Percutaneous microwave ablation of renal cell carcinoma is safe in patients with a solitary kidney. Oncology 83:357–63.
- Liang P, Yu X, Yu J, eds. (2015). Microwave ablation treatment of solid tumors Dordrecht: Springer.
- Smith SL, Jennings PE. (2015). Lung radiofrequency and microwave ablation: a review of indications, techniques and post-procedural imaging appearances. Br J Radiol 88:20140598.
- Kok HP, Wust P, Stauffer PR, et al. (2015). Current state of the art of regional hyperthermia treatment planning: a review. Radiat Oncol 10:196.
- Hines-Peralta AU, Pirani N, Clegg P, et al. (2006). Microwave ablation: results with a 2.45-GHz applicator in ex vivo bovine and in vivo porcine liver. Radiology 239:94–102.
- Ward RC, Healey T, Dupuy DE. (2013). Microwave ablation devices for interventional oncology. Expert Rev Med Devices 10:225–38.
- Alexander ES, Wolf FJ, Machan JT, et al. (2015). Microwave ablation of focal hepatic malignancies regardless of size: a 9-year retrospective study of 64 patients. Eur J Radiol 84:1083–90.
- MicroThermX® – brochures and products’ specifications. Available from: http://www.terumo-europe.com/en-emea/interventional-oncology/loco-regional-treatment/ablation-systems/microthermx%C2%AE-microwave-ablation-system [last accessed Feb 2016].
- Liang PC, Lai HS, Shih TTF, et al. (2015). Initial institutional experience of uncooled single-antenna microwave ablation for large hepatocellular carcinoma. Clin Radiol 70:e35–e40.
- MedWaves AveCure™ – products’ datasheets. Available from: http://www.medwaves.com/products/[last accessed Feb 2016].
- Lubner MG, Hinshaw JL, Andreano A, et al. (2012). High-powered microwave ablation with a small-gauge gas cooled antenna: initial ex vivo and in vivo results. J Vasc Interv Radiol 23:405–11.
- Certus® 140 – brochures and products’ specifications. Available from: http://www.neuwave.com/products [last accessed Feb 2016].
- Acculis MTA System – brochures and products’ specifications. Available from: http://www.angiodynamics.com/products/Acculis [last accessed Feb 2016].
- AMICA™ – brochures and products’ specifications. Available from: http://www.hshospitalservice.com [last accessed Feb 2016].
- Ierardi AM, Mangano A, Floridi C, et al. (2015). A new system of microwave ablation at 2450 MHz: preliminary experience. Updates Surg 67:39–45.
- Emprint™ – brochures and products’ specifications. Available from: http://www.medtronic.com/covidien/products/ablation-systems/emprint-ablation-system [last accessed Feb 2016].
- Jones RP, Kitteringham NR, Terlizzo M, et al. (2012). Microwave ablation of ex vivo human liver and colorectal liver metastases with a novel 14.5 GHz generator. Int J Hyperthermia 28:43–54.
- Hinshaw JL, Lubner MG, Lee FT Jr, et al. (2014). Percutaneous tumor ablation tools: microwave, radiofrequency, or cryoablation – what should you use and why? Radiographics 34:1344–62.
- Rossi MR, Tanaka D, Shimada K, et al. (2010). Computerized planning of prostate cryosurgery using variable cryoprobe insertion depth. Cryobiology 60:71–9.
- Dodi R, Ferraguti F, Ristolainen A, et al. (2014). Planning and simulation of percutaneous cryoablation. AASRI Procedia 6:118–22.
- Yeniaras E, Fuentes DT, Fahrenholtz SJ, et al. (2014). Design and initial evaluation of a treatment planning software system for MRI-guided laser ablation in the brain. Int J Comput Assist Radiol Surg 9:659–67.
- Schumann C, Rieder C, Haase S, et al. (2015). Interactive multi-criteria planning for radiofrequency ablation. Int J Comput Assist Radiol Surg 10:879–89.
- Brace CL. (2011). Dual-slot antennas for microwave tissue heating: parametric design analysis and experimental validation. Med Phys 38:4232–40.
- Chiang J, Hynes KA, Bedoya M, et al. (2013). A dual-slot microwave antenna for more spherical ablation zones: ex vivo and in vivo validation. Radiology 268:382–9.
- Sun Y, Cheng Z, Dong L, et al. (2012). Comparison of temperature curve and ablation zone between 915- and 2450-MHz cooled-shaft microwave antenna: results in ex vivo porcine livers. Eur J Radiol 81:553–7.
- Wang Y, Sun Y, Feng L, et al. (2008). Internally cooled antenna for microwave ablation: results in ex vivo and in vivo porcine livers. Eur J Radiol 67:357–61.
- Cavagnaro M, Pinto R, Lopresto V. (2015). Numerical models to evaluate the temperature increase induced by ex vivo microwave thermal ablation. Phys Med Biol 60:3287–311.
- Zhou W, Liang M, Pan H, et al. (2012). Comparison of ablation zones among different tissues using 2450-MHz cooled-shaft microwave antenna: results in ex vivo porcine models. PLoS One 8:e71873.
- He N, Wang W, Ji Z, et al. (2010). Microwave ablation: an experimental comparative study on internally cooled antenna versus non-internally cooled antenna in liver models. Acad Radiol 17:894–9.
- Umehara H, Seki T, Inokuchi R, et al. (2012). Microwave coagulation using a perfusion microwave electrode: preliminary experimental study using ex vivo and in vivo liver. Exp Ther Med 3:214–20.
- Bedoya M, Muñoz del Rio A, Chiang J, et al. (2014). Microwave ablation energy delivery: influence of power pulsing on ablation results in an ex vivo and in vivo liver model. Med Phys 41:123301–07.
- Biffi Gentili G, Ignesti C. (2015). Dual applicator thermal ablation at 2.45 GHz: a numerical comparison and experiments on synchronous versus asynchronous and switched-mode feeding. Int J Hyperthermia 31:528–37.
- Curto S, Taj-Eldin M, Fairchild D, et al. (2015). Microwave ablation at 915 MHz vs 2.45 GHz: a theoretical and experimental investigation. Med Phys 42:6152–61.
- Yu J, Liang P, Yu X, et al. (2011). A comparison of microwave ablation and bipolar radiofrequency ablation both with an internally cooled probe: results in ex vivo and in vivo porcine livers. Eur J Radiol 79:24–130.
- Strohbehn JW, Bowers ED, Walsh JE, et al. (1979). An invasive microwave antenna for locally-induced hyperthermia for cancer therapy. J Microw Power 14:339–50.
- Luyen H, Gao F, Hagness SC, et al. (2014). Microwave ablation at 10.0 GHz achieves comparable ablation zones to 1.9 GHz in ex vivo bovine liver. IEEE Trans Biomed Eng 61:1702–10.
- Kuang M, Lu MD, Xie XY, et al. (2007). Liver cancer: increased microwave delivery to ablation zone with cooled-shaft antenna – experimental and clinical studies. Radiology 242:914–24.
- Cavagnaro M, Amabile C, Cassarino S, et al. (2015). Influence of the target tissue size on the shape of ex vivo microwave ablation zones. Int J Hyperthermia 31:48–57.
- Pennes HH. (1948). Analysis of tissue and arterial blood temperatures in resting forearm. J Appl Physiol 1:93–122.
- Kolios MC, Worthington AE, Sherar MD, et al. (1998). Experimental evaluation of two simple thermal models using transient temperature analysis. Phys Med Biol 43:3325–40.
- Wissler EH. (1998). Pennes’ 1948 paper revisited. J Appl Physiol 85:35–41.
- Pisa S, Cavagnaro M, Bernardi P, et al. (2001). A 915-MHz antenna for microwave thermal ablation treatment: physical design, computer modeling and experimental measurement. IEEE Trans Biomed Eng 48:599–601.
- Lopresto V, Pinto R, Lodato R, et al. (2012). Design and realisation of tissue-equivalent dielectric simulators for dosimetric studies on microwave antennas for interstitial ablation. Phys Med 28:245–53.
- Khaled A-RA, Vafai K. (2003). Review: The role of porous media in modeling flow and heat transfer in biological tissues. Int J Heat Mass Transfer 46:4989–5003.
- Chiang J, Birla S, Bedoya M, et al. (2015). Modeling and validation of microwave ablations with internal vaporization. IEEE Trans Biomed Eng 62:657–63.
- Kok HP, Gellermann J, van den Berg CAT, et al. (2013). Thermal modelling using discrete vasculature for thermal therapy: a review. Int J Hyperthermia 29:336–45.
- Van den Berg CAT, Van de Kamer JB, De Leeuw AAC, et al. (2006). Towards patient specific thermal modelling of the prostate. Phys Med Biol 51:809–25.
- Wright AS, Sampson LA, Warner TF, et al. (2005). Radiofrequency versus microwave ablation in a hepatic porcine model. Radiology 236:132–39.
- Brace CL, Laeseke PF, Van Der Weide DW, et al. (2007). Microwave ablation with a triaxial antenna: results in ex vivo bovine liver. IEEE Trans Microw Theory Tech 53:215–20.
- Prakash P. (2010). Theoretical modeling for hepatic microwave ablation. Open Biomed Eng J 4:27–38.
- Lopresto V, Pinto R, Cavagnaro M. (2014). Experimental characterisation of the thermal lesion induced by microwave ablation. Int J Hyperthermia 30:110–18.
- Schwan HP, Li K. (1953). Capacity and conductivity of body tissues at ultrahigh frequencies. Proc IRE 41:1735–40.
- Stuchly MA. (1981). Dielectric properties of animal tissues in vivo at frequencies 10 MHz–1 GHz. Bioelectromagnetics 1:93–103.
- Brady MM, Symons SA, Stuchly SS. (1981). Dielectric behaviour of selected animal tissues in vivo at frequencies from 2 to 4 GHz. IEEE Trans Biomed Eng 28:305–7.
- Gabriel C. Compilation of the dielectric properties of body tissues at RF and microwave frequencies. Brooks Air Force Technical Report AL/OE-TR-1996-0037; 1996. Available from: http://www.fcc.gov/oet/rfsafety/dielectric.html or http://niremf.ifac.cnr.it/tissprop
- Gabriel C, Gabriel S, Corthout E. (1996). The dielectric properties of biological tissues: I. Literature survey. Phys Med Biol 41:2231–49.
- Gabriel S, Lau RW, Gabriel C. (1996). The dielectric properties of biological tissues: II. Measurements in the frequency range 10 Hz to 20 GHz. Phys Med Biol 41:2251–69.
- O’Rourke AP, Lazebnik M, Bertram JM, et al. (2007). Dielectric properties of human normal, malignant and cirrhotic liver tissue: in vivo and ex vivo measurements from 0.5 to 20 GHz using a precision open-ended coaxial probe. Phys Med Biol 52:4707–19.
- Peyman A, Kos B, Djokić M, et al. (2015). Variation in dielectric properties due to pathological changes in human liver. Bioelectromagnetics 9999:1–10.
- Foster KR, Shepps JL. (1981). Dielectric properties of tumor and normal tissues at radio through microwave frequencies. J Microw Power 16:107–19.
- Johnson CC, Guy AW. (1972). Nonionizing electromagnetic wave effects in biological materials and systems. Proc IEEE 60:692–718.
- Chin L, Sherar M. (2001). Changes in dielectric properties of ex vivo bovine liver at 915 MHz during heating. Phys Med Biol 46:197–211.
- Stauffer PR, Rossetto F, Prakash M, et al. (2003). Phantom and animal tissues for modelling the electrical properties of human liver. Int J Hyperthermia 19:89–101.
- Chin L, Sherar M. (2004). Changes in the dielectric properties of rat prostate ex vivo at 915 MHz during heating. Int J Hyperthermia 20:517–27.
- Lazebnik M, Converse MC, Booske JH, et al. (2006). Ultrawideband temperature-dependent dielectric properties of animal liver tissue in the microwave frequency range. Phys Med Biol 51:1941–55.
- Brace CL. (2008). Temperature-dependent dielectric properties of liver tissue measured during thermal ablation: toward an improved numerical model. Proc 30th Annual International IEEE EMBS Conference; 2008 Aug 20–24; Vancouver, British Columbia, Canada; p. 230–3.
- Ji Z, Brace CL. (2011). Expanded modeling of temperature-dependent dielectric properties for microwave thermal ablation. Phys Med Biol 56:5249–64.
- Lopresto V, Pinto R, Lovisolo GA, et al. (2012). Changes in the dielectric properties of ex vivo bovine liver during microwave thermal ablation at 2.45 GHz. Phys Med Biol 57:2309–27.
- Rossmann C, Haemmerich D. (2014). Review of temperature dependence of thermal properties, dielectric properties, and perfusion of biological tissues at hyperthermic and ablation temperatures. Crit Rev Biomed Eng 42:467–92.
- Bicher HI, Hetzel FW, Sandhu TS, et al. (1980). Effects of hyperthermia on normal and tumor microenvironment. Radiology 137:523–30.
- Brown SL, Hunt JW, Hill RP. (1992). Differential thermal sensitivity of tumour and normal tissue microvascular response during hyperthermia. Int J Hyperthermia 8:501–14.
- Sturesson C, Ivarsson K, Andersson-Engels S, et al. (1999). Changes in local hepatic blood perfusion during interstitial laser-induced thermotherapy of normal rat liver measured by interstitial laser Doppler flowmetry. Lasers Med Sci 14:143–9.
- He X, McGee S, Coad JE, et al. (2004). Investigation of the thermal and tissue injury behaviour in microwave thermal therapy using a porcine kidney model. Int J Hyperthermia 20:567–93.
- Bhattacharya A, Mahajan RL. (2003). Temperature dependence of thermal conductivity of biological tissues. Physiol Meas 24:769–83.
- Guntur SR, Lee KI, Paeng DG, et al. (2013). Temperature-dependent thermal properties of ex vivo liver undergoing thermal ablation. Ultrasound Med Biol 39:1771–84.
- Choi J, Morrissey M, Bischof JC. (2013). Thermal processing of biological tissue at high temperatures: impact of protein denaturation and water loss on the thermal properties of human and porcine liver in the range 25–80 °C. J Heat Transfer 135:061302.
- Yang D, Converse MC, Mahvi DM, et al. (2007). Measurement and analysis of tissue temperature during microwave liver ablation. IEEE Trans Biomed Eng 54:150–55.
- Yang D, Converse MC, Mahvi DM, et al. (2007). Expanding the bioheat equation to include tissue internal water evaporation during heating. IEEE Trans Biomed Eng 54:1382–8.
- Haemmerich D, dos Santos I, Schutt DJ, et al. (2006). In vitro measurements of temperature dependent specific heat of liver tissue. Med Eng Phys 28:194–7.
- Ramachandran T, Sreenivasan K, Sivakumar R. (1996). Water vaporization from heated tissue: an in vitro study by differential scanning calorimetry. Lasers Surg Med 19:413–15.
- Brace CL, Diaz TA, Hinshaw JL, et al. (2010). Tissue contraction caused by radiofrequency and microwave ablation: a laboratory study in liver and lung. J Vasc Radiol 21:1280–6.
- Sommer CM, Sommer SA, Mokry T, et al. (2013). Quantification of tissue shrinkage and dehydration caused by microwave ablation: experimental study in kidneys for the estimation of effective coagulation volume. J Vasc Interv Radiol 24:1241–8.
- Rossmann C, Garrett-Mayer E, Rattay F, et al. (2014). Dynamics of tissue shrinkage during ablative temperature exposures. Physiol Meas 35:55–67.
- Brace CL, Gagnon D, Borden Z, et al. Ablation-induced tissue contraction measured by CT: correlation with dehydration. World Conference on Interventional Oncology; 2011 Jun 9–11; New York, USA; 2011.
- Farina L, Lopresto V, Pinto R, et al. The use of CT to improve the knowledge of the physical phenomena associated with microwave thermal ablation procedures. Proc 2015 International Conference on Electromagnetics in Advanced Applications (ICEAA ’15); 2015 Sep 7–11; Torino, Italy; 2015. p. 977–80.
- Liu D, Brace CL. (2014). CT imaging during microwave ablation: analysis of spatial and temporal tissue contraction. Med Phys 41:113303-1–9.
- Farina L, Weiss N, Nissenbaum Y, et al. (2014). Characterisation of tissue shrinkage during microwave thermal ablation. Int J Hyperthermia 30:419–28.
- Bertram JM, Yang D, Converse MC, et al. (2006). A review of coaxial-based interstitial antennas for hepatic microwave ablation. Crit Rev Biomed Eng 34:187–213.
- Lin JC, Bernardi P, Pisa S, et al. Antennas for medical therapy and diagnostics. In: Balanis C, editor. (2008). Modern antenna handbook New York: Wiley; p. 1377–428.
- Cavagnaro M, Amabile C, Bernardi P, et al. (2011). A minimally invasive antenna for microwave ablation therapies: design, performances, and experimental assessment. IEEE Trans Biomed Eng 58:949–59.
- Karampatzakis A, Kühn S, Tsanidis G, et al. (2013). Antenna design and tissue parameters considerations for an improved modelling of microwave ablation in the liver. Phys Med Biol 58:3191–206.
- McWilliams BT, Schnell EE, Curto S, et al. (2015). A directional interstitial antenna for microwave tissue ablation: theoretical and experimental investigation. IEEE Trans Biomed Eng 62:2144–50.
- Ramadhyani S, Abraham JP, Sparrow EM. A mathematical model to predict tissue temperatures and necrosis during microwave thermal ablation of the prostate. In: Minkowycz WJ, Sparrow EM, Abraham JP, editors. Advances in numerical heat transfer Vol. 3. New York: CRC Press; 2009. p. 345–71.
- Lu Y, Nan Q, Li L, et al. (2009). Numerical study on thermal field of microwave ablation with water cooled antenna. Int J Hyperthermia 25:108–15.
- Ai H, Wu S, Gao H, et al. (2012). Temperature distribution analysis of tissue water vaporization during microwave ablation: experiments and simulations. Int J Hyperthermia 28:674–85.
- Liang P, Dong B, Yu X, et al. (2001). Computer-aided dynamic simulation of microwave-induced thermal distribution in coagulation of liver cancer. IEEE Trans Biomed Eng 48:821–9.
- He X, Bischof JC. (2005). The kinetics of thermal injury in human renal carcinoma cells. Ann Biomed Eng 3:502–10.
- Mertyna P, Goldberg W, Yang W, et al. (2009). Thermal ablation: a comparison of thermal dose required for radiofrequency-, microwave-, and laser-induced coagulation in an ex vivo bovine liver. Acad Radiol 16:1539–48.
- Prakash P, Diederich CJ. (2012). Considerations for theoretical modelling of thermal ablation with catheter-based ultrasonic sources: implications for treatment planning, monitoring and control. Int J Hyperthermia 28:69–86.
- Pearce JA. (2013). Comparative analysis of mathematical models of cell death and thermal damage processes. Int J Hyperthermia 29:262–80.
- Ahmed M, Solbiati L, Brace CL, et al. (2014). Image-guided tumor ablation: standardization of terminology and reporting criteria – a 10-year update. J Vasc Interv Radiol 25:1691–705.
- Kim MJ, Kim JH, Chung JJ, et al. (2003). Focal hepatic lesions: detection and characterization with combination gadolinium- and superparamagnetic iron oxide-enhanced MR imaging. Radiology 228:719–26.
- Goldberg SN, Gazelle GS, Mueller PR. (2000). Thermal ablation therapy for focal malignancy: a unified approach to underlying principles, techniques, and diagnostic imaging guidance. Am J Roentgenol 174:323–31.
- Sainani NL, Gervais DA, Mueller PR, et al. (2013). Imaging after percutaneous radiofrequency ablation of epatic tumours. I. Normal findings. Am J Roetgennol 200:184–93.
- Little MW, Chung D, Boardman P, et al. (2013). Microwave ablation of pulmonary malignancies using a novel high-energy antenna system. Cardiovasc Intervent. Radiol 36:460–5.
- Goldberg SN, Grassi CJ, Cardella JF, et al. (2005). Image-guided tumor ablation: standardization of terminology and reporting criteria. Radiology 235:728–39.
- Clasen S, Pereira PL. (2008). Magnetic resonance guidance for radiofrequency ablation of liver tumors. J Magn Reson Imaging 27:421–33.
- Morimoto M, Numata K, Kondo M, et al. (2010). C-arm cone beam CT for hepatic tumor ablation under real-time 3D imaging. AJR Am J Roentgenol 194:W452–4.
- Saccomandi P, Schena E, Silvestri S. (2013). Techniques for temperature monitoring during laser-induced thermotherapy: an overview. Int J Hyperthermia 29:609–19.
- McDannold N. (2005). Quantitative MRI-based temperature mapping based on the proton resonant frequency shift: review of validation studies. Int J Hyperthermia 21:533–46.
- Cazzato RL, Buy X, Alberti N, et al. (2015). Flat-panel cone-beam CT-guided radiofrequency ablation of very small (≤1.5 cm) liver tumors: technical note on a preliminary experience. Cardiovasc Intervent Radiol 38:206–12.
- Pandeya GD, Greuter MJ, de Jong KP, et al. (2011). Feasibility of noninvasive temperature assessment during radiofrequency liver ablation on computed tomography. J Comput Assist Tomogr 35:356–60.
- Bruners P, Pandeya GD, Levit E, et al. (2012). CT-based temperature monitoring during hepatic RF ablation: feasibility in an animal model. Int J Hyperthermia 28:55–61.
- Fani F, Schena E, Saccomandi P, et al. (2014). CT-based thermometry: an overview. Int J Hyperthermia 30:219–27.
- Byrd JF, Agee N, McKillop IH, et al. (2011). Colour Doppler ultrasonography provides real-time microwave field visualisation in an ex vivo porcine model. HBP 13:400–3.
- Dewall RJ, Varghese T, Brace CL. (2012). Visualizing ex vivo radiofrequency and microwave ablation zones using electrode vibration elastography. Med Phys 39:6692–700.
- Bucci OM, Cavagnaro M, Crocco L, et al. Microwave ablation monitoring via microwave tomography: a numerical feasibility assessment. Accepted 10th European Conference on Antennas and Propagation (EuCAP) EuCAP’2016; 2016 Apr 10–15; Davos, Switzerland; 2016.
- Wang P, Brace CL. System for monitoring thermal ablation using radiofrequency echoes. United States Patent Application. Publication No. US-2015-0005757. 2015 Jan 1. Available from: http://www.warf.org/documents/pubapps/P130294US01%20Published%20Application.pdf [last accessed 2016 Feb 21].
- Andreano A, Huang Y, Meloni MF, et al. (2010). Microwaves create larger ablations than radiofrequency when controlled for power in ex vivo tissue. Med Phys 37:2967–73.