
Abstract
MR-guided high-intensity focussed ultrasound (MRgHIFU) non-invasive ablative surgeries have advanced into clinical trials for treating many pathologies and cancers. A remaining challenge of these surgeries is accurately planning and monitoring tissue heating in the face of patient-specific and dynamic acoustic properties of tissues. Currently, non-invasive measurements of acoustic properties have not been implemented in MRgHIFU treatment planning and monitoring procedures. This methods-driven study presents a technique using MR temperature imaging (MRTI) during low-temperature HIFU sonications to non-invasively estimate sample-specific acoustic absorption and speed of sound values in tissue-mimicking phantoms. Using measured thermal properties, specific absorption rate (SAR) patterns are calculated from the MRTI data and compared to simulated SAR patterns iteratively generated via the Hybrid Angular Spectrum (HAS) method. Once the error between the simulated and measured patterns is minimised, the estimated acoustic property values are compared to the true phantom values obtained via an independent technique. The estimated values are then used to simulate temperature profiles in the phantoms, and compared to experimental temperature profiles. This study demonstrates that trends in acoustic absorption and speed of sound can be non-invasively estimated with average errors of 21% and 1%, respectively. Additionally, temperature predictions using the estimated properties on average match within 1.2 °C of the experimental peak temperature rises in the phantoms. The positive results achieved in tissue-mimicking phantoms presented in this study indicate that this technique may be extended to in vivo applications, improving HIFU sonication temperature rise predictions and treatment assessment.
Introduction
High-intensity focussed ultrasound (HIFU) thermal therapies have been employed to treat a wide range of pathologies, including soft tissue malignancies and uterine fibroids as well as neurological diseases [Citation1]. In both ablation and hyperthermia treatments, precise control of temperature magnitude and distribution is important for completely treating the targeted tissue volume while preserving surrounding tissue. Particularly for ablative therapies, treatment planning incorporated prior to surgery estimates the sonication powers and durations necessary to achieve the desired tissue necrosis volume [Citation2]. While thresholds vary between tissues, current standards in ablative surgeries claim that tissue necrosis occurs with certainty when thermal dose exceeds 240 cumulative equivalent minutes (CEM) at 43 °C, coinciding with protein denaturation and tissue coagulation [Citation2,Citation3].
Knowledge of tissue acoustic properties as well as patient anatomy is required for treatment planning, including acoustic pressure, temperature, and thermal dose field predictions. Currently, such planning procedures are performed with tabulated literature property values for targeted tissues, and it is often assumed these values are static throughout the treatment or individual sonication time [Citation4]. However, there is evidence that pertinent acoustic or thermal properties are patient-specific, and could depend on factors such as tissue density and water content [Citation5,Citation6]. The incorporation of patient-specific acoustic parameters in the treatment planning software could potentially improve predictions in such cases.
In addition to interpatient variability observed in vivo, it is widely accepted that acoustic properties of excised tissues are temperature dependent, and undergo irreversible changes as tissue begins to denature [Citation7–12]. Multiple studies have reported a 60–100% change in acoustic attenuation or absorption in excised muscle or liver tissue when ablated (tissue temperatures of 60–90 °C) [Citation7,Citation10,Citation12,Citation13], as well as a 10–20% change which occurs in tissues at sub-ablative temperatures (<50 °C) [Citation14]. A previous in vitro study showed that assuming non-temperature-dependent acoustic absorption table values resulted in substantial errors in the predicted treatment volume [Citation15]. Although the temperature dependence of acoustic attenuation is typically non-linear [Citation8,Citation12], some simulation techniques have employed a linear model to compensate for temperature-dependent changes to acoustic attenuation [Citation4,Citation16,Citation17]. Still, applying temperature-dependent models requires a priori knowledge of tissue-specific, and potentially patient-specific, property behaviours.
Ideally, patient-specific tissue properties could be determined completely non-invasively, using the same HIFU hardware used for monitoring treatments. For general HIFU treatment monitoring, both ultrasound (US) and magnetic resonance (MR) imaging-based techniques have been proposed. US-based monitoring is low-cost, portable, and inherently sensitive to acoustic properties. However, US methods such as attenuation mapping are limited by a poor signal-to-noise ratio at large penetration depths [Citation18], the presence of bubbles at the lesion [Citation19], and the inability to provide quantitative or absolute values of the attenuation coefficient [Citation20–22].
Magnetic resonance imaging-based monitoring can provide accurate temperature measurements from which acoustic properties can be derived. Traditionally, acoustic absorption has been calculated from the HIFU specific absorption rate (SAR), which is proportional to the initial heating rate (IHR, °C s −1) in soft tissues, using thermocouples [Citation23–25]. While thermocouples allow for fast acquisition times necessary to neglect conduction effects, they are invasive. In contrast, magnetic resonance temperature imaging (MRTI) can be used non-invasively to measure tissue acoustic absorption and thermal properties despite longer acquisition times. MRTI through proton resonance frequency (PRF) shift imaging provides the additional benefit of being linearly proportional to temperature in ablative ranges (up to 100 °C) and independent of tissue type with the exception of adipose tissue [Citation26].
Three-dimensional MRTI has the potential to derive absolute values of acoustic tissue properties by later calculating the specific absorption rate (SAR) at each point in a 3D volume. For ultrasound applications, SAR is described as the amount of acoustic energy absorbed as heat per unit mass, which can be calculated from a linear fit to the initial slope of temperature vs. time curves [Citation27]. One obstacle to the use of 3D MRTI for measuring SAR, and therefore estimating acoustic properties, is acquisition times on the order of a few seconds, when the effects of conduction can no longer be neglected as in a linear SAR calculation. However, a recent study by Dillon et al. found that by fitting the radial temperature distribution as a function of time to a three-parameter analytical solution, rather than a linear one, the error from measuring SAR with MRTI can be reduced from 60% to 10% for up to 10-s acquisition times [Citation28].
Based on the dynamic nature of tissue properties observed during HIFU ablations, the motivation for non-invasively measuring patient-specific tissue properties is three-fold: (1) to improve treatment-planning predictions prior to MR-guided HIFU surgeries, (2) to develop robust models of tissue properties as a function of thermal ablation, and (3) to detect the formation of coagulative necrosis through relative changes in tissue properties. This work aims to address a portion of these motivations by quantitatively estimating the patient-specific acoustic absorption and speed of sound using MRTI thermometry data and the analytical SAR calculation technique developed by Dillon et al. This new technique is described in detail, and its accuracy is assessed by comparison with independent measures in phantom models with differing acoustic properties.
Methods and materials
Theory
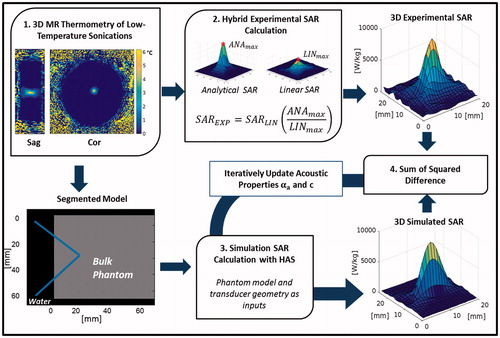
This work develops a non-invasive acoustic property estimation procedure to determine subject-specific acoustic absorption (∝a) and speed of sound c properties from 3D MRTI measurements obtained in conjunction with low-power HIFU heating. The technique minimises the sum of squares difference between experimentally collected and simulated SAR patterns to extract these properties, since SAR amplitude and shape are dependent on the acoustic properties of the materials through which the focussed ultrasound beam propagates. An overview of the algorithm used to estimate these properties is shown in . In general, experimental SAR patterns of ultrasound sonications in tissue-mimicking gelatine phantoms are compared to simulated SAR patterns using the same sonication parameters in a numerical model with defined acoustic properties. The acoustic properties of the simulation model are then updated iteratively until the difference between the simulated and experimental SAR patterns is minimised.
Figure 1. Flow chart of the acoustic property estimation procedure beginning with (1) the acquisition of 3D MRTI data of the sonication, which is used to (2) calculate the 3D experimental SAR pattern. The segmented model, generated from magnitude images, is then used to (3) generate a simulated SAR pattern with the Hybrid Angular Spectrum (HAS) method. (4) The sum of squared difference is then calculated between the experimental and simulated patterns, and the HAS simulation is updated with αa and c until the difference is minimised.
The experimental 3D SAR pattern is determined using MRTI data acquired during a low-power focussed ultrasound sonication into a homogeneous gelatine phantom. The calculation, elaborated on below, involves a hybrid technique which combines previously developed linear [Citation23–25] and analytical methods [Citation28].
The simulated 3D SAR pattern is obtained via the Hybrid Angular Spectrum (HAS) method, an extension of the angular spectrum method used to model linear wave propagation though inhomogeneous media [Citation29]. HAS generates a simulated 3D SAR pattern that matches the size and resolution of a user-defined segmented model. Identical volumes of the experimental and simulated SAR patterns are then compared via a voxel-by-voxel sum of squared differences calculation within a MATLAB optimisation routine (fminsearchbnd). The acoustic absorption and speed of sound values that result in the lowest error are accepted as the estimated property values of the target subject.
In this study, a homogenous medium (gelatine-based phantom [Citation30]) is used to validate this estimation technique. The 3D segmented model therefore consists of water and phantom domains, and phantom acoustic absorption and speed of sound are simultaneously estimated within the optimisation routine.
Experimental SAR
Experimental SAR is calculated from 3D MRTI data acquired during a low-powered HIFU sonication into the phantom. A hybrid technique combines a linearly (SARLIN) and analytically (SARANA) calculated SAR pattern in order to quantify the peak SAR magnitude while maintaining the 3D shape necessary for accurate spatial registration with the simulated SAR pattern (). First, SARLIN is calculated at each voxel, assuming a linear increase in temperature with time and that conduction and perfusion losses are negligible during the initial heating period, as:
(1)
where cp [J kg −1·°C −1] is specific heat and
[°C s −1] is calculated as the slope of the first two temperature measurements acquired during heating (points 4 and 5 in the temperature profiles) as an approximation of the IHR [Citation27]. However, on the time scale of MRTI acquisition, which is a few seconds, it is known that conduction and perfusion losses begin to decrease the focal temperature rise, causing initial slope values lower than the true initial heating rate, and ultimately underestimating the SAR values (EquationEquation 1
(1) ) [Citation28]. This peak underestimation is remedied by the hybrid SAR calculation.
Figure 2. Schematic of MRgHIFU sonications. The gelatine phantoms were held above the HIFU transducer at a fixed height (108 mm) and the ultrasound beam was focussed 22 mm into the phantom. A fibre-optic temperature probe was inserted into a hole in the side of the holder, away from the HIFU focus, to monitor bulk phantom temperature. The longitudinal direction is defined as parallel to the HIFU beam propagation, while the transverse direction is orthogonal to it.
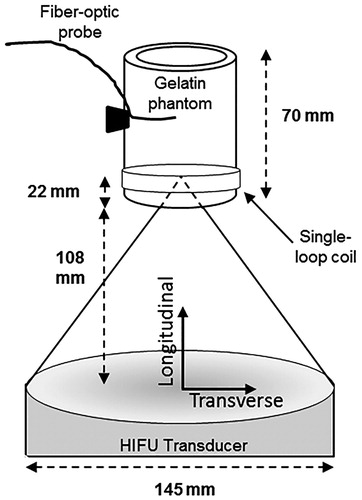
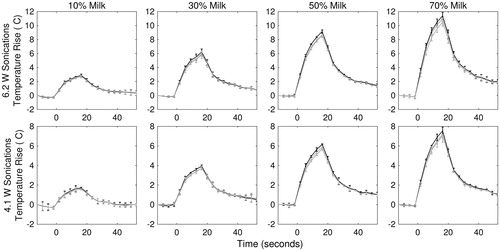
Figure 3. Temperature rise vs. time profiles of each phantom construction type for two sonication powers, 6.2 W (top row) and 4.1 W (bottom row). The black line plots the temperature vs. time in the centre slice of the HIFU focus (slice with the greatest temperature rise). The two grey lines plot temperature vs. time in the slices 1 position proximal and distal to the centre slice. Each curve is the averaged across all samples trials for each slice and one concentration (n = 3) with error bars indicating standard deviation.
Next, SARANA is determined using a previously developed method that fits MRTI data to an analytical temperature solution. The solution (EquationEquation 2(2) ) describes the 2D transverse temperature profile in an acoustically absorbing medium, approximating ultrasonic energy deposition as a radially uniform Gaussian. A three-parameter fit is applied to the temperature solution below:
(2)
where Ei denotes the exponential integral function
, ψ is thermal diffusivity [mm2 s−1], A is the IHR [°C s−1], and β is the HIFU beam variance
FWMH = full-width half-maximum of the HIFU beam focal intensity, [mm]) [Citation28]. For this study, independently measured values are used for thermal diffusivity (ψ), reducing EquationEquation 2
(2) to a two-parameter fit. The remaining two parameters, A and β, are fit simultaneously as a function of radial distance from the centre of the focus (r [mm]) and time (t [s]) to experimental temperature data. The 2D SARANA pattern is then obtained in the transverse plane by the following relation:
(3)
Finally, this 2D analytical SAR estimation is repeated in multiple transverse planes to obtain a 3D pattern.
The hybrid technique is used to determine experimental SAR because, while SARANA was previously shown to accurately estimate the peak value of SAR compared to simulations (which is proportional to the acoustic absorption coefficient in a homogenous medium) [Citation28], the method underestimates SAR values at longitudinal distances that exceed 2–3 mm from the centre of the beam focus. This underestimation is a result of conduction along the beam axis (the longitudinal direction in ), which is not considered by EquationEquation 2(2) . Conversely, SARLIN closely reflects the experimental SAR pattern length and width of the 3D shape, but severely underestimates the peak experimental SAR value [Citation28]. Therefore, in order to capture both the overall shape and peak of the SAR field, the final experimental SAR (SAREXP) pattern was obtained by scaling the 3D SARLIN pattern to match the maximum value of the analytical SARANA pattern by the following equation:
(4)
where ANAmax and LINmax [W kg −1] are the peak values in the 3D SARANA and SARLIN patterns, respectively.
The SAREXP patterns in this study were calculated from MRTI data of low-temperature rise sonications in the phantoms by the following steps. First, SARLIN was calculated according to EquationEquation 1(1) at each voxel in a 25 × 25 × 21-voxel (12.5 × 12.5 × 21-mm3) ROI centred at the focus. Then, SARANA was calculated by applying the two-parameter fit to the MRTI data over 6-mm radius in the 2D transverse plane centred at the focus (∼2260 voxels) using data at five heating time points (total of 18.125 s) and six cooling time points (total of 21.750 s). Although only the maximum voxel of the analytical SAR was of interest, the 2D calculation was applied over five transverse slices to ensure that the absolute maximum was found. After finding ANAmax and LINmax, the SAREXP pattern was calculated by applying EquationEquation 4
(4) to the entire 25 × 25 × 21-voxel ROI.
Simulated SAR
Simulated SAR patterns (SARSIM) were calculated using the HAS method [Citation29]. In this study, the HAS simulations assumed that scattering in the phantom gelatine material was negligible, so attenuation was attributed entirely to absorption. The inputs to the HAS algorithm included the transducer geometry (13-cm radius of curvature, 14.5-cm diameter), frequency (1 MHz), applied acoustic power (6.2 and 4.1 acoustic watts), and the 3D segmented model with its assigned properties. For each voxel of the segmented model, three material properties must be uniquely assigned: density ρ (kg m −1), speed of sound c (m s −1), and attenuation (absorption) coefficient ∝a (Np cm −1 MHz −1). For the simulations in the phantoms in this study, the segmented model was generated by segmenting a single coronal slice of the MR magnitude image of a phantom into two domains: water and gelatine phantom. Since the MRTI imaging volume did not cover the entire length of phantom in the longitudinal direction, one segmented slice was replicating in the longitudinal direction to match the phantom length (70 mm). All simulations were run at a resolution of 0.5 × 0.5 × 1.0 mm.
Acoustic property estimation routine
For acoustic property estimation, SAREXP and SARSIM were loaded into the MATLAB fminsearchbnd function, which was customised to minimise the difference between the two patterns by iteratively updating the acoustic properties of the gelatine medium. In the segmented model, all properties of the water domain (ρ = 1000 kg/m3, ∝a = 2.5 × 10 −4 Np cm −1 MHz−1, and c = 1500 m s −1) and the density of the gelatine domain remained constant throughout the optimisation (as listed in ). Initial values of the gelatine attenuation and speed of sound values were randomly selected from a predetermined bounded range (see below) and used along with the previously specified transducer inputs to generate a simulated SAR pattern. A weighted sum of squared differences (SSD) between the SAREXP and SARSIM magnitudes (over a common 25 × 25 × 21-voxel region) was then calculated as follows:
(5)
where WG is a spatial weighting function. This weighting function was a 3D Gaussian centred at the focus, with variances
(6)
which were calculated from the FWHM of the HIFU pressure pattern in all three dimensions as measured by hydrophone in water (1.8 × 1.8 × 10.9 mm,
) The weighting scheme was chosen to reduce the contribution of the MR noise which manifests in the background and edges of the SAREXP pattern. The acoustic absorption and speed of sound values were then iteratively updated according to the fminsearchbnd function until the SSD reached a minimum value (with a tolerance of 1 × 10⁻⁴ W kg −1).
Table 1. Average and standard deviation of property values for phantoms by independent measurements described in methods (n = 3 except where noted).
The bounds of the phantom acoustic absorption (∝a) were ±99.0% of the average expected value of all phantoms used in the study (attenuation average =0.045 Np cm−1 MHz −1, [n = 12]; bounds = 4.5 × 10⁻⁴ to 0.09 Np cm−1 MHz−1), and the bounds of speed of sound (c) were ±3.0% of the average expected value of all phantoms used the study (average = 1555 m s −1, [n = 12]; bounds = 1508.4 to 1601.7 m s −1).
MRgHIFU sonications
Tissue-mimicking phantoms
Four variations of a tissue-mimicking gelatine phantom were fabricated to model a range of acoustic properties observed in soft tissue by varying the concentration of evaporated milk [Citation30]. These phantoms (179 ml, 7-cm height, and 5.7-cm diameter) contained 11.1% porcine gelatine powder (250-bloom ballistics gelatine, Vyse Gelatine Co., Schiller Park, IL), 0.44% powder preservative (Dowacil, Dow Chemical Co., Midland, MI), and 10%, 30%, 50%, or 70% by volume evaporated milk (Nestlé Carnation Evaporated Milk: Vitamin D added, 6.3% fat), with the remaining volume consisting of deionised water. To reduce fabrication variability, a single batch of gelatine solution was prepared for each milk concentration and poured into three separate cylindrical moulds, for a total of 12 phantoms for testing. The melting point of the phantoms was determined by observation to be approximately 30 °C. The phantoms were made one week prior to experimental testing and stored at 4 °C to ensure complete gel formation.
MRgHIFU sonications
Low-power HIFU sonications were performed with an MR-compatible 256-element phased-array ultrasound system (Imasonic, Voray-sur-l'Ognon, France, and Image Guided Therapy, Bordeaux, France; 13-cm radius of curvature, 14.5-cm diameter) with an operating frequency of 1 MHz and an intensity FWHM focal size of 1.3 × 1.3 × 8.0 mm3 (defined as -3 dB signal of intensity profile measured by hydrophone in water). All phantoms were removed from 4 °C storage 12 h before the study to ensure thermal equilibrium at room temperature (mean = 21.2 °C). An MR-compatible fibre-optic temperature probe (Neoptix, Quebec, Canada) was inserted into the side of the phantom samples, approximately 3 cm from the ultrasound beam’s geometric focus, to record bulk phantom temperature throughout the experiment. The samples were secured above the transducer such that the geometric focus was consistently 22 mm from the bottom of the sample (. Degassed, deionised room-temperature water was used to couple the samples to the transducer. Two HIFU sonications were performed per sample at 6.2 and 4.1 acoustic watts for 18.125 s. To prevent thermal hysteresis effects of repeated sonications, the 6.2-W sonication was performed on one end of the phantom, and then the phantom was rotated 180° so that the 4.1-W sonication was performed on the opposite end of the phantom. Acoustic power output of the transducer was later confirmed independently using the force balance technique with an absorbing target in water [Citation31]. Ultrasound heating time was synchronised to the start of an MR thermometry acquisition via optical triggering. The sonications were repeated for each phantom type three times (n = 3), each in three separate phantoms.
MR temperature imaging
MR temperature imaging via the proton resonance frequency shift method [Citation26] was acquired in a 3T Siemens Trio scanner (Siemens Medical Solutions, Erlangen, Germany) with a 3D segmented-EPI sequence with echo train length of 9 at 1 × 1 × 3-mm resolution (zero-fill interpolated to 0.5 × 0.5 × 1.0 mm). For all scans, TR/TE = 35/11 ms, pixel bandwidth = 744 Hz/pixel, matrix size = 160 × 81 × 10, flip angle = 25° with a 3.625-s acquisition time. For MR signal detection, a custom-built single-loop radiofrequency coil equal in size to the outer diameter of the phantom samples (5.7 cm) was placed 1.5 cm above the base of phantom.
Independent property measurements
Acoustic properties
Through-transmission measurements of the acoustic properties were performed prior to MRgHIFU sonications via the substitution method in water [Citation32]. Phantoms were removed from 4 °C storage 12 h prior to through-transmission measurements to ensure a bulk uniform temperature of 21 °C and monitored for thermal drift throughout the experiment with a thermocouple probe (Omega Engineering, Stamford, CT) inserted near the centre of phantom. The through-transmission set-up included a deionised water tank containing a 1-MHz fundamental frequency ultrasound transducer (Panametrics-NDT, V314, Watham, MA) and a hydrophone (ONDA, HNR-0500, Sunnyvale, CA) to receive the transmission of ultrasound through the phantom sample. Speed of sound (c) and acoustic attenuation (∝) values were determined at four frequencies: 0.65, 1.05, 1.70, and 3.00 MHz according to calculations previously described in [Citation30,Citation33]. The measurement was performed once on each phantom, for a total of three measurements per phantom type (n = 3). To solve for attenuation (∝) at 1 MHz, through-transmission data were fit to the following equation:
(7)
where ∝f is acoustic pressure attenuation at 1 MHz, f is frequency of the transducer in MHz, and n is the power coefficient of frequency [Citation32]. Acoustic attenuation (∝) measured by this technique is the sum of both acoustic absorption (∝a) and acoustic scattering (∝s) in the material [Citation32]; however, since scattering was assumed to be negligible in the HAS simulations, the absorption coefficient (∝a) was set equal to the attenuation coefficient (∝).
Thermal properties
After MRgHIFU experiments, a KD2 Pro invasive thermal probe (SH-1 attachment, Decagon Devices, Inc., Pullman, WA) was used to measure thermal diffusivity (ψ) and thermal conductivity (k) of each phantom type. The two-pronged probe was inserted into each phantom for the duration of the 3-min measurement of thermal properties. The specific heat capacity at constant pressure (cp) was determined indirectly from the following relation:
(8)
Thermal property measurements were averaged (n = 3) for each phantom type. Density (ρ) was measured by the water-volume displacement method (n = 1 per phantom type).
Thermal simulations
SARSIM patterns generated with the output estimated acoustic properties (∝a and c) were loaded into a 3D finite-difference thermal solver of the Penne’s bio-heat equation and compared to the corresponding experimental temperature data. The values for thermal diffusivity (ψ), specific heat (cp), and density (ρ) reported in were used as inputs for each milk concentration. Temperature simulations were subsampled to match the temporal resolution of the experimentally acquired data (3.625 s), and spatial resolution was matched to the SARSIM patterns (0.5 × 0.5 × 1 mm).
Table 2. Percent difference of estimated acoustic properties from measured values.
Statistics
The root-mean-squared difference (RMSD) of SARANA and SAREXP data in comparison to SARSIM was calculated according to
(9)
where xana/exp and xsim represent analytical or experimental and simulated data points respectively, and N represents the total number of voxels used in the calculation. The RMSD was calculated in the longitudinal direction over a 1 × 1 × 13-voxel volume centred at the focus; and in the transverse direction over a 13 × 1 × 1-voxel volume centred at the focus at all-time points.
The normalised (RMSDN) between the simulated and experimental 3D temperature profiles for a given milk concentration was calculated according to the following:
(10)
where xsim and xexp are the mean temperature profiles (n = 3) of the simulated and experimental data, which are normalised by Texp, the maximum mean experimental temperature rise. WG is the same Gaussian weighting function defined previously and N is the number of voxels included in the summation. The RMSDN at each time (t) was summed over heating (5 time-points), cooling (5 time-points) and total time (10 time-points).
Results
Thermal and acoustic property averages and standard deviations as measured via independent techniques are summarised in . Thermal diffusivity, conductivity and specific heat values had no apparent trend as a function of milk concentration, and standard deviations were found to be within the manufacturer reported error of ±10% of the KD2 thermal probe. As measured by through-transmission, acoustic attenuation and speed of sound increased by 303% and 2.28% as a function of milk concentration, respectively. While the change in speed of sound was similar to that seen in ex vivo soft tissue due to temperature rise in HIFU ablative ranges (∼37–75 °C), the change in acoustic attenuation was three times larger than expected for soft tissue [Citation7,Citation10,Citation12,Citation13]. However, the lowest absorption value was much lower than reported in soft tissue [Citation34]. Absolute values of all other measured thermal and acoustic properties fell within the range of reported literature values for soft tissues [Citation34].
Three trials of the HIFU sonications were performed on each phantom type of a given milk concentration, with each trial employing a new phantom. In turn, each trial used one of two transducer power levels: 4.1 and 6.2 acoustic watts. Temperature curves for the voxel with the peak temperature rise in the three transverse slices with the greatest temperature rise (centred near the beam focus) are shown in . The data points represent the average and standard deviation of three trials (n = 3) for each phantom type, and demonstrate the expected increase in peak temperature rise for both increasing milk concentration and acoustic power output. The peak temperature rise achieved in the various samples ranged from 2.72 to 11.79 °C for 6.2-W output power and 1.60 to 7.87 °C for 4.1-W output power. The standard deviation of the temperature profiles between trials (n = 3) ranged from 0.01 to 0.77 °C, and on average was 3.4% of the temperature rise in each phantom type. Therefore the heating in the phantoms was considered repeatable across trials. The temperature rise for the 4.1-W sonication in the 10% milk concentration resulted in insufficient SNR to calculate SARANA; therefore, this data set was removed from calculations of SAREXP and estimated acoustic properties. Throughout heating, the bulk temperature of the phantoms remained stable (21.0 ± 1.0 °C). The standard deviation of the background MRTI data was measured to be ±0.05 °C.
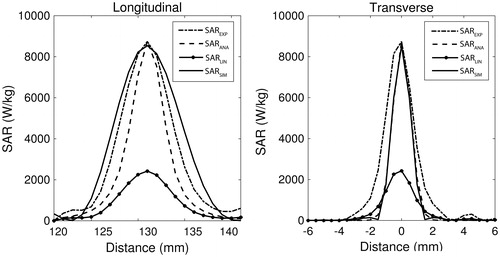
shows a representative example of the hybrid experimental SAR calculation for one trial. The SARLIN, SARANA, and SAREXP patterns are shown in comparison to the optimised simulated pattern, SARSIM (solid), in both the longitudinal and transverse central planes. In the longitudinal plane, SAREXP is significantly longer than SARANA, and on average results in 61% less difference when compared to SARSIM (RMSD =1.46 × 10³ and 0.57 × 10³ W kg −1 for SARANA and SAREXP respectively, n = 21). In the central transverse plane, the converse is true, with SARANA matching the SARSIM pattern width more closely than SAREXP (RMSD = 0.50 × 10³ and 1.07 × 10³ W kg −1 for SARANA and SAREXP respectively, n = 21). The average computation time for the 3D SARANA was 1.5 min per slice, while the computation time of SARLIN and SAREXP was <2 s per volume (4 CPU; Intel® Xeon E5620 at 2.4 GHz; 96.00 GB RAM).
Figure 4. Typical longitudinal and transverse views of, and SAREXP, SARANA, and SARLIN compared to the optimised HAS simulation SARSIM (solid). Data are from a single sonication at 6.2 W into a 50% milk phantom.
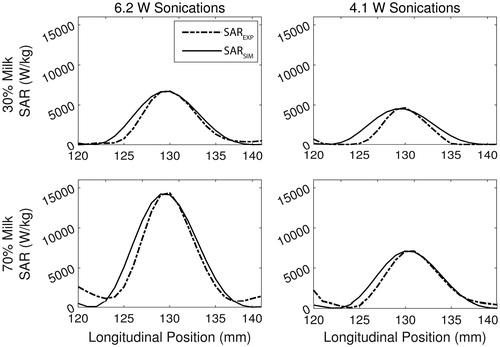
Examples of the resulting curves from the estimation routine are given in , where the optimised SARSIM curves are shown in comparison to their respective SAREXP curves for one trial in 30% and 70% milk phantoms at both 4.1 W and 6.2 W. In the longitudinal plane, the location of the maximum SAR in the experimental SAREXP patterns and the HAS-generated SARSIM patterns align well as expected, with SARSIM having a slightly longer curve. The average computation time of the estimation routine was 3.3 min per trial (4 CPU; Intel® Xeon E5620 at 2.4 GHz; 96.00 GB RAM).
Figure 5. Example plots showing the longitudinal view of the SARSIM fit (solid) to the SAREXP (dashed) for the 30% (top row) and 70% (bottom row) milk phantom at 6.2 W (left) and 4.1 W (right).
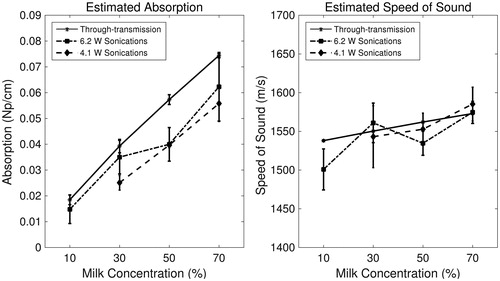
Using the SARSIM curves found during the estimation routine, the measured acoustic absorption at 1 MHz and the speed of sound were estimated in the phantoms non-invasively. The acoustic properties, as determined by the estimation routine and independently by through-transmission, are plotted as a function of phantom milk concentration in . Both acoustic attenuation and speed of sound follow a linear increasing trend with milk concentration, matching the through-transmission trends. The linear regression slopes using the 6.2-W and 4.1-W sonications for the estimated absorption coefficient and for the measured attenuation coefficient were 7.0 × 10⁻⁴, 8.0 × 10⁻⁴, and 9.0 × 10 −4 Np cm−1 %milk−1, respectively. However, estimated values of ∝a were consistently lower than the measured attenuation values for all data points by an average of 21.4% (). The linear regression slopes for estimated speed of sound with 6.2-W and 4.1-W sonications, and for measured speed of sound were 0.98, 1.04, and 0.58 m s −1 %milk −1, respectively. These values were estimated within 1% on average of the through-transmission speed of sound values ().
Figure 6. Non-invasively estimated acoustic property values (absorption coefficient at 1 MHz and speed of sound) obtained via the optimisation routine for 6.2-W (dotted, squares) and 4.1-W (dashed, diamonds) sonications compared to values obtained via through-transmission (solid, stars), plotted as a function of milk concentration. Error bars depict ± one standard deviation (n = 3).
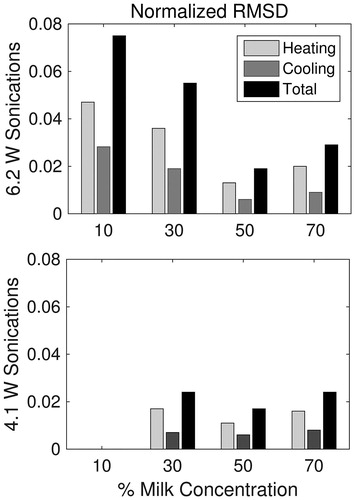
Averaged simulated (solid) and experimental (dashed) temperature profiles in 70% milk phantoms are shown for 4.1- and 6.2-W sonications in . The temporal, transverse and longitudinal curves are centred at the focus of the average 3D profile for the 70% milk phantom (n = 3; errors bars depict one standard deviation). On average, the peak temperature rise was over-estimated by 1.8 °C using simulations from higher powered sonications, and 0.4 °C on average using simulations from lower powered sonications across all trials (n = 21). The calculated RMSDN of the thermal simulations using optimised SARSIM are summarised in . The amplitudes of the temperature profiles are a direct result of the estimated absorption values shown in . In general, the difference between simulated and experimental temperature profiles decreased up to 50% milk concentration, before increasing slightly at 70% milk concentration. In the higher absorbing phantoms, both sonication powers resulted in comparable RMSDN.
Figure 7. Example plots of temperature simulations in the 70% milk phantom for 6.2-W (top row) and 4.1-W (bottom row) sonications. Solid curves were simulated using the estimated acoustic property values optimised from SAREXP. Dashed curves are the experimental temperature curves obtained with MRTI. All curves are a mean (n = 3), with error bars depicting ± one standard deviation. Error bars were omitted from the experimental curves for figure clarity.
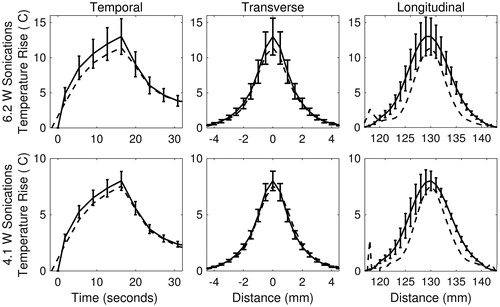
Figure 8. RMSD (unit-less) of the temperature simulations to experimental temperature data, normalised by the maximum temperature rise in the experimental data. Heating RMSDN is calculated over heating time points only, cooling RMSDN over cooling time points only, and total RMSDN is over all time points. (Thermal simulations of 10% milk at 4.1 W sonications were not included due insufficient temperature rises for SAR calculation.)
Discussion
The non-invasive property estimation technique described in this work was successful in measuring relative changes in acoustic absorption and absolute values of speed of sound in tissue-mimicking phantoms. Absolute values of speed of sound were estimated with high accuracy (average absolute error of 1.0%), while estimated values of acoustic absorption were consistently lower than the measured attenuation values (, average absolute error of 21.4%). Although the role of acoustic attenuation due to scattering was assumed negligible in this study, the effects of scattering most likely partially explain the disparity between the estimated absorption and the measured attenuation values. Another explanation may be dynamically changing acoustic properties, since the homogeneous gelatine phantom in this study melts at approximately 30 °C. While the bulk phantom temperature remained constant at approximately 21 °C during all HIFU sonications, local melting of the phantom likely occurred, particularly in the 50% and 70% where temperature rise exceeded 9 °C. Liquid phase gelatine and milk phantoms likely have a lower absorption due to decreased viscosity [Citation35], which could explain the lower absorption estimates as the temperature rise from the sonication increased.
Despite the underestimation of acoustic absorption in gelatine phantoms, this technique successfully detected relative changes in absorption and speed of sound as function of milk concentration. The rates of change as a function of milk concentration as estimated through optimisation were similar to those of the through-transmission data. In this study, the smallest change in absorption detected was 47%, between the 10% and 30% milk phantom. Since acoustic attenuation has been known to increase 60–100% in tissue post-HIFU ablation, this technique could have sensitivity necessary to detect in vivo tissue changes due to HIFU treatment [Citation7,Citation10,Citation12,Citation13].
As with many optimisation problems, the accuracy of the output value may depend on the weighting of the SSD calculation. The estimation of speed of sound values was particularly sensitive to the Gaussian weighting scheme used in this study, which was designed to match the FWHM of the transducer beam. The resulting average difference (0.98%) in the estimated speed of sound values for all trials was less than the 1–3% expected change in speed of sound in soft tissue as a function of temperature [Citation8,Citation10,Citation11], but not by a large margin. By reducing the variance of the Gaussian weighting in the longitudinal direction, a greater proportion of the calculated difference rests over the peak of the curve, improving the alignment and match of the experimental and simulated curves. Therefore, while a less conservative scheme was implemented here in order to better mimic the conditions that would be experienced in an in vivo environment, the shape may be altered to allow for more accurate results for both speed of sound and absorption. However, care must be taken to consider the quality of MRTI data before altering the weighting scheme, since using a smaller number of voxels in the estimation routine increases the effect of noise in the MRTI data.
The knowledge of precise acoustic property values can be used to predict temperature rises during HIFU treatment planning. In this study, the estimated absorption and speed of sound values for each trial were used to generate SARSIM using HAS, which was then loaded into the forward temperature solver and compared to the experimental temperature profile ( and ). The simulated peak temperatures were within 0.1–2.6 °C of the experimental peaks, demonstrating that this technique can predict temperature rises in low-powered sonications with an average error of 21% (n = 21). Also, the RMSDN, normalised by peak temperature, decreased with higher absorbing phantoms and consequently with higher temperature rise (. While the RMSDN of the heating portion of the temperature curves is likely due to a mismatch in the true and estimated acoustic absorption, the difference in the cooling portions would be a result of thermal diffusion mismatch. Therefore, while the peak temperatures may be overestimated slightly in the thermal predictions, the overall spatial temperature profile matches well to the experimental profile near the focus, which is important for predicting lesion size in HIFU ablations.
In addition to acoustic properties, the ability to simultaneously estimate thermal properties during MRgHIFU ablations would be valuable for improving the safety and efficiency of the treatment. Temperature dependence of thermal conductivity, specific heat, and thermal diffusivity in soft tissue has been observed in soft tissues, with values varying by 20–40% over the range of 35–90 °C [Citation36–38]. Multiple methods have been proposed to measure thermal conductivity or thermal diffusivity in vivo using MRgHIFU systems with errors near 10% [Citation39–43], which could easily be combined with the current technique for simultaneous thermal and acoustic property estimation. Although thermal diffusivity was independently measured in this study, the analytical SAR calculation utilised is capable of estimating this property during the 3-parameter fit to the temperature data [Citation41]. A previous study using the analytical SAR method reported a standard deviation of estimated values that was 15% of the mean in in vivo rabbit muscle. With this estimation routine, ±15% error in the thermal diffusivity translates to a respective +28/−36% change in absorption values compared to the independently measured value for thermal diffusivity. However, changes in the speed of sound values are relatively small (+0.23/−0.18%) since thermal diffusivity has the greatest effect on the magnitude, not the shape or location, of the experimental SAREXP pattern. Despite the resulting error for acoustic absorption, this method for non-invasively estimating thermal diffusivity still provides a technique which is less susceptible to low signal-to-noise in MRTI than other published techniques and is important for in vivo applications [Citation39,Citation41,Citation42].
The hybrid experimental SAREXP was incorporated for this estimation routine to address the issue of longitudinal beam registration, while maximising the number of voxels which could be used in the sum of squared difference calculation. By broadening the shape of SAREXP in the longitudinal direction, the difference between the longitudinal experimental and simulated patterns was reduced by 61% on average when compared to SARANA. Since the scaling factor was applied uniformly in three dimensions, SAREXP was much broader than SARSIM in the transverse direction. Although experimental SAREXP resulted in a distorted pattern shape in the transverse direction, the correction of the longitudinal profile was critical for improving accuracy of the acoustic property estimation technique. Ultimately, the scaling in the transverse direction had little effect on the sum of squared difference due to the Gaussian weighting scheme that directly reflected the HIFU beam shape in water. Overall, the experimental SAREXP pattern allowed for greater specificity in speed of sound estimates, and reduced the effect of underestimated HAS patterns, improving absorption estimates.
The purpose of this study was to validate a technique in a verifiable model under ideal MR scanning conditions. Thus, several considerations are necessary for translating this technique into clinical practise. Current clinical MR thermometry is acquired at a lower resolution than the data in this study, and typically in 2D rather than 3D. The greatest implication of a lower resolution is spatial averaging, which can lower the measurement of peak temperature rise, particularly in the transverse plane, ultimately resulting in an underestimation of the acoustic absorption. Also, a single 2D slice would greatly limit the accuracy of the speed of sound estimation, whereas multi-slice 2D may be satisfactory in comparison to 3D acquisition. Since receiver coils designed for specific body regions are not yet standard in clinical MRgHIFU, one would also expect the noise level in clinical MRgHIFU to be higher, in the range of ±1 °C. With decreased temperature measurement accuracy, a higher temperature rise may be necessary to accurately calculate the analytical SAR with repeatability. The temperature rise is certainly limited to non-damaging ranges, thus limiting maximum SAR; however, a noise level of ±1 °C is expected to be sufficient for in vivo application [Citation44]. In regards to computation time, the lengthiest step, assuming segmentation is performed pre-treatment, is the analytical SAR calculation. Computation time is directly related to the number of voxels implemented, thus lower resolution temperature data or fewer slices would decrease computation time. For the estimation routine, computation time is dependent on the number of estimated parameters and the defined searchable range, which could be reduced depending on expected outcomes. Additionally, more efficient optimisation techniques could be explored for improving computation time. Although the presented technique is currently optimised for application in homogeneous phantoms, the feasibility of its clinical application as a known trade-off between resolution, field-of-view, and temporal resolution should be assessed in future work.
Finally, for in vivo application, the complexity of the anatomy in the treatment region must be considered. First, for an inhomogeneous medium, tissue properties of the surrounding domains will likely be assigned from tables, and are a potential source of error in the HAS simulations. Alternatively, several tissues may be estimated simultaneously, but at the cost of increased computation time of the optimisation. Additionally, in vivo, the changing acoustic properties will occur in a localised region, and not uniformly as is the case in the phantoms used in this work. Therefore, an additional domain will need to be generated to represent the estimated treated volume of the targeted tumour. Property changes in vivo are expected to be more complex than those of the gelatine and milk phantoms. As the water content of tissue decreases during ablation, scatter and reflection may begin to a play a more pertinent role in ultrasound-tissue interactions in addition to absorption. Current work is underway to incorporate scattering into the HAS simulation technique used in this study [Citation45], which could help account for local tissue changes and also improve simulated SAR shapes. Further work is necessary to determine the in vivo sensitivity of this technique under standard clinical conditions.
Conclusion
This study has validated a MRgHIFU compatible technique that non-invasively measures differences in acoustic absorption and speed of sound of homogenous tissue-mimicking phantoms. Speed of sound values were estimated with 1% error on average. While relative differences in acoustic absorption were well represented using known thermal properties, absolute values were on average 21% lower than the measured acoustic attenuation obtained by through-transmission. Estimated properties were used in thermal predictions and matched well when compared to the experimental temperature profiles achieved with HIFU sonications. Future studies will be conducted to determine this method’s sensitivity to property changes in soft tissues and will expand on feasibility of this technique for in vivo applications to measure absolute and relative values of tissue properties before and during HIFU ablation treatments.
Acknowledgements
The authors would like to acknowledge Alexis Farrer for her work on phantoms and insights that allowed for the completion of this study.
Disclosure statement
The authors report no conflicts of interest.
References
- Napoli A, Anzidei M, Ciolina F, et al. MR-guided high-intensity focused ultrasound: current status of an emerging technology. Cardiovasc Intervent Radiol 2013;36:1190–203.
- Sinden D, Haar G. Dosimetry implications for correct ultrasound dose deposition: uncertainties in descriptors, planning and treatment delivery. Transl Cancer Res 2014;3:459–71.
- Sapareto SA, Dewey WC. Thermal dose determination in cancer therapy. Int J Radiat Oncol Biol Phys 1984;10:787–800.
- Huang CW, Sun MK, Chen BT, et al. Simulation of thermal ablation by high-intensity focused ultrasound with temperature-dependent properties. Ultrason Sonochem 2015;27:456–65.
- El-Brawany MA, Nassiri DK, Terhaar G, et al. Measurement of thermal and ultrasonic properties of some biological tissues. J Med Eng Technol 2009;33:249–56.
- Mcdannold N, Tempany CM, Fennessy FM, et al. Uterine leiomyomas: MR imaging–based thermometry and thermal dosimetry during focused ultrasound thermal ablation 1. Radiology 2006;240:263–72.
- Damianou CA, Sanghvi NT, Fry FJ, Maass-Moreno R. Dependence of ultrasonic attenuation and absorption in dog soft tissues on temperature and thermal dose. J Acoust Soc Am 1997;102:628–34.
- Gertner MR, Wilson BC, Sherar MD. Ultrasound properties of liver tissue during heating. Ultrasound Med Biol 1997;23:1395–403.
- Clarke RL, Bush NL, Ter Haar GR. The changes in acoustic attenuation due to in vitro heating. Ultrasound Med Biol 2003;29:127–35.
- Worthington AE, Sherar MD. Changes in ultrasound properties of porcine kidney tissue during heating. Ultrasound Med Biol 2001;27:673–82.
- Techavipoo U, Varghese T, Chen Q, et al. Temperature dependence of ultrasonic propagation speed and attenuation in excised canine liver tissue measured using transmitted and reflected pulses. J Acoust Soc Am 2004;115:2859–65.
- Choi MJ, Guntur SR, Lee JM, et al. Changes in ultrasonic properties of liver tissue in vitro during heating-cooling cycle concomitant with thermal coagulation. Ultrasound Med Biol 2011;37:2000–12.
- Kemmerer JP, Oelze ML. Ultrasonic assessment of thermal therapy in rat liver. Ultrasound Med Biol 2012;38:2130–7.
- Ghoshal G, Luchies AC, Blue JP, Oelze ML. Temperature dependent ultrasonic characterization of biological media. J Acoust Soc Am 2011;130:2203.
- Meaney P, Clarke R. A 3-D finite-element model for computation of temperature profiles and regions of thermal damage during focused ultrasound surgery exposures. Ultrasound Med Biol 1998;24:1489–99.
- Prakash P, Diederich CJ. Considerations for theoretical modelling of thermal ablation with catheter-based ultrasonic sources: implications for treatment planning, monitoring and control. Int J Hyperthermia 2012;28:69–86.
- Rahimian S, Tavakkoli J. Estimating dynamic changes of tissue attenuation coefficient during high-intensity focused ultrasound treatment. Rahimian Tavakkoli J Ther Ultrasound 2013;1:14.
- Bevan PD, Sherar MD. B-scan ultrasound imaging of thermal coagulation in bovine liver: log envelope slope attenuation mapping. Ultrasound Med Biol 2001;27:809–17.
- Zhang S, Wan M, Zhong H, et al. Dynamic changes of integrated backscatter, attenuation coefficient and bubble activities during High-Intensity Focused Ultrasound (HIFU) treatment. Ultrasound Med Biol 2009;35:1828–44.
- Vaezy S, Shi X, Martin RW, et al. Real-time visualization of high-intensity focused ultrasound treatment using ultrasound imaging. Ultrasound Med Biol 2001;27:33–42.
- Lemor RM, Hoss M, Peter L, et al. Three dimensional ultrasonic monitoring of interstitial thermal tumor therapies: in vivo results. IEEE Symp Ultrasonics 2003;2:1284–7.
- Azuma T, Sasaki K, Kawabata K, Umemura S. Tissue expansion imaging for tissue coagulation mapping during high intensity focused ultrasound therapy. Proceedings of the IEEE Ultrasonics Symposium 2006. Vancouver, BC. pp 1770–3.
- Parker KJ. Effects of heat conduction and sample size on ultrasonic absorption measurements. J Acoust Soc Am 1985;77:719–25.
- Morris H, Rivens I, Shaw A, ter Haar G. Measurement of acoustic attenuation and absorption coefficients using thermometry. AIP Conference Proceedings [Internet]. 2007. p. 138–43. Available from: http://scitation.aip.org/content/aip/proceeding/aipcp/10.1063/1.2744264
- Duback DW, Brien WDO. An automated system for measurement of absorption coefficients using the transient thermoelectric technique. IEEE Ultrasonnics Symposium. 1979. New Orleans, LA. pp 388–91.
- Yuan J, Mei C-S, Panych LP, et al. Towards fast and accurate temperature mapping with proton resonance frequency-based MR thermometry. Quant Imaging Med Surg 2012;2:21–32.
- Guy AW, Lehmann JF, Stonebridge JB. Therapeutic applications of electromagnetic power. Proc IEEE 1974;62:55–75.
- Dillon CR, Vyas U, Payne A, et al. An analytical solution for improved HIFU SAR estimation. Phys Med Biol 2012;57:4527–44.
- Vyas U, Christensen D. Ultrasound beam simulations in inhomogeneous tissue geometries using the hybrid angular spectrum method. IEEE Trans Ultrason Ferroelectr Freq Control 2012;59:1093–100.
- Farrer AI, Odéen H, de Bever J, et al. Characterization and evaluation of tissue-mimicking gelatin phantoms for use with MRgFUS. J Ther Ultrasound 2015;3:9.
- Maruvada S, Harris GR, Herman BA, King RL. Acoustic power calibration of high-intensity focused ultrasound transducers using a radiation force technique. J Acoust Soc Am 2007;121:1434–9.
- Zeqiri B, Scholl W, Robinson SP. Measurement and testing of the acoustic properties of materials: a review. Metrologia 2010;47:S156–S71.
- Le LH. An investigation of pulse-timing techniques for broadband ultrasonic velocity determination in cancellous bone: a simulation study. Physics Med Biol 1998;43:2295–308.
- Cameron J. Physical properties of tissue. A comprehensive reference book, edited by Francis A. Duck. Med Phys 1991;18:834.
- Parker NG, Povey MJW. Ultrasonic study of the gelation of gelatin: phase diagram, hysteresis and kinetics. Food Hydrocoll 2012;26:99–107.
- Bhattacharya A, Mahajan RL. Temperature dependence of thermal conductivity of biological tissues. Physiol Meas 2003;24:769–83.
- Guntur SR, Lee K, Il Paeng D-G, et al. Temperature-dependent thermal properties of ex vivo liver undergoing thermal ablation. Ultrasound Med Biol 2013;39:1771–84.
- Choi J, Morrissey M, Bischof JC. Thermal processing of biological tissue at high temperatures: impact of protein denaturation and water loss on the thermal properties of human and porcine liver in the range 25–80 °C. J Heat Transfer 2013;135:06132.
- Cheng H-LM, Plewes DB. Tissue thermal conductivity by magnetic resonance thermometry and focused ultrasound heating. J Magn Reson Imaging 2002;16:598–609.
- Zhang J, Mougenot C, Partanen A, et al. Volumetric MRI-guided high-intensity focused ultrasound for noninvasive, in vivo determination of tissue thermal conductivity: Initial experience in a pig model. J Magn Reson Imaging 2013;37:950–7.
- Dillon CR, Payne A, Roemer RB. The accuracy and precision of two non-invasive, magnetic resonance-guided focused ultrasound-based thermal diffusivity estimation methods. Int J Hyperth 2014;30:361–71.
- Dragonu I, de Oliveira PL, Laurent C, et al. Non-invasive determination of tissue thermal parameters from high intensity focused ultrasound treatment monitored by volumetric MRI thermometry. NMR Biomed 2009;22:843–51.
- Dillon CR, Borasi G, Payne A. Analytical estimation of ultrasound properties, thermal diffusivity, and perfusion using magnetic resonance-guided focused ultrasound temperature data. Phys Med Biol 2016;61:923–36.
- Dillon CR, Christensen DA, Roemer RB, et al. Effects of MRTI sampling characteristics on estimation of HIFU SAR and tissue thermal diffusivity. Phys Med Biol 2013;58:7291.
- Christensen DA, Almquist S. Incorporating tissue absorption and scattering in rapid ultrasound beam modeling. SPIE Proceedings. 2013. p 8584.