
Abstract
Objectives: To determine whether combining microbubbles (MBs) with diagnostic ultrasound (US) at a high mechanical index (MI) could enhance the microwave (MW) ablation of tumours.
Materials and methods: Five therapeutic MW adjuvant protocols were studied: MW, MW + US, MW + US + MB, MW + US + NS (saline) and MW + MB. In 30 normal rabbit livers, the synergistic effects were evaluated via temperature, necrosis volume and histology. In 90 VX2 rabbit hepatic tumours, residual cells in the peripheral ablated tumours were examined via immunohistochemical assay and tumour growth. Additional 40 VX2 hepatic tumours were evaluated for ablation safety via blood assay and weight and for survival to 105 days. Results were compared using analysis of variance.
Results: Compared with the other protocols, the ablation volumes in normal rabbit livers were significantly larger using the MW + US + MB protocol (p < .001). The histological examination was consistent with more efficient ablation in that protocol. In detecting residual cells, the apoptotic index was higher, the proliferating index was lower (p < .05), tumour growth was significantly smaller (p < .001), and the rabbits of the MW + US + MB T-Group survived longer (p < .05) than those of the other groups. Additionally, no damage to the liver function or blood cells was found in any of the protocols after ablation (p < .05).
Conclusions: MBs in combination with diagnostic US at a high MI showed potential synergy in the MW ablation of tumours in rabbits.
Introduction
Ultrasound (US)-guided microwave (MW) ablation is one of the most promising percutaneous therapeutic modalities in the treatment of many solid neoplasm types, including liver [Citation1,Citation2], kidney [Citation3,Citation4], pancreas [Citation5], lung [Citation6], and bone [Citation1,Citation7] carcinomas, as well as soft-tissue tumours of the breast, adrenal and thyroid glands [Citation8]. However, incomplete ablation and subsequent neoplasm recurrence remain frequent in tumours greater than 3–5 cm in diameter [Citation9,Citation10]. Hence, it is highly desirable and challenging to enhance tumour destruction in the peripheral zone, where a largely reversible cell damage is usually produced by only mildly elevated tissue temperatures of 41 °C–45 °C [Citation11].
Recently, combining conventional therapies with thermal ablation has demonstrated increased tumour destruction. For example, the intravenous administration of liposomal doxorubicin as a chemotherapeutic agent increased apoptosis in the peripheral ablation zone [Citation12,Citation13], and integration of radiation therapy with thermal ablation sensitises the tumour cells to a subsequent oxygenation increase [Citation14,Citation15]. Unfortunately, the inherent disadvantages of chemotherapy and radiotherapy, nausea, diarrhoea, constipation,and dizziness inevitably accompanied their use [Citation16]. Hence, alternative combinatorial strategies to augment ablation without increased patient risk and side effects would be highly desirable.
Research advances in microbubbles (MBs) as contrast agents have introduced a new field of ultrasonic theranostics [Citation17,Citation18]. The benefits of MBs as potential thermal ablation adjuvants accrue from their known cavitation ability combined with therapeutic sonication [Citation19–21]. However, in the intensity range of diagnostic US, MBs could also enhance drug and gene delivery owning to sonoporation with a reversible capability [Citation22]. Given these potentially beneficial properties, we postulate a novel hypothesis that a combination of MBs and diagnostic US at a high mechanical index (MI) will produce more efficient MW ablation of tumours. If this hypothesis were true, it would be more practical and portable for clinical US-guided MW ablation without utilising other therapeutic US systems. Therefore, the aim of this study was to evaluate the enhancement of combining MBs and diagnostic US at a high MI for the MW ablation of hepatic tumours.
Materials and methods
Animals and tumour models
All of the protocols for New Zealand white rabbits (1.8–2.3 kg; aged 2–3 months) were approved by the animal research ethics committee of Chongqing Medical University. The rabbit models bearing VX2 hepatic tumours were created by implanting a tumour fragment (1 × 1 × 1 mm) into the liver by open laparotomy according to previously established procedures [Citation23]. The VX2 rabbits were used for experiments after the tumour volume reached to 1500 mm3 (3–4 weeks after implantation). The tumour volume was monitored by ultrasonography and was calculated as V = 0.5 × L × W2 (V: volume; L: length; W: width) [Citation24].
US-guided MW ablation
Microwave ablation was performed using a 2450 ± 50 MHz microwave generator (ECO-100, ECO Medical, Nanjing, China) with a 10-cm-long cool-tip antenna (15 gauge). Distilled water at room temperature was circulated into the dual channels inside the antenna by a peristaltic pump. Rabbits were intravenously anaesthetised with 3% pentobarbital solution (1 mL/kg) and were exposed the left-middle hepatic lobe with a median incision for US-guided MW ablation. The commercial clinical US system (Mylab 90, Esaote, Genoa, Italy) with an LA523 linear transducer (4–13 MHz) was used to guide the MW antenna accurately into the tissue targets. After ablation, the sutured and recovered rabbits were treated daily with penicillin for 3 days (500 000 units IM) to prevent infection.
Diagnostic US with high MI
The same transducer (LA523) positioned on the liver surface with 0.5-cm-thick couplants was continuously swept in the General/Contrast dual-imaging mode. Sonication was exposed at the highest output power corresponding to an MI of 1.2 with a centre frequency of approximately 8.0 MHz (as indicated on the screen of the clinical US system), using the same imaging condition with a depth of 2 cm and a single focus of 1.5 cm. The peak negative pressure of 3.2 MPa in the focus was measured by needle hydrophone (PVDF-Z44–0400, Specialty Engineering Associates, Sunnyvale, CA). During intermittent intervals, a 1-s exposure period consisted of US sweeping at an MI of 0.08 was used i.e. the duty cycle was 60%, to allow contrast refill for perfusion imaging.
Experimental design
A flow chart of the experimental design is shown in . Each of the five treatment groups (T-Group) contained n = 6 normal rabbits without hepatic tumours, and n = 26 VX2 hepatic tumour rabbits. Ultrasound with a high MI was applied simultaneously to the livers with MW as follows: T-Group I, MW only; T-Group II, MW + US; T-Group III, MW + US in the presence of MBs; T-Group IV, MW + US in the presence of NS (normal saline); and T-Group V, MW only in the presence of MBs.
Figure 1. Schematic diagram for the study design.
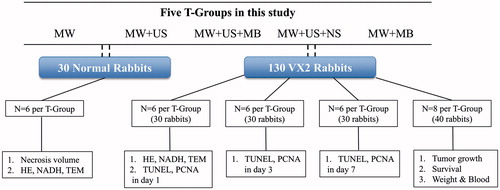
Regarding the thickness of the rabbit livers (≤ 12–15 mm) and the volume (1500 mm3) of VX2 tumours chosen, normal livers were ablated at 25 W for 1 min, but VX2 rabbits were ablated at 20 W for 1 min to achieve the incompletely ablated tumour models, according to the data in our preliminary experiment as supplied in the Supplemental Tables 1 and 2.
Before MW ablation, MBs or NS were administered to T-Groups III and V or IV via intravenous bolus injections through the ear vein at a dose of 0.05 mL/kg, which was within the range specified for clinical use. MBs with a phospholipid shell containing octafluoropropane [mean diameter, 1.18 ± 0.33 μm; concentration, (2.31 ± 0.24) × 108/mL] were prepared using the thin film hydration method [Citation25] and were characterised by optical microscopy and dynamic light scattering and haemocytometers as described in the Supplemental Data.
Microwave ablation was then performed after the MBs appeared on the ultrasonography (typically 15 s after the intravenous administration of MBs). Simultaneously, US energy at a high MI of 1.2 was exposed for 1 min in T-Groups II, III and IV to burst as many MBs as possible in the ablation realm.
Synergistic ablation
During ablation a T/J/K-type thermocouple probe (FLE5000; Fenle Electronics, Hangzhou, Zhejiang, China) with a diameter of 0.5 mm and covered by a stainless steel sheath was penetrated 5-mm apart from the centre of the ablation area along the horizontal axis to avoid the interference of MW radiation and US sonication. The temperature variance in normal rabbit livers and VX2 rabbit tumours (n = 6 in each T-Group) was recorded every 20 s.
After ablation, a sample of necrotic tissue was removed from each ablated normal rabbit liver after euthanisation. These 30 samples underwent macroscopic examinations. The tissue volume of necrosis was calculated by the consensus of two observers using the following formula: V = π/6 × L × W × D (V: volume; L: length; W: width; D: depth) [Citation26].
After that, the ablated tissues from 5 mm along the horizontal axis of the radiation source were harvested from the 30 normal rabbits for pathological examination. (This is the transition zone identified by its pink colour in T-Group I.) Six of the 26 VX2 rabbits from each T-Group were also sampled this way. Pathological examination of these 60 tissue samples was with haematoxylin and eosin (HE) staining and nicotinamide adenine dinucleotide hydrogen (NADH) staining [Citation27]. Furthermore, 1-mm3 tissue samples were excised to observe ultra-structural changes in the targeted region by transmission electron microscopy (TEM; Hitachi 7500, Tokyo, Japan) [Citation23].
Therapeutic response of the residual tumour after ablation
From each VX2 rabbit T-Group, six rabbits per time point were euthanised immediately (within 2 h, referred to as 1 d), 3 d and 7 d after ablation. Tissue samples situated in the peripheral tumour regions were obtained as described above for immunohistochemical staining to assess the apoptotic and proliferative properties of the residual tumour cells. Both the transition zone samples and peripheral zone samples at 1 d were harvested from the same six VX2 rabbits of each T-Group (). We used the terminal deoxynucleotidyl transferase (TdT)-mediated dUTP nick end labelling (TUNEL) assay and the proliferating cell nuclear antigen (PCNA) assay [Citation28]. The nuclei of apoptosis-positive cells and proliferation-positive cells appeared brown in the TUNEL and PCNA assays. The apoptotic index (AI) and proliferating index (PI) were calculated through reading the brown cells in five selected fields at 400 × magnification microscopy by the consensus of two observers.
In the last 40 VX2 rabbits (n = 8 per T-Group), during the follow-up period after ablation, tumour size was identified by the consensus of two observers using US every three days until the ninth day.
Safety assessment
Finally, 40 VX2 rabbits as described in the section “Therapeutic response of the residual tumour after ablation” were also analysed for ablation safety. At two time points one day before and on the ninth day after ablation, the weights were measured and blood specimens were drawn from the ear veins for liver function assays by measurement of alanine aminotransferase, ALT; aspartate transaminase, AST; alkaline phosphates, ALP; total protein, TP; and albumin, ALB; and for blood cell count by measurements of red blood cell, RBC; haemoglobin, HB; white blood cell, WBC; platelet, PLT. In addition, survival analysis was performed via observing rabbits daily to the endpoint of 105 days.
Statistical analysis
Measurement data are presented as the means ± standard deviation (SD). Normality was verified using the Kolmogorov-Smirnov test. Multiple comparisons were performed by one-way ANOVA followed by Tukey’s post-hoc test if the values passed a normality test. If the values did not pass a normality test (p < 0.05), one-way ANOVA was replaced by the nonparametric Kruskal-Wallis test followed by Dunn's post-test. Kaplan-Meier survival curves were generated for survival analysis using the log-rank test. Differences were considered statistically significant at p < 0.05 with 95% confidence intervals.
Results
Synergistic ablation
During ablation, the temperature rose in both normal rabbit livers and VX2 rabbit tumours in all T-Groups, as shown in and and . However, it increased faster and to the highest level in the MW + US + MB T-Group than in the other T-Groups (p < 0.001). In addition, the MW + US and MW + US + NS T-Groups also rose to higher temperatures than the MW and MW + MB T-Groups (p < 0.01). Regarding the necrosis volume (), similarly, no significant differences (p > 0.05) were found between the MW (277.9 ± 46.2 mm3) and MW + MB T-Groups (295.7 ± 45.2 mm3), and between the MW + US (624.4 ± 73.3 mm3) and MW + US + NS (700.5 ± 73.7 mm3) T-Groups. However, the combination of MW and US showed larger coagulation necrosis than MW ablation alone (p < 0.001). Additionally, the largest coagulation necrosis volume (1339.7 ± 92.4 mm3; p < 0.0001, all comparisons) was achieved in the MW + US + MB T-Group.
Figure 2. Evaluation of the effectiveness of MBs in combination with US for MW ablation (25 W, 1 min). (A) Temperature variances of normal rabbit livers (left) and VX2 rabbit tumours (right) during ablation among the T-Groups (n = 6). (B) Necrosis volume of the ablated tissues in rabbit livers among the T-Groups (p < .001 vs. MW + US T-Group; ***p < .001 vs. MW + MB T-Group; ****p < .0001 vs. every T-Group; #p > .05 vs. MW + US T-Group; ^p > .05 vs. MW T-Group; n = 6). (C) Digital photographs of the ablated liver tissues in normal rabbits in all T-Groups. The tissue carbonisation surrounding the antenna is shown in the ablative centre (arrow).
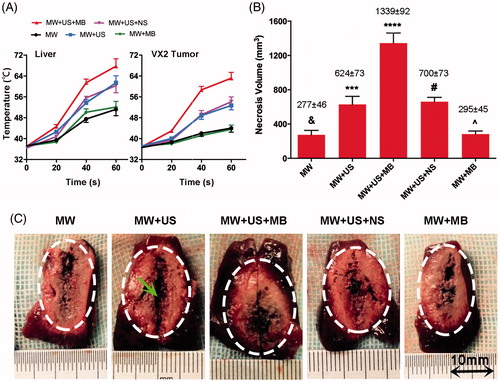
Table 1. The temperature variances during ablation among T-Groups on normal rabbits (°C).
Table 2. The temperature variances during ablation among T-Groups on VX2 rabbits (°C).
On microscopic examination of tissues in normal and VX2 rabbits, no significant ablation was observed in both MW and MW + MB T-Groups by HE and NADH staining ( and ). By contrast, the MW + US and MW + US + NS T-Groups displayed moderate damage of tissues including interstitial hyperaemia ( and ) and a necrotic boundary ( and ) between normal and necrotic regions. Obvious karyopyknosis and karyorrhexis ( and ) and no staining on NADH-stained images ( and ) were found in the MW + US + MB T-Group, indicating that more thorough necrosis was generated in this T-Group.
Figure 3. Microscopy images of selected tissue specimens in normal rabbit livers. (A) HE-stained images under the same magnification time (400 ×). Scale bar: 25 μm. (B) NADH-stained images under the same magnification time (40 ×). Scale bar: 250 μm. B1, B5, normal liver tissues are stained (black arrows). B3, non-staining is shown in the ablated zone (black arrow). B2, B4, black arrows represent the boundaries of necrosis (black arrows). (C) TEM images of the same magnification time (15 000 ×). Scale bar: 1.5 μm. C1, C5, integrated nuclear membrane and intact mitochondria (black arrows). C2, C4, swollen mitochondria and vacuolar degeneration (black arrows). C3, remnants of nuclear fragments and disappeared organelles (black arrows).
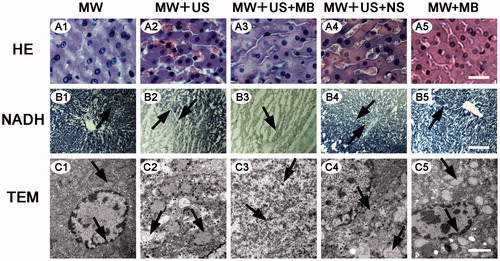
Figure 4. Microscopy images of selected tumour specimens in VX2 rabbit livers. (A) HE-stained images under the same magnification time (400 ×). Scale bar: 25 μm. A1, A5, mitosis of normal tumour nucleus (black arrows); A2, fragments of tumour nucleus (black arrow); A3, a mass of amorphous substance stained red homogeneously (black arrow); A4, interstitial hyperaemia and oedema (black arrow). (B) NADH-stained images of the same magnification time (400 ×). Scale bar: 25 μm. B1, normal tumour cells are stained (black arrow); B2, B4, sharp demarcations between the necrotic and non-necrotic regions (black arrows); B3, no staining in the ablated zone (black arrow). (C) TEM images. Scale bar: 5 μm. C1, C5, the integrated nuclear membrane (black arrows); C2, C4, obviously interrupted nuclear membrane (black arrows); C3, the cellular fragments in all around (black arrow).
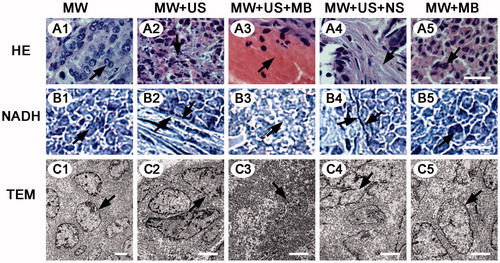
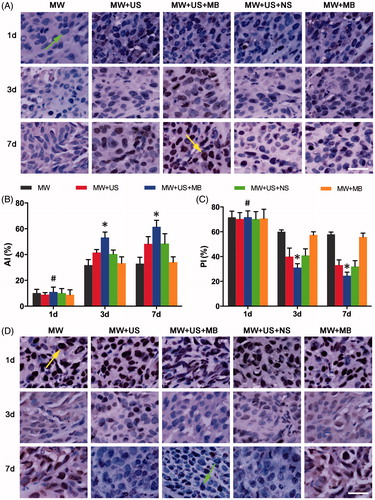
Figure 5. Immunohistochemical examination showing the enhanced cell death of residuals in the presence of MBs in combination with US after ablation. (A) TUNEL assay images of each T-Group in 1 d, 3 d and 7 d after ablation. Arrow (green) in the first line indicates a TUNEL negative cell, and arrow (yellow) in the third line indicates a TUNEL positive cell. (B) AI of each T-Group at different days after ablation (*p < .05, vs. the other T-Groups on the same day. #p > .05 vs. the other T-Groups in the same day. (C) PI of each T-Group at different days after ablation (*p < .05 vs. the other T-Groups on the same day. #p > .05 vs. the other T-Groups on the same day. (D) PCNA assay images of each T-Group 1 d, 3 d and 7 d after ablation. Arrow (yellow) in the first line indicates a PCNA positive cell, and arrow (green) in the third line indicates a PCNA negative cell. Magnification, 400×; scale bar, 25 μm.
Transmission electron microscopy was consistent with HE and NADH staining results in that the coagulative necrosis of tissue specimens was most evident in the MW + US + MB T-Group. In the MW and MW + MB T-Groups, both the mitochondria structure and nuclear membranes were intact ( and ). Comparatively, in the MW + US and MW + US + NS T-Groups, most of the cell membranes and nuclear membranes were interrupted or disintegrated, and organelles were destroyed, but some cell morphologies still existed ( and ). In the MW + US + MB T-Group; however, no distinct cell structure could be distinguished, most organelles disappeared, and only remnants of the nuclear fragmentation remained ( and ).
Therapeutic response of residual tumours after ablation
The effect on tissue in the peripheral zone after MW ablation was systematically investigated in all T-Groups. As shown in and , the apoptosis of residual tumour cells steadily increased during the 7 days after ablation. On the first day there were no significant differences in the apoptotic index (AI) among the five T-Groups (p > 0.05). A significantly higher AI in the MW + US + MB T-Group was exhibited on the third (53.2% ± 4.2) and seventh days (61.5% ± 5.0) (p < 0.05), compared with that in the other T-Groups. As expected, the assessment of proliferating residual cells was similar (, ), showing a steady decrease during this time and a significantly higher PI in the MW + US + MB T-Group on the third (31.1% ± 3.1) and seventh days (24.6% ± 2.9) (p < 0.05) than the other T-Groups but not on the first day (p > 0.05).
Table 3. The apoptotic index (AI) and proliferative index (PI) of residual tissue tumour cells in every T-Group.
In addition, a substantially higher antitumour effect starting from day 6 was detected in the MW + US + MB T-Group (p < 0.05; and ), than in the other T-Groups. The tumour volume in this T-Group increased to 5391.8 ± 783.5 mm3 at the time point of day 9, a value that was remarkably smaller (p < 0.001) than that in the MW (16 709.7 ± 1363.5 mm3), MW + US (7618.7 ± 1040.6 mm3), MW + US + NS (7810.2 ± 1815.9 mm3) and MW + MB (16495.0 ± 1011.4 mm3) T-Groups.
Figure 6. Growth inhibition of residual tumours and survival analysis in VX2 rabbits. (A) Ultrasonography of liver tumours in different T-Groups before and after ablation 3 d, 6 d and 9 d. Scale bar: 10 mm. (B) Tumour volume in each T-Group after ablation 3 d, 6 d and 9 d (#p > .05 vs. other T-Groups at day 0; &p > .05 vs. MW + US and MW + US + NS T-Groups at day 3; ^p < .01 vs. MW and MW + MB T-Groups at day 3; *p < .001 vs. other T-Groups at days 6 and 9, respectively; n = 8). (E) Cumulative survival of VX2 rabbits in different T-Groups after ablation (n = 8).
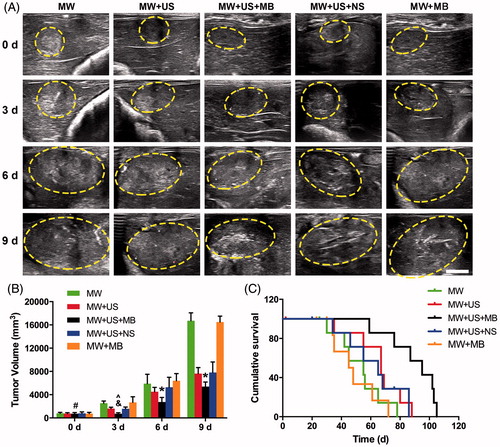
Table 4. The tumour volume (mm3) of VX2 rabbits during the follow-up post ablation.
Safety assessment
The results of the weight and blood assays including the liver function and blood cell count at two time points (one day before and the ninth day after ablation), are listed in . No significant differences were found between the two time-points in all T-Groups (p > 0.05), showing no detectable damage to the liver function and blood cells at these time-points.
Table 5. The results of the weight and the blood assay of VX2 rabbits before and after MW ablation.
Finally, the log-rank test revealed that the rabbits in the MW + US + MB T-Group survived significantly longer than that in the other T-Groups (p < 0.05, ). The numbers of rabbits that survived to the time point of 80 days were 0, 2 (25%), 1 (12.5%) and 0 in the MW, MW + US, MW + US + NS and MW + MB T-Groups, respectively. In comparison, it was observed that five rabbits (62.5%) in the MW + US + MB T-Group survived longer than 80 days.
Discussion
Microwave ablation is an emerging alternative to radiofrequency (RF) ablation, for its merits of a more homogeneous temperature distribution, and broader energy deposition, as well as less susceptibility to heat-sink effects in the tumour targets [Citation29]. To address the challenge of incomplete ablation and subsequent neoplasm recurrence; however, combinatory or synergistic strategies for MW ablation are still of great necessity. In the clinical practise of diagnostic US, a sequence of high MI sonications is frequently applied to destroy MB for diagnoses. Interestingly, a recent study concluded that the MB destruction could reduce tumour blood flow in mouse tumours using 5-MHz, 1.9-MI colour-Doppler pulses from a diagnostic system [Citation30], demonstrating the potential as an adjuvant for augmentation of thermal ablation.
In this study, to overcome the limitations of incomplete ablation in MW ablation, we tested a novel synergistic strategy using MB in combination with diagnostic US at a high MI of 1.2 for MW ablation not only to augment the coagulative necrosis, but also to destroy the residual tumours in VX2 rabbits.
From the start of this study, the most effective adjuvant to MW ablation could be found in the T-Group of MW + US + MB, a finding that is consistent with the findings of most temperatures increase in this group. Regarding the possible mechanisms by which MBs exposed to diagnostic US at a high MI induce heating during ablation, two factors may be involved: (1) due to gas bubbles decreasing the threshold of cavitation by sonication, heating was generated by the oscillation (stable cavitation) or explosion (inertial cavitation) of MB agents in the acoustic field [Citation31]; (2) there were many polar molecules (e.g. water) produced by tissue haemorrhaging, resulting from the cavitation in the ablation area [Citation32,Citation33]. These polar molecules helped to absorb the MW energy and convert them into heat [Citation34].
Regarding the findings of the most destruction of residual tumours in the T-Group of MW + US + MB, the underlying mechanisms may be as follows. (1) Based on the MBs exposed to diagnostic US at a high MI, the physical forces, including shock waves, microjets and microstreamings were generated [Citation31]. This phenomenon formatted poles on the cell surfaces and enhanced the permeability of cell membranes [Citation35], aggravating the cellular injuries of the sublethal (41 °C-45 °C) regions from reversible to irreversible damage. (2) The necrotic cells induced by thermal ablation or sonication treatment to trigger an antitumour-specific immune response were known via modulating various parameters, including heat shock protein (HSP) expression [Citation36,Citation37], cytokines and stress response [Citation37,Citation38], as well as cellular inflammatory processes [Citation38,Citation39]. This immunomodulation might be enhanced by the combinatorial strategy using MW ablation and MB exposed to diagnostic US at a high MI.
Additionally, US alone (MW + US T-Group) or combined with intravenous injection of saline (MW + US + NS T-Group) increased MW ablation efficiency compared with MW alone. This result may be caused by the free bubbles generated in situ by heating from MW irradiation. When US detects these free bubbles, a series of sonications may help to improve the MW ablation efficiency similar to that of MB-mediated sonication. However, MB alone (MW + MB T-Group) did not increase the size of the ablated areas because of the lack of sonication at the diagnostic US exposure without a high MI. This result was consistent with the findings of a prior published study, which showed that MB-alone adjuvants exposed to RF ablation did not increase the size of the ablated areas [Citation40].
To evaluate the potential syndrome risks on rabbits owning to MBs exposed to diagnostic US with a high MI [Citation32,Citation33], our findings of no damage to liver function and blood cells at the two time-points, and the longer survival of VX2 rabbits in the MW + US + MB T-Group demonstrate that the combinatorial strategy used exhibits a relatively good bio-safety. Furthermore, it has no radioactivity and chemotoxicity, compared with conventional combinations with radiotherapy [Citation14] and chemotherapy [Citation13]. This combinatorial strategy may, therefore, offer an alternative improvement for ablating liver, kidney or other focal neoplasms.
The key limitations of this study include the use of a single liver tumour model, the quantitative analysis of the MW and US parameters and MB dosage. Although the hepatic VX2 tumour model was chosen based on it being a widely applicable carcinoma in MW ablation, it is possible that the results will vary with other tumour types. The thickness of the rabbit liver is no more than 12–15 mm; thus, the ablation protocol parameters were different from those that could be chosen for human liver treatment. Finally, this is a pilot study with consequent limitations in the results of statistical analyses. Given these concerns, caution should be observed in the extrapolation of the results to larger animals and human use.
In conclusion, combining MBs with diagnostic US at a high MI could enhance MW ablation efficiency in rabbit models of VX2 hepatic tumours. This combinatorial strategy not only provides a distinctively augmentative destruction of the MW ablation of tumours but also exhibits a more efficient destruction of residual tumour cells to prevent recurrence in patients. This approach may, therefore, be beneficial in enhancing the US-guided MW ablation for clinical therapy. Further animal and human studies are required to confirm these results.
| Abbreviations | ||
| US | = | ultrasound |
| MW | = | microwave |
| MBs | = | microbubbles |
| NS | = | normal saline |
| MI | = | mechanical index |
| NADH | = | nicotinamide adenine dinucleotide hydrogen |
| HE | = | haematoxylin and eosin |
| TEM | = | transmission electron microscopy |
| TUNEL | = | terminal deoxynucleotidyl transferase (TdT)-mediated dUTP nick end labelling |
| PCNA | = | proliferating cell nuclear antigen |
| AI | = | apoptotic index |
| PI | = | proliferating index. |
Supplementary File
Download Zip (2.2 MB)Acknowledgments
We gratefully acknowledge the work of Prof. Michael F. Tweedle and Dr Li Gong of the Department of Radiology and James Comprehensive Cancer Centre, Ohio State University, USA to revise the writing and organisation of this manuscript. We gratefully acknowledge Li Zhou, MS, Zipeng He, MS, Fenfen Xu, MS, and Bin Zhang MS of the Chongqing Key Laboratory of Ultrasound Molecular Imaging, Chongqing Medical University, China for their work in the laboratory. We gratefully acknowledge the help provided by the State Key Laboratory of Ultrasound Engineering in Medicine Co-Founded by Chongqing and the Ministry of Science and Technology, China.
Disclosure statement
The authors declare no conflicts of interest.
Related Research Data
References
- Brace CL. (2009). Radiofrequency and microwave ablation of the liver, lung, kidney, and bone: what are the differences? Curr Probl Diagn Radiol 38:135–43.
- Amabile C, Ahmed M, Solbiati L, et al. (2016). Microwave ablation of primary and secondary liver tumours: ex vivo, in vivo, and clinical characterisation. Int J Hyperthermia 25. [Epub ahead of print]. doi:10.1080/02656736.2016.1196830.
- Yu J, Liang P, Yu X-L, et al. (2012). US-guided percutaneous microwave ablation of renal cell carcinoma: intermediate-term results. Radiology 263:900–8.
- Chen CN, Liang P, Yu J, et al. (2016). Contrast-enhanced ultrasound-guided percutaneous microwave ablation of renal cell carcinoma that is inconspicuous on conventional ultrasound. Int J Hyperthermia 32:607–13.
- Carrafiello G, Ierardi AM, Piacentino F, et al. (2012). Microwave ablation with percutaneous approach for the treatment of pancreatic adenocarcinoma. Cardiovasc Intervent Radiol 35:439–42.
- Sidoff L, Dupuy DE. (2016). Clinical experiences with microwave thermal ablation of lung malignancies. Int J Hyperthermia 24. [Epub ahead of print]. doi:10.1080/02656736.2016.1204630.
- Pusceddu C, Sotgia B, Fele RM, Melis L. (2013). Treatment of bone metastases with microwave thermal ablation. J Vasc Interv Radiol 24:229–33.
- Chu KF, Dupuy DE. (2014). Thermal ablation of tumours: biological mechanisms and advances in therapy. Nat Rev Cancer 14:199–208.
- Ahmed M, Brace CL, Lee Jr FT, Goldberg SN. (2011). Principles of and advances in percutaneous ablation. Radiology 258:351–69.
- Liang P, Yu J, Lu M-D, et al. (2013). Practice guidelines for ultrasound-guided percutaneous microwave ablation for hepatic malignancy. World J Gastroenterol 19:5430.
- Ahmed M, Goldberg S. (2004). Combination radiofrequency thermal ablation and adjuvant IV liposomal doxorubicin increases tissue coagulation and intratumoural drug accumulation. Int J Hyperthermia 20:781–802.
- Solazzo SA, Ahmed M, Schor-Bardach R, et al. (2010). Liposomal doxorubicin increases radiofrequency ablation-induced tumor destruction by increasing cellular oxidative and nitrative stress and accelerating apoptotic pathways. Radiology 255:62–74.
- Goldberg SN, Girnan GD, Lukyanov AN, et al. (2002). Percutaneous tumour ablation: increased necrosis with combined radio-frequency ablation and intravenous liposomal doxorubicin in a rat breast tumour model 1. Radiology 222:797–804.
- Algan Ö, Fosmire H, Hynynen K, et al. (2000). External beam radiotherapy and hyperthermia in the treatment of patients with locally advanced prostate carcinoma. Cancer 89:399–403.
- Mayer R, Hamilton-Farrell MR, van der Kleij AJ, et al. (2005). Hyperbaric oxygen and radiotherapy. Strahlenther Onkol 181:113–23.
- Harima Y, Ohguri T, Imada H, et al. (2016). A multicenter randomised clinical trial of chemoradiotherapy plus hyperthermia versus chemoradiotherapy alone in patients with locally advanced cervical cancer. Int J Hyperthermia 32:801–8.
- Wilson SR, Burns PN. (2010). Microbubble-enhanced US in body imaging: what role? Radiology 257:24–39.
- Cosgrove D. (2006). Ultrasound contrast agents: an overview. Eur J Radiol 60:324–30.
- Kaneko Y, Maruyama T, Takegami K, et al. (2005). Use of a microbubble agent to increase the effects of high intensity focused ultrasound on liver tissue. Eur Radiol 15:1415–20.
- McDannold NJ, Vykhodtseva NI, Hynynen K. (2006). Microbubble Contrast Agent with focused ultrasound to create brain lesions at low power levels: MR imaging and histologic study in rabbits. Radiology 241:95–106.
- Arvanitis CD, Vykhodtseva N, Jolesz F, et al. (2016). Cavitation-enhanced nonthermal ablation in deep brain targets: feasibility in a large animal model. J Neurosurg 124:1450–9.
- Hernot S, Klibanov AL. Microbubbles in ultrasound-triggered drug and gene delivery. (2008). Adv Drug Deliv Rev 60:1153–66.
- Sun Y, Zheng Y, Ran H, et al. (2012). Superparamagnetic PLGA-iron oxide microcapsules for dual-modality US/MR imaging and high intensity focussed US breast cancer ablation. Biomaterials 33:5854–64.
- Yin T, Wang P, Li J, et al. (2014). Tumor-penetrating codelivery of siRNA and paclitaxel with ultrasound-responsive nanobubbles hetero-assembled from polymeric micelles and liposomes. Biomaterials 35:5932–43.
- Sun L, Huang CW, Wu J, et al. (2013). The use of cationic microbubbles to improve ultrasound-targeted gene delivery to the ischemic myocardium. Biomaterials 34:2107–16.
- Takegami K, Kaneko Y, Watanabe T, et al. (2005). Heating and coagulation volume obtained with high-intensity focused ultrasound therapy: comparison of perflutren protein-type A microspheres and MRX-133 in rabbits. Radiology 237:132–6.
- Hanping Wu LRW. (2014). Real-time monitoring of radiofrequency ablation and postablation assessment: accuracy of contrast-enhanced US in experimental rat liver model. Radiology 270:107–16.
- Zhang X, Zheng Y, Wang Z, et al. (2014). Methotrexate-loaded PLGA nanobubbles for ultrasound imaging and Synergistic Targeted therapy of residual tumour during HIFU ablation. Biomaterials 35:5148–61.
- Isfort P, Penzkofer T, Tanaka T, et al. (2013). Efficacy of antegrade pyeloperfusion to protect the renal pelvis in kidney microwave ablation using an in vivo swine model. Invest Radiol 48:863–8.
- Hu X, Kheirolomoom A, Mahakian LM, et al. (2012). Insonation of targeted microbubbles produces regions of reduced blood flow within tumor vasculature. Invest Radiol 47:398–405.
- Holland CK, Apfel RE. (1990). Thresholds for transient cavitation produced by pulsed ultrasound in a controlled nuclei environment. J Acoust Soc Am 88:2059–69.
- Williams AR, Wiggins RC, Wharram BL, et al. (2007). Nephron injury induced by diagnostic ultrasound imaging at high mechanical index with gas body contrast agent. Ultrasound Med Biol 33:1336–44.
- Wible Jr JH, Galen KP, Wojdyla JK, et al. (2002). Microbubbles induce renal hemorrhage when exposed to diagnostic ultrasound in anesthetized rats. Ultrasound Med Biol 28:1535–46.
- Brace CL. (2009). Microwave ablation technology: what every user should know. Curr Probl Diagn Radiol 38:61–7.
- Bao S, Thrall BD, Miller DL. (1997). Transfection of a reporter plasmid into cultured cells by sonoporation in vitro. Ultrasound Med Biol 23:953–9.
- Ahmad F, Gravante G, Bhardwaj N, et al. (2010). Renal effects of microwave ablation compared with radiofrequency, cryotherapy and surgical resection at different volumes of the liver treated. Liver Int 30:1305–14.
- Kawai N, Ito A, Nakahara Y, et al. (2005). Anticancer effect of hyperthermia on prostate cancer mediated by magnetite cationic liposomes and immune-response induction in transplanted syngeneic rats. Prostate 64:373–81.
- Chen Z, Shen S, Peng B, Tao J. (2009). Intratumoural GM-CSF microspheres and CTLA-4 blockade enhance the antitumour immunity induced by thermal ablation in a subcutaneous murine hepatoma model. Int J Hyperthermia 25:374–82.
- Kennedy JE. (2005). High-intensity focused ultrasound in the treatment of solid tumours. Nat Rev Cancer 5:321–7.
- Jie Hu FW, Yang Sui, Tingting Xu. (2012). A microbubble contrast agent improves prediction of ablated areas during radiofrequency ablation: a rabbit liver study. J Ultrasound Med 32:787–93.