
Abstract
Objectives: The objective of this study is to assess the association between texture parameter analysis derived from T2-weighted images and efficiency of magnetic resonance-guided focussed ultrasound (MRgFUS) ablation for the treatment of uterine fibroids.
Materials and methods: Fifty-five women treated by MRgFUS were included in this retrospective analysis. Texture parameters were calculated using three 2D regions of interest placed on three consecutive slices on the same sagittal 3D T2-weighted images obtained at the beginning of MRgFUS ablation. Using uni- and multi-variate linear regression, texture parameters, fibroids/muscular T2W ratio (T2Wr), Funaki type, and fibroid depth were correlated with ablation efficiency, defined as the ratio of non-perfused volume (NPV) on post-treatment contrast-enhanced MRI by total volume of treatment-cell sizes used. Inter-rater reproducibility for texture analysis was assessed using variation coefficients.
Results: The mean total treatment cell volume was 49.5 (±30) ml, corresponding to a mean NPV of 57.2 (±57) ml (28%). The mean ablation efficiency was 1.14 (±0.7), with a range of 0.03–3.6. In addition to fibroid/muscular T2Wr, seven of the 14 texture parameters were significantly correlated with ablation efficiency: mean signal intensity (p = .047); Skewness (p = .03); Kurtosis (p = .015); mean uniformity (p = .052); mean sum of square (p = .045); mean sum entropy (p = .021) and mean entropy (p = .051). In multivariate linear regression, fibroid/muscular T2Wr and sum of entropy were associated with ablation efficiency. The inter-rater coefficient of variation for sum entropy was 2.6%.
Conclusions: Uterine fibroid texture parameters provide complementary information to T2Wr, and are associated with MRgFUS efficiency.
Mean sum entropy is negatively correlated with MRgFUS efficiency (ρ = −0.307, p = .021).
Fibroids/muscular T2-weighted ratio and entropy are associated with MRgFUS efficiency.
Texture parameters are better predictors of MRgFUS efficiency than Funaki type.
Fibroid MR texture analysis can improve patient selection for MRgFUS.
Key points
Introduction
Magnetic resonance imaging-guided high-intensity focussed ultrasound (MRgFUS) is an emerging and promising non-invasive treatment for symptomatic uterine fibroids. Short- and mid-term follow-up has shown satisfactory clinical success using either “point-by-point” sonication [Citation1–5] or volumetric ablation with the binary feedback control technique [Citation6–9]. However, despite the established clinical effectiveness of this safe and non-invasive treatment, it has not yet been widely adopted in clinical practice due to the time required to achieve sufficient tumour necrosis (around 2–3 h). Post-treatment non-perfused volume (NPV), which is associated with treatment duration, is the main prognostic factor of fibroid volume decrease and, as such, of clinical effectiveness [Citation10–12]. However, several other MRI-related factors have been identified as associated with treatment success, e.g. (i) fibroid perfusion parameters (high perfusion is associated with low ablation efficiency) [Citation13]; (ii) T2-weighted signal intensity (high T2-W signal is associated with low ablation efficiency) [Citation4,Citation14–16]; (iii) distance of ultrasound propagation from the skin to the ultrasound focus (greater distance is associated with lower ablation efficiency) [Citation15]. While the two last parameters are easy to assess, dynamic-contrast enhanced MRI requires specific MR sequences with bolus injection and dedicated post-processing software so it is not currently used in routine practice.
No study has yet assessed the potential usefulness of texture analysis to predict treatment efficiency. Texture analysis is a newly popular post-processing method useful for radiological images that provides more than perceivable texture features and parameters. These texture features can be derived from multiple-order level methods including histogram, gradient, grey-level co-occurrence matrix, runlength matrix, autoregressive model and wavelet transform parameters [Citation17]. Simply, these texture parameters reflect the extent of heterogeneity and granularity. Texture analysis has already be used to classify tumour subgroups in breast cancer [Citation18] or to predict tumour response to radio-chemotherapy [Citation19–21].
The aim of this study was to assess the potential association between texture parameter analysis, derived from T2W images and treatment efficiency using the MRgFUS Sonalleve system (Philips Vantaa, Finland) to treat uterine fibroids.
Materials and methods
The study protocol conforms to the ethical guidelines of the 1975 Declaration of Helsinki and was approved by our institutional human research committee. Informed consent was not necessary for this retrospective study.
Patients
We retrospectively and consecutively included all patients scheduled to be treated by MRgFUS for uterine fibroids in our institution from October 2009 to July 2015 (n = 67). Twelve patients were excluded: seven due to bowel interposition or uterine retroversion on the day of treatment and five due to heating failure (less than five treatment-cells used/premature heating cessation by patients, n = 3; or inability to increase temperature, n = 2). Consequently, 55 patients with a total of 55 uterine fibroids treated were analysed. In our institution, MRgFUS treatment was offered to patients meeting the following conditions: (1) age 18 years old without menopause, (2) one or two fibroids larger than 3 cm and less than 15 cm and (3) a Transformed Symptom Severity Score (tSSS) of at least 10 points. Exclusion criteria for MRgFUS treatment were (1) sub-mucosal fibroids, (2) type 3 fibroids based on Funaki et al. [Citation14], (3) more than 8 cm between the skin and the fibroid, (4) intra-fibroid calcification, (5) evidence of degeneration, (6) other pelvic disease (endometriosis, adenomyosis and inflammatory disease), (7) bowel interposition between the ultrasound beam and the fibroid, (8) large abdominal scar and (9) more than five fibroids [Citation6]. For 36 patients, mid-term clinical efficiency assessed by decrease of the symptom severity score [Citation22] was already reported in a previous study [Citation6] that did not assess MR-texture parameters and treatment efficiency.
Magnetic resonance imaging-guided high-intensity focussed ultrasound system
Two radiologists each with 8 years’ experience in MRgFUS ablation [Citation6,Citation7,Citation23] performed all treatment procedures on a clinical MRgFUS platform (Sonalleve Philips Vantaa, Finland) integrated into a 1.5-Tesla clinical MRI (Achieva 1.5T, Philips Healthcare, Best, Netherlands), as described in previous publications [Citation6,Citation7].
Volumetric ablations were performed using ellipsoid treatment cells that were 4, 8, 12 and 16 mm in axial diameter [Citation15]. These ablations included feedback of the temperature and of the deposited thermal dose, which regulated the time of the ablation according to the measured temperature and resulting thermal dose in real time, and stopped the heating system when the thermal dose, according to the “treatment cell” sizes, was achieved [Citation24].
The treatment procedure was already described previously [Citation6]. Briefly, the patient was positioned in the prone position on the MRI table, with the probe placed over the fibroid. All patients received a non-opioid analgesic infusion (infusion solution 100 mg/100 mL paracetamol over 20 min), a non-steroidal oral analgesic (ketoprofen, 400 mg) and an antispasmodic (phloroglucinol, 80 mg) before and during the treatment for pain prophylaxis. The radiologist used a software programme to plan the treatment and to position the target cells. The radiologist chose the size, location and number of treatment cells used to perform the treatment. Utilising real-time temperature mapping, the radiologist could control the temperature elevation of the surrounding tissue and stop the heating if the temperature became too high in the non-targeted tissues. At the end of the treatment, a contrast MRI agent (gadoteric acid, DOTAREM, Guerbet, Aulnay-Sous-Bois, France, 0.1 mmol/kg) was injected to evaluate the non-perfused volume.
Magnetic resonance imaging-guided high-intensity focussed ultrasound treatment efficiency
We defined ablation efficiency as NPV/treatment-cell volume [Citation13]. We excluded prematurely terminated sonications (<10 s) to avoid overestimation of total treatment-cell volume [Citation23]. We used the treatment-cell volumes previously provided by Kim et al. [Citation15], with each cell size (4, 8, 12 and 16 mm) corresponding to volumes 0.08, 0.67, 2.26 and 5.36 ml, respectively. The minimal overlap between treatment cells was considered negligible. NPV was calculated on the 3D T1W contrast-enhanced imaging performed at the end of the procedure using the MiaPlugin for Osirix providing a semi-automatic level-set image segmentation in 3D (http://www.mia-solution.com/index.html) [Citation25] by a radiologist with 8 years’ experience in MRgFUS ablation. Fibroid volumes were computed by manual segmentation on the Osirix software by the same radiologist.
Texture analysis
Texture analysis was performed using MaZda version 4.6 [Citation26–28] on the same Sagittal 3D-FAST T2-weighted image performed at the beginning of MRgFUS ablation (see and ) with the following characteristics: TR = 1000 ms; TE = 135 ms; Flip angle = 90°; reconstruction matrix = 512; FOV = 250 × 250 × 162 mm; voxel size = 1.42 × 1.71 × 1.25 mm. This sagittal T2-weighted sequence was performed on the same 1.5T MRI, at the beginning of the MRgFUS ablation with the Sonalleve system.
Figure 1. About 177 cc uterine fibroid with low mean sum of entropy (1.71) corresponding to an ablation efficiency of 3.61. The “in-MRI room” duration was 103 min: (a) sagittal T2-weighted image with ROI on MAZDA; (b) sagittal T1-weighted contrasted enhanced imaging showing a non-perfused volume of 124 cc (70%) at the end of the procedure; (c) sagittal T2-weighted image 1 year after MRgFUS; (d) sagittal T1-weighted contrasted enhanced imaging 1 year after MRgFUS showing a significant volume decrease.
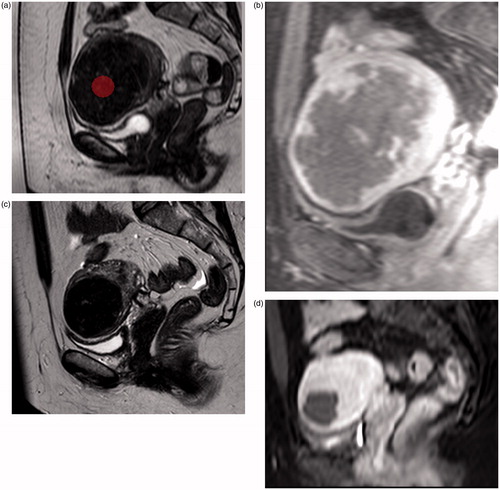
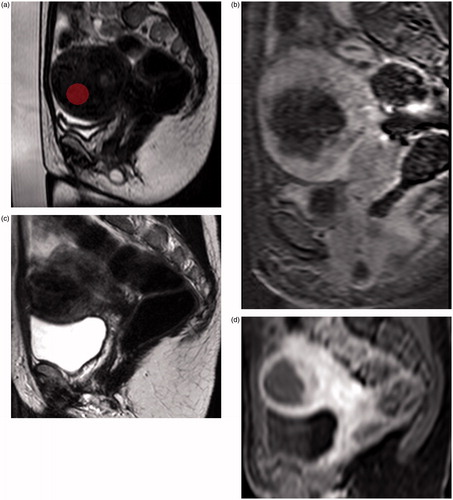
Figure 2. About 122 cc uterine fibroid with high mean sum of entropy (1.82) corresponding to an ablation efficiency of 1.9. The “in-MRI room” duration was 113 min: (a) sagittal T2-weighted image with ROI on MAZDA; (b) sagittal T1-weighted contrasted enhanced imaging showing a non-perfused volume of 54 cc (44%); (c) sagittal T2-weighted image 1 year after MRgFUS; (d) sagittal T1-weighted contrasted enhanced imaging 1 year after MRgFUS showing a significant volume decrease.
Three two-dimensional circular regions of interest (ROI) were drawn manually on three consecutive slices in the zone targeted by MRgFUS on the sagittal 3D-FAST T2W sequence. ROI were placed avoiding areas of cystic or mucinous degeneration in the fibroid. The choice of 2D ROI versus 3D ROI was motivated by the presence of cystic or mucinous areas that cannot be avoided using 3D ROI. To be reliable, texture analysis must be performed on ROI with the same size and shape. Therefore, to keep the ROI consistent, each 50-pixel diameter ROI was loaded from a file containing a standard-size and placed by the experienced radiologist specialising in MRgFUS therapy (). Then we used the mean of texture analysis results calculated from each three ROIs separately (i.e. for each texture parameters we used the mean of the texture analysis results of ROI-1, ROI-2 and ROI-3). To assess the variation coefficient for texture analysis results, one other radiologist with 6 years’ experience also placed the same ROI blinded to previous ROI placement. We chose a ROI diameter of 50 pixels as this was a good compromise between ROI size and ROI placement avoiding cystic or mucinous areas. Image data was re-binned to 6 bits/pixel (recommendations from the software developers [Citation18]). Grey-level normalisation, which is known to minimise the effect of brightness and contrast variations on the outcome of texture analysis, was carried out within MaZda by rescaling the histogram data to fit within μ ± 3σ (μ is the grey-level mean and σ is the grey-level standard deviation). Given the limited number of patients, we limited texture analysis to first order grey-level histograms (n = 4, the basic characters reflecting image uniformity) and second-order histogram, the co-occurrence matrix with 5 pixels distance. We chose to use only the 5 pixels distance to limit the number of variable. Furthermore 5-pixels distance appeared as a good compromise between the size of fibroids, the size of the treatment cell and the size of the ROI we used. This type of analysis provides value of Uniformity, Contrast, Correlation, Sum Of Square, Inverse variance, Sum entropy, Entropy, difference variance, difference entropy in four directions (each formula is in the MaZda Manual). To avoid angular dependency of this analysis, we used means of each data value in each direction for further analysis, as recommended by Haralick et al. [Citation29]. In order to quantify T2-signal intensity of uterine fibroids, we assessed the signal intensity ratios (T2Wr) (i.e. average signal intensity uterine fibroid/average signal intensity skeletal muscle).
Statistical analysis
Continuous data are reported with means ± standard deviations or medians (1–3 quartiles) according to variable distribution, and categorical data are reported as n (%). The inter-rater variation in texture analysis results was assessed with coefficients of variation (CV). To determine which texture analysis parameters (mean signal intensity, skewness, kurtosis, variance, mean uniformity, mean sum of square, mean contrast, mean correlation, mean sum average, mean sum variance, mean inverse diffusion moment, mean sum entropy, mean entropy, mean difference variance, mean difference entropy), fibroid characteristics (T2Wr, depth of fibroid, Funaki type) and therapy parameters (number of each of the treatment-cell sizes) significantly affected the treatment results, we first conducted a 2-tailed Pearson correlation test. Then all variables correlated with ablation efficiency with p < .1 were included in a multiple forward linear regression analysis retaining only variables with p < .05. The formula of the multiple linear regressions was presented as a predictive model of ablation efficiency. All statistical analyses were performed using SPSS 20 (SPSS Inc., Chicago, IL).
Results
Patients
Fifty-five patients with a mean age of 45 years were included (). No serious adverse events were reported during treatment or follow-up. Only three minor complications (grade B of the Society of Interventional Radiology classification) were recorded (and already reported previously [Citation6]): one patient had a superficial skin burn (first degree) that was treated and resolved within a week; a second patient experienced pyelonephritis and was home-treated with oral antibiotics (ciprofloxacin) for 10 d. The third patient suffered an infection of the necrotic-treated fibroid several days after treatment, which was treated by oral antibiotic therapy for 14 d (ofloxacin 800 mg/d and metronidazole 1 g/d). All patients with complications recovered completely with appropriate therapy [Citation6].
Table 1. Baseline characteristics.
The mean numbers of treatment cells used per patient per treatment cell size were 0.88 (±4.7) for 4 mm cells; 6.7 (±7.8) for 8 mm cells; 13.2 (±11) for 12 mm cells and 2.8 (±4) for 16 mm sizes. Texture analysis results are summarised in Supplementary Table 1.
Ablation efficiency of magnetic resonance imaging-guided high-intensity focussed ultrasound
The mean total treatment cell volume was 49.5 (±30) ml, corresponding to a mean NPV of 57.2 (±57) ml for a mean heating time of 11.6 (±5.8) min. NPV per patient was 28% (±18) of total fibroid volume. The ablation efficiency expressed as a mean was 1.14 (±0.7), with a range of 0.03–3.6.
Effects of texture parameters on ablation efficiency
Among the 14 texture parameters, seven were correlated with ablation efficiency (p < .1): mean signal intensity (p = .047); skewness (p = .03); kurtosis (p = .015); mean uniformity (p = .052); mean sum of square (p = .045); mean sum entropy (p = .021) and mean entropy (p = .051) (). T2Wr (p = .021) and Funaki type (p = .084) were also associated with ablation efficiency. In multivariate linear regression, T2Wr and mean sum entropy were associated with ablation efficiency (). The formula of the multivariate model was Y = 15.744 + (−8.012*mean sum entropy) + (−0.128*T2Wr) (total R2 = .2). Funaki type (II vs. I) was not retained in multivariate analysis as an independent factor compared with other texture parameters.
Table 2. Inter-rater coefficients of variation.
Table 3. Results of multivariate analysis of the effects of texture parameters on ablation efficiency.
The inter-rater coefficients of variation in texture parameters are summarised in . Mean sum Entropy assessment appears robust to inter-rater measurement variation with a coefficient of variation of 2.6%.
Discussion
Our results demonstrate the usefulness of MR texture analysis to predict MRgFUS ablation efficiency. We found that mean sum entropy and T2Wr were significantly associated with treatment efficiency. T2Wr is a well-documented predictor of ablation efficiency [Citation4,Citation14–16]. Fibroids with high T2w signals have more cellularity and vascularity than low T2W signal fibroids [Citation30–32]. Additionally, several first- and second-order texture parameters were significantly correlated with treatment efficiency. Among them, mean sum entropy emerged as the most important factor, being negatively correlated with ablation efficiency. Entropy describes the randomness of grey-level distribution. High entropy means that there is no preferred grey-level pair. It reflects fibroid heterogeneity as do the other parameters correlated with treatment success (such as kurtosis). We can assume that the presence of multiple different pixel intensities is associated with multiple different interfaces into fibroids leading to ultrasound (US) dispersion and defocusing, limiting energy deposit, heating and necrosis. The positive correlation between Kurtosis and treatment efficiency is concordant with this hypothesis. Kurtosis is a parameter that describes the shape of a random variable’s probability distribution. High Kurtosis entails a more peaked histogram and thus a predominant pixel intensity on fibroids. and illustrate the difference in ablation outcomes for 2 uterine fibroids with different means sum entropy and similar volume, but with significantly different NPV at the end of ablation despite a similar “in-MRI room” stay. Mean sum entropy and T2Wr provide complementary information, as illustrated by multivariate analysis results, predicting treatment success. While T2W signal intensity is easy to visually assess, variation of fibroid heterogeneity is almost impossible to quantify (see ); therefore, a qualitative classification of fibroid heterogeneity cannot offer the accuracy of quantitative analysis provided by texture analysis. This is illustrated by the multivariate analysis results of Matchtinger et al. [Citation10] and Gorny et al. [Citation33] who found that qualitative fibroid heterogeneity was not associated with treatment success. Texture analysis has several advantages in this regard; it detects invisible changes in texture heterogeneity and it provides quantification of this heterogeneity allowing it to be applied in clinical practice. Furthermore, T2Wr and mean sum entropy were associated with treatment success, while the generally used Funaki classification was not identified as an associated factor (as illustrated by multivariate linear regression). This is an additional argument in favour of quantitative versus qualitative analysis. Finally, mean sum Entropy appears robust to inter-rater measurement variation with a coefficient of variation of only 2.6%.
This study was conducted from a clinical application point of view, meaning that we performed a tumour-by-tumour analysis with ROI placed in the area targeted by MRgFUS, in contrast to Kim et al.’s [Citation13] study where they performed a cell-by-cell analysis for perfusion parameters. Cell-by-cell analysis limits the application in clinical routine. Herein, the physician can assess texture parameters and T2Wratio using three 50-pixel ROI in the targeted area, on the 3DT2 sequences performed before each treatment on the Sonalleve system (avoiding inter-sequence variation). Using the multivariate regression formula, an indication of heating efficiency in this area can be rapidly obtained. When the formula predicts a low chance of success, the physician could adapt his strategy (using higher power or heating time per cells) in order to achieve a sufficient NPV sparing time. Assessing these parameters did not require contrast enhancement or Shareware and can be performed quickly using the freeware MaZda (<5 min).
Nevertheless our study has some limitations. First, the R2 of our multivariate model remained weak (R2 = .2). This illustrates the complexity of predicting MRgFUS efficiency. Indeed US focalisation is influenced by many variables such as skin thickness, tissue characteristics and perfusion or angle of ultrasound. Our model would benefit from adding perfusion parameters or other parameters potentially associated with ultrasound focalisation or heating. Second, it is a retrospective study, although this retrospective design should not have influenced our results because texture parameters did not take into account the placement of treatment cells. Third, our percentage of non-perfused volume ratio seems low (28%) but it is directly linked to the high fibroid volume we included. Indeed, our mean non-perfused volume was 57 cc that is close to the NPV volume reported by: Kim et al. (70 cc corresponding to 25%) [Citation15] and Froeling et al. (31 cc corresponding to 41%) [Citation34]. Furthermore, we did not assess clinical effectiveness so the total NPV volume should not influence our results.
In conclusion, fibroid texture parameters provide complementary information to T2Wr, predicting MRgFUS efficiency. Mean sum entropy and T2Wr were both retained in multivariate model significantly associated with treatment success.
| Abbreviations | ||
| MRgFUS | = | magnetic resonance imaging-guided high-intensity focussed ultrasound |
| NPV | = | non-perfused volume |
| ROI | = | region of interest |
| T2Wr | = | T2 weighted ratio between fibroid and muscle |
Disclosure statement
The authors report that they have no conflicts of interest.
References
- Okada A, Morita Y, Fukunishi H, et al. (2009). Non-invasive magnetic resonance-guided focussed ultrasound treatment of uterine fibroids in a large Japanese population: impact of the learning curve on patient outcome. Ultrasound Obstet Gynecol: Off J Int Soc Ultrasound Obstet Gynecol 34:579–83.
- Fennessy FM, Tempany CM, McDannold NJ, et al. (2007). Uterine leiomyomas: MR imaging-guided focused ultrasound surgery-results of different treatment protocols. Radiology 243:885–93.
- Stewart EA. (2001). Uterine fibroids. Lancet 357:293–8.
- Funaki K, Fukunishi H, Funaki T, Kawakami C. (2007). Mid-term outcome of magnetic resonance-guided focused ultrasound surgery for uterine myomas: from six to twelve months after volume reduction. J Minim Invasive Gynecol 14:616–21.
- Funaki K, Fukunishi H, Sawada K. (2009). Clinical outcomes of magnetic resonance-guided focussed ultrasound surgery for uterine myomas: 24-month follow-up. Ultrasound Obstet Gynecol: Off J Int Soc Ultrasound Obstet Gynecol 34:584–9.
- Thiburce AC, Frulio N, Hocquelet A, et al. (2015). Magnetic resonance-guided high-intensity focussed ultrasound for uterine fibroids: mid-term outcomes of 36 patients treated with the Sonalleve system. Int J Hyperth: Off J Eur Soc Hyperthermic Oncol North Am Hyperth Group 31:764–70.
- Voogt MJ, Trillaud H, Kim YS, et al. (2012). Volumetric feedback ablation of uterine fibroids using magnetic resonance-guided high intensity focused ultrasound therapy. Eur Radiol 22:411–7.
- Ikink ME, Voogt MJ, Verkooijen HM, et al. (2013). Mid-term clinical efficacy of a volumetric magnetic resonance-guided high-intensity focused ultrasound technique for treatment of symptomatic uterine fibroids. Eur Radiol 23:3054–61.
- Kim Y-S, Kim J-H, Rhim H, et al. (2012). Volumetric MR-guided high-intensity focused ultrasound ablation with a one-layer strategy to treat large uterine fibroids: initial clinical outcomes. Radiology 263:600–9.
- Machtinger R, Inbar Y, Cohen-Eylon S, et al. (2012). MR-guided focus ultrasound (MRgFUS) for symptomatic uterine fibroids: predictors of treatment success. Hum Reprod Oxf Engl 27:3425–31.
- Park H, Yoon S-W, Kim K-A, et al. (2012). Magnetic resonance imaging-guided focused ultrasound treatment of pedunculated subserosal uterine fibroids: a preliminary report. J Vasc Interv Radiol JVIR 23:1589–93.
- Park MJ, Kim Y-S, Keserci B, et al. (2013). Volumetric MR-guided high-intensity focused ultrasound ablation of uterine fibroids: treatment speed and factors influencing speed. Eur Radiol 23:943–50.
- Kim Y-S, Lim HK, Kim J-H, et al. (2011). Dynamic contrast-enhanced magnetic resonance imaging predicts immediate therapeutic response of magnetic resonance-guided high-intensity focused ultrasound ablation of symptomatic uterine fibroids. Invest Radiol 46:639–47.
- Funaki K, Fukunishi H, Funaki T, et al. (2007). Magnetic resonance-guided focussed ultrasound surgery for uterine fibroids: relationship between the therapeutic effects and signal intensity of pre-existing T2-weighted magnetic resonance images. Am J Obstet Gynecol 196:184. e1–6.
- Kim Y, Keserci B, Partanen A, et al. (2012). Volumetric MR-HIFU ablation of uterine fibroids: role of treatment cell size in the improvement of energy efficiency. Eur J Radiol 81:3652–9.
- Lénárd ZM, McDannold NJ, Fennessy FM, et al. (2008). Uterine Leiomyomas: MR imaging-guided focused ultrasound surgery-imaging predictors of success. Radiology 249:187–94.
- Castellano G, Bonilha L, Li LM, Cendes F. (2004). Texture analysis of medical images. Clin Radiol 59:1061–9.
- Waugh SA, Purdie CA, Jordan LB, et al. (2016). Magnetic resonance imaging texture analysis classification of primary breast cancer. Eur Radiol 26:322--30
- Liu J, Mao Y, Li Z, et al. (2016). Use of texture analysis based on contrast-enhanced MRI to predict treatment response to chemoradiotherapy in nasopharyngeal carcinoma. J Magn Reson Imaging JMRI 44:445--55
- Wu J, Gong G, Cui Y, Li R. (2016). Intratumor partitioning and texture analysis of dynamic contrast-enhanced (DCE)-MRI identifies relevant tumour subregions to predict pathological response of breast cancer to neoadjuvant chemotherapy. J Magn Reson Imaging JMRI 44:1107--15
- De Cecco CN, Ganeshan B, Ciolina M, et al. (2015). Texture analysis as imaging biomarker of tumoral response to neoadjuvant chemoradiotherapy in rectal cancer patients studied with 3-T magnetic resonance. Invest Radiol 50:239–45.
- Spies JB, Coyne K, Guaou Guaou N, et al. (2002). The UFS-QOL, a new disease-specific symptom and health-related quality of life questionnaire for leiomyomata. Obstet Gynecol 99:290–300.
- Kim Y, Trillaud H, Rhim H, et al. (2012). MR thermometry analysis of sonication accuracy and safety margin of volumetric MR imaging-guided high-intensity focused ultrasound ablation of symptomatic uterine fibroids. Radiology 265:627–37.
- Mougenot C, Quesson B, de Senneville BD, et al. (2009). Three-dimensional spatial and temporal temperature control with MR thermometry-guided focused ultrasound (MRgHIFU)). Magn Reson Med 61:603–14.
- Wang C, Frimmel H, Smedby Ö. (2014). Fast level-set based image segmentation using coherent propagation. Med Phys 41:73501.
- Szczypiński PM, Strzelecki M, Materka A, Klepaczko A. (2009). MaZda – a software package for image texture analysis. Comput Methods Programs Biomed 94:66–76.
- Strzelecki M, Szczypinski P, Materka A, Klepaczko A. (2013). A software tool for automatic classification and segmentation of 2D/3D medical images. Nucl Instrum Methods Phys Res Sect Accel Spectrometers Detect Assoc Equip 702:137–40.
- Szczypinski PM, Strzelecki M, Materka A. (2007). Mazda – a software for texture analysis. In: International Symposium on Information Technology Convergence, 245–9.
- Haralick RM, Shanmugam K, Dinstein I. (1973). Textural features for image classification. IEEE Trans Syst Man Cybern SMC 3:610–21.
- Oguchi O, Mori A, Kobayashi Y, et al. (1995). Prediction of histopathologic features and proliferative activity of uterine leiomyoma by magnetic resonance imaging prior to GnRH analogue therapy: correlation between T2-weighted images and effect of GnRH analogue. J Obstet Gynaecol Tokyo Jpn 21:107–17.
- Yamashita Y, Torashima M, Takahashi M, et al. (1993). Hyperintense uterine leiomyoma at T2-weighted MR imaging: differentiation with dynamic enhanced MR imaging and clinical implications. Radiology 189:721–5.
- Swe TT, Onitsuka H, Kawamoto K, et al. (1992). Uterine leiomyoma: correlation between signal intensity on magnetic resonance imaging and pathologic characteristics. Radiat Med 10:235–42.
- Gorny KR, Borah BJ, Weaver AL, et al. (2013). Clinical predictors of successful magnetic resonance-guided focused ultrasound (MRgFUS) for uterine leiomyoma. J Ther Ultrasound 1:15.
- Froeling V, Meckelburg K, Scheurig-Muenkler C, et al. (2013). Midterm results after uterine artery embolization versus MR-guided high-intensity focused ultrasound treatment for symptomatic uterine fibroids. Cardiovasc Intervent Radiol 36:1508–13.