
Abstract
Purpose: Superficial tumours with deep infiltration in the upper 15 cm of the trunk cannot be treated adequately with existing hyperthermia systems. The aim of this study was to develop, characterise and evaluate a new flexible two-channel hyperthermia system (AMC-2) for tumours in this region.
Materials and methods: The two-channel AMC-2 system has two horizontally revolving and height adjustable 70 MHz waveguides. Three different interchangeable antennas with sizes 20 × 34, 15 × 34 and 8.5 × 34 cm were developed and their electrical properties were determined. The performance of the AMC-2 system was tested by measurements of the electric field distribution in a saline water filled elliptical phantom, using an electric field vector probe. Clinical feasibility was demonstrated by treatment of a melanoma in the axillary region.
Results: Phantom measurements showed a good performance for all waveguides. The large reflection of the smallest antenna has to be compensated by increased forward power. Field patterns become asymmetrical when using smaller top antennas, necessitating phase corrections. The clinical application showed that tumours deeper than 4 cm can be heated adequately. A median tumour temperature of 42 °C can be reached up to 12 cm depth with adequate antenna positioning and phase-amplitude steering.
Conclusions: This 70 MHz AMC-2 waveguide system is a useful addition to existing loco-regional hyperthermia equipment as it is capable of heating axillary tumours and other tumours deeper than 4 cm.
Introduction
Hyperthermia is a proven radio- and chemo-sensitiser. Several randomised studies have shown a higher complete response (CR), local control and survival rate by use of hyperthermia as a supplement to radiotherapy and/or chemotherapy for breast cancer, melanoma, cervical cancer and soft tissue sarcomas, without increasing toxicity [Citation1–6]. Hyperthermia additional to the radiotherapy is thus considered a proven option to treat recurrent, previously irradiated breast cancer patients adequately [Citation7–9].
The standard microwave hyperthermia equipment for superficial tumours operate at high frequencies (915 and 434 MHz) with penetration depths (PDs) of 2–4 cm. This equipment is not suitable for deep-seated advanced tumours (>4 cm). Development of systems operating at lower frequencies can be effective for treatment of tumours located deeper than 4 cm [Citation10].
Myerson et al. [Citation11] showed that the specific absorption rate (SAR) coverage by the hyperthermia applicator has a strong influence on local control in the treatment of superficial tumours. Van der Zee et al. [Citation12] reported an overall CR of 74% for patients treated with superficial hyperthermia systems operating at 434 MHz. For patients with larger tumours (>3 cm diameter), the CR was significantly lower (65%) compared to patients with smaller tumours (87%). Based on these results they expected that the overall CR rate may reach a value of 90% when optimal heating techniques become available for all tumours. This dependency of CR on tumour size was confirmed by Oldenborg et al. [Citation13]. Thus, there is a need for adequate hyperthermia equipment to ensure that each tumour can be heated effectively [Citation10,Citation14,Citation15].
For deep-seated advanced breast tumours and supraclavicular tumours, the PD of the electric field (E-field) must be at least 4 cm, exceeding the maximal PD of superficial applicators operating at a frequency of ≥434 MHz. The 70 MHz Contact Flexible Microstrip Applicator (CFMA, Fryazino, Moscow region, Russia) has been developed to combine flexibility with a good PD [Citation16]. Measurements showed that the 70 MHz CFMA antenna can heat deep-seated tumours, but the high normal E-field component (fringing field) can cause treatment limiting hotspots at the edge of the antenna, which limit tumour temperatures significantly. Prototypes of improved designs of 70 MHz CFMA antennas have been designed but are not yet clinically available [Citation17].
The AMC-4 phased array system, consists of four 70 MHz waveguides and has been applied extensively in the clinic since 1987 for pelvic tumours [Citation18]. Phase-amplitude steering provides good two-dimensional control over the E-field distribution. When these waveguides are used with a sufficiently large water bolus the normal E-field component on the skin is low, thus preventing treatment limiting hotspots [Citation19]. The 70 MHz waveguide has potentially good characteristics for heating the supraclavicular and axillary region and good control over the field distribution in this region could possibly be achieved by using two phase controlled 70 MHz antennas placed facing each other on the ventral and dorsal side of the body. This technique would make it possible to heat tumours in these areas at depths extending beyond 4 cm.
In this article, a new system with two opposing antennas for heating deep-seated breast and supraclavicular tumours is presented. The standard 20 × 34 cm AMC waveguide was used as a basis for this system. In addition two new smaller antennas were developed, with dimensions 15 × 34 cm and 8.5 × 34 cm, to match the anatomical requirements in the supraclavicular and axillary region. E-field measurements were performed for both single- and double-antenna set-ups to analyse the characteristics of these new waveguides. Clinical application of the system is illustrated by a treatment of a large melanoma in the axilla of a male patient.
Materials and methods
System design
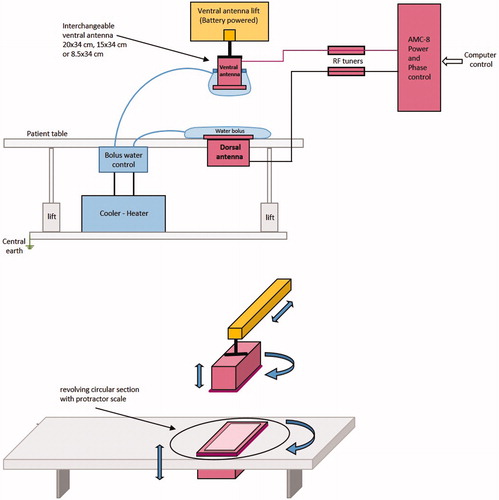
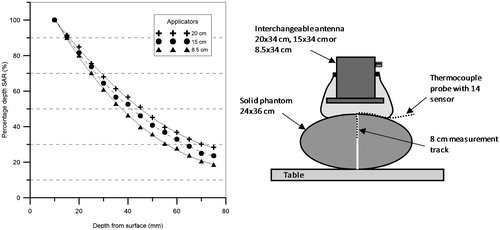
The new AMC-2 system required development of different elements; table, antennas and positioning system. The table is a commercially available table (R.K. Rose + Krieger, Minden, Germany) modified with an extra wooden frame to minimise disturbance of the electromagnetic field. This wooden frame is covered by a trespa table top, in which the bottom or dorsal antenna is integrated in a revolving circular section. The top or ventral antenna is mounted on a movable portal, which can move up and down with a battery-operated electric lift and can be rotated freely for alignment with the tumour centre and the bottom antenna. The top antenna can be interchanged and one of the three available waveguides (see section “Antennas and radiofrequency generator system”) is selected based on the tumour size and location. The 20 × 34 cm bottom antenna is mounted in the revolving circular section of the table and can be rotated over 180°. Protractor scales are mounted on both antennas to determine the rotation angles for a reproducible treatment set-up. The mechanical and electrical set-up of the complete system is shown in .
Figure 1. Schematic diagram of the AMC-2 system. The dorsal or bottom antenna is integrated in the table. The ventral or top antenna and bolus are mounted on a lift. The antennas are connected via a tuner to a phase- and amplitude-controlled generator. The temperature-controlled demineralised water in each bolus can be cooled or heated depending of the depth of the tumour (top diagram). The blue arrows indicate the movement options of the antennas (bottom diagram). Both antennas can be rotated 180° for flexible positioning.
Antennas and radiofrequency generator system
The design of the antennas for the AMC-2 system was based on the 20 × 34 cm demineralised water filled 1/4λ waveguide used in the AMC-4 system [Citation20], because of its proven stability at 70 MHz. Two new antenna sizes were developed for the AMC-2 system. The long side (height) of the aperture remains 34 cm as it determines the minimum operating frequency of the waveguide. The short side of the aperture (width) can be varied within a limited range. The new antennas have an aperture size of 8.5 × 34 cm and 15 × 34 cm, respectively ().
Figure 2. Left: the three waveguide sizes, left to right the 20 × 34, 15 × 34 and 8.5 × 34 cm waveguide. Right: schematic drawing of the 15 × 34 cm applicator with conductor rod. The distances between rod and aperture and between the rod and the back plate of the waveguide are 93 and 36.5 mm, respectively.
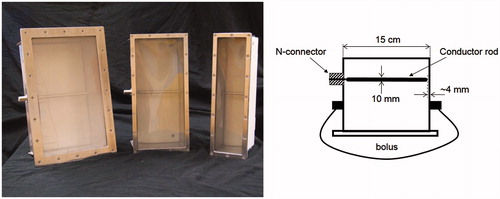
The central conductor of the coaxial feeding cable is connected to a rod (located in the waveguide). This rod should have a minimum length for a good coaxial-waveguide energy transition. An optimal length of the rod yields a minimal reflection of the forward signal. This optimal length was experimentally determined with a procedure similar to the method used for the design of the 20 × 34 cm waveguide [Citation20]. For the new 8.5 and 15 cm waveguide, the same rod diameter (10 mm) was used as for the 20 × 34 cm waveguide. The distance of the tip of the rod to the wall for the 20 × 34 cm waveguide of 1/128λ in water (λw = 48 cm), was used as starting point for the experiments to determine the optimal gap for the other two antennas.
The waveguides operate in the TE10 mode and are connected to a Direct Digital Synthesizer (DDS)-based phase- and amplitude-controlled radiofrequency (RF) generator (SSB, Iserlohn, Germany). This generator system of the AMC-8 system [Citation21] is used with only one or two active channels. Each channel is fitted with a 500 W solid state amplifier (Alba, Rome, Italy). The amplifier can withstand 15% reflection of the forward (FWD) power to a maximum of 75 W. A double slug tuner between the amplifier and applicator is used to reduce the reflected power to the amplifier to <10% of the FWD signal. This tuner consists of a coaxial transmission line with a characteristic impedance of 50 ohm at 70 MHz and matches the impedance between the 50 ohm power amplifier and the variable impedance of the applicator connected with the bolus to the phantom or patient. The line contains two identical movable slugs that slide between the inner and outer conductors. The slugs are made of a dielectric material (Teflon ɛr=2). The magnitude of the reflection is determined by the distance separating the slugs. The reflection coefficient is minimal for zero separation distance, and increases when the separation is increased. The optimal position of the slugs is determined empirically before the start of the treatment for every individual patient using low power (50 W) to prevent excessive reflected power levels during tuning.
Bolus
The coupling between the waveguide and the patient or phantom is arranged by a water bolus. The 6 cm bottom bolus is a closed water bag with fixed dimensions of 36 and 40 cm parallel and perpendicular to the dominant E-field direction, respectively, and is connected to a temperature controlled water bath through two tubes and a heat exchanger. The bolus attached to the top waveguide matches the size of the antenna and is an open water bag which is filled and drained by tubes descending from the top of the bolus, similar to the bolus design for the top antenna in the AMC-4 system [Citation20]. Advantage of the open water bolus is enhanced patient comfort as the patient will not experience changes in water pressure during breathing.
Perpendicular to the dominant E-field direction, the aperture size is 34 cm and the bolus size 40 cm for all antennas. In the longitudinal direction (parallel to the main E-field component) the top bolus size matches the size of the antenna and is 32, 27 and 18 cm for the 20 × 34, 15 × 34 and 8.5 × 34 cm antenna, respectively. The bolus extends the heated area in the longitudinal direction of the patient or phantom and reduces the influence of fringing fields [Citation19]. The large bolus size and thickness allow a good contact, even on irregular patient surfaces. The demineralised water in the bolus can be circulated at a constant temperature for cooling or heating of the skin, with a temperature level selected depending on the tumour depth [Citation22]. The AMC-2 system is provided with a pump and heat exchanger, which can be connected to an external heater or cooler, as schematically shown in .
Phantoms
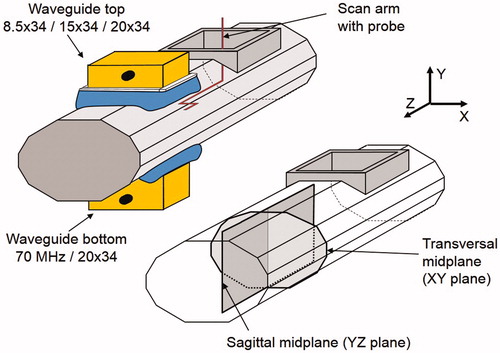
The E-field measurements were performed in an elliptical phantom, with a cross-section of 24 × 36 cm and filled with a muscle-equivalent 3 g/l saline solution. This solution has a relative dielectric permittivity of 77 and a conductivity of 0.51 S/m at 70 MHz and a water temperature of 22 °C. The phantom wall was made of PVC with a wall thickness of 2 mm and has a length of 115 cm. This phantom is recommended as a standard phantom for deep hyperthermia by COMAC-BME in 1991 [Citation23]. The waveguide applicators were centrally placed on the top and bottom of the phantom (). The main field component (Z-component) of the applicator is in longitudinal direction of the phantom.
Figure 3. Schematic drawing of the experimental set-up for the E-field measurements. Top left: the elliptical phantom, the interchangeable applicator and at the bottom side the 20 × 34 cm applicator. Bottom right: the sagittal YZ and transversal XY measurement planes.
Effective heating depth (EHD) measurements were performed in a similar elliptical phantom filled with a wallpaper paste solution to measure the SAR at several depths starting at 1 cm depth to determine the depth at which SAR is 50% of the value at 1 cm depth in accordance with the European Society of Hyperthermia (ESHO) Quality Assurance (QA) guidelines [Citation24,Citation25]. The phantom is fitted with thermocouple probes and the SAR values are derived from the temperature rise resulting after 1 min power on. The wallpaper paste solution (26.79 g methyl powder +3 g salt per litre demineralised water) has a dielectric constant of 75 and a conductivity of 0.55 S/m at 70 MHz, which is comparable to the properties of the saline water-filled phantom.
Simulations
E-field simulations were performed using the finite difference time domain FDTD method at a resolution of 2.5 × 2.5 × 5 mm3 [Citation26]. The distributions were calculated for a muscle-equivalent phantom (relative dielectric permittivity of 77, conductivity of 0.51 S/m) with the antenna combination 20 × 34 + 20 × 34 cm. The effect of the phase steering was calculated for seven different phase settings.
Measurements
E-field measurements
The effect of the bolus dimensions on the E-field distribution in both longitudinal and perpendicular direction has been extensively studied and described for rectangular waveguides by Wiersma et al. [Citation19] and Schneider et al. [Citation18]. We used bolus dimensions that were large enough to ensure that the E-field distribution in perpendicular direction has a minimal contribution to the total E-field. Therefore, in this study we focussed on the E-field distribution of the main component of the E-field, i.e. the field component in the longitudinal (Z-) direction.
The E-field was measured using an E-field vector probe [Citation18], connected to a measurement system developed by the Physics and Electronics Laboratory of the Netherlands organisation for applied scientific research (TNO). The probe has a sensitivity of 2 V/m and dynamic range of 40 dB. The range in our measurements is ∼25 dB (20–220%, see and ). The output of the TNO probe is based on a diode detector and not linear over this range. The TNO probe is therefore calibrated against the forward signal Vfwd on the feeding cable at the start of each measurement, assuming E ∼ a.Vfwd. The resulting calibration curve is then used to convert the measured probe signals into relative E-field values. Schneider et al. [Citation18] compared thus measured E-field distributions with simulated distributions in a homogeneous elliptic phantom and found a relative difference of <10% over the whole plane. Agreement between the TNO probe and a passive LED probe was better than 10% in measurements in an elliptic phantom.
The output of the TNO system is sent to a DAQ-unit (LabJack U12, LabJack Corporation, Lakewood, CO) connected to a PC. An in-house developed MATLAB application interprets and stores the signals. The probe is mounted on an in-house developed x–y scanner, which can move vertically and horizontally within the phantom by means of DC-motors. The E-field probe was designed and constructed to have small physical dimensions (5 mm diameter, 2 cm length) to minimise disturbance of the E-field [Citation18].
E-field measurements were performed in the transversal XY (z = 0) and sagittal YZ (x = 0) midplane (), for single-antenna and two-antenna set-ups. All single-antenna E-field measurements were normalised in the centre of the phantom and centre of the applicator. The amplitude of the E-field was defined to be 100% at this point. For the two-antenna set-up, the normalisation point was also in the centre between the antennas, where the E-field was defined as 100% of the amplitude for equal antenna power and zero phase. For the two-antenna set-up, different phases were applied and E-field distributions in the central transversal XY-plane and the sagittal YZ-plane were analysed.
The E-field measurements provide insight in the field distribution under the aperture of the antenna. The effective field size (EFS), the size of the 50% SAR contour, was determined for the single-antenna set-up normalised for maximum 100% SAR at 1 cm depth. The E-field at 1 cm depth is approximately three times higher (300%) than in the centre of the phantom for all three antennas. After renormalisation of the E-field distributions, the 200% contour is equivalent to 70% normalised at 1 cm depth, which corresponds to the 50% SAR contour. The EFS is obtained by Z and the X distances in the XY- and YZ-plane, respectively. For the two-antenna set-up, the full width half maximum (FWHM), i.e. the width where the SAR is 50% of maximum SAR, was determined at 4 cm below the top antenna as well as at the centre, since many tumours in the supraclavicular region are located at larger depths. The top and bottom antenna had equal phase. To determine the EFS a renormalisation of the field distribution was performed at the location concerned.
Effect of phase steering
Phase steering is a very important feature for achieving heating at the desired depth in the two-antenna set up during clinical application. E-field profiles were measured along the central transversal Y-axis of the phantom for three antenna combinations with either the 20 × 34 cm, the 15 × 34 cm or the 8.5 × 34 cm antenna as top antenna. The phase of the bottom 20 × 34 cm antenna was 120°, 90°, 45°, 0, −45°, −90° or −120°.
Asymmetrical two-antenna set-up
In clinical practice, the antenna can often not be placed in such a way that the entire aperture covers the patient’s chest, due to the anatomy in the supraclavicular region and the size of the antenna. This suboptimal contact with the patient anatomy might have an influence on the E-field distribution. This was analysed in measurements with an asymmetrical phantom set-up where the phantom was shifted 10 cm in the X-direction. An overview of all E-field measurements is given in . The bolus thickness during all measurements was 6 cm at the central Y-axis.
Table 1. Overview of all E-field measurements.
EHD measurements
According to the QA guidelines of the ESHO, the EHD for a single antenna is defined as the additional depth at which the relative power deposition has decreased to 50% of the value at 1 cm depth [Citation25]. EHD measurements were performed using a power-pulse technique [Citation27], because E-field measurements with the E-field vector probe as described above could not be performed very close to the phantom wall due to the dimensions of the probe and its holder. A 14 sensor thermocouple probe (ELLA-CS s.r.o., Hradec Kralove, Czech Republic) with sensor distance of 0.5 cm was located in the phantom on the central Y-axis to measure the temperature rise profile after a 120 s power pulse of 200 W (). This temperature rise is proportional to the SAR and the EHD was determined from this measured profile along the Y-axis.
Antenna properties
The most important indicators for the amount of energy radiated by an antenna are the return loss or reflection coefficient (S11), the standing wave ratio (SWR) and the amount of energy reflected. These properties were determined by a forward-reflected power measurement using a directional coupler connected to the calibrated Vector Voltmeter (Hewlett Packard, HP8505A, Palo Alto, CA). During these measurements the antenna was located on top of the elliptical saline water phantom, with a 6 cm bolus as load. In addition reflection spectrum scans were performed with a Vector Network Analyzer (Rohde & Schwarz, R&S ZNC, Hampshire, United Kingdom) with the antenna placed on the saline phantom and on a volunteer.
Clinical application
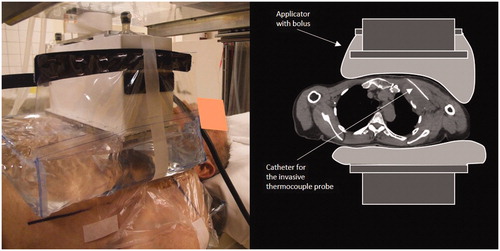
The clinical feasibility of the newly developed AMC-2 system is illustrated by a treatment of a melanoma located in the left axilla of a male patient; age: 72 years, tumour size: 10 × 10 cm. The tumour extended from 1 to 11 cm below the skin in ventrodorsal direction. The patient was treated with radiotherapy; eight times 4 Gy twice a week combined with hyperthermia once a week. The 8.5 × 34 cm antenna was applied as upper antenna (). Superficial and invasive tumour temperatures were measured with 14-point thermocouple probes with 0.5 cm spacing (ELLA-CS, s.r.o.). One invasive probe was inserted in a 10 cm deep catheter in the tumour and two superficial probes were placed on the skin underneath the water bolus [Citation28]. All probes were positioned perpendicular to the main E-field direction and ferrite beads were applied on the probe in order to minimise the RF disturbance on the thermometry. A power on/off procedure with a duty cycle of 25 s/5 s was applied to minimise the self-heating errors on the readout [Citation29]. The treatment consists of a warming up period until stable tumour temperatures have been reached, followed by a 60 min steady-state period. Maximum duration of the warming up period is 30 min, yielding a maximum total treatment period of 90 min. The tumour temperature achieved was recorded using the mean T90, T50 and T10, corresponding with the temperature achieved in at least 90, 50 and 10% of the measurement points in the tumour integrated over the 60 min steady-state time, respectively [Citation30]. The water in the top and bottom bolus was circulated and cooled down to 21 °C to avoid excessive skin heating.
Figure 4. Clinical set up for a 72-year-old male patient with a 10 × 10 cm melanoma located in the left axilla. The 8.5 × 34 cm waveguide was applied as ventral antenna at the top. The 20 × 34 cm applicator was located at the dorsal side. A 1.67 mm (5F) thermometry catheter was placed invasively over a length of 10 cm in the tumour.
The power/phase optimisation strategy during treatment involved application and test of different power and phase combinations during the pre-steady-state period. The power/phase combination which gave the highest temperature rise and yielded the highest tumour temperature at the end of the pre-steady-state period were the settings used for the steady-state period. Additional power or phase changes were implemented during steady-state if the tumour temperature decreased or stabilised at a suboptimal level or if hotspots occurred. These modified settings were used as starting point during subsequent sessions.
Results
E-field distribution
Single-antenna set-up
The E-field distributions for the individual antennas are presented in . The contour plots in the transversal plane (XY-plane: top row) and in the sagittal plane (YZ-plane: bottom row) are shown. The contour plots of the three different antennas are comparable in the transversal plane, since the antenna size in this direction is equal for all antennas (34 cm). The E-field distribution in the sagittal plane depends mainly on the antenna width. The 100% E-field contour in the YZ-plane of the 15 cm antenna is 25% smaller compared to the 20 cm antenna; for the 8.5 cm antenna this is 39%. The E-field of the 8.5 cm antenna is elevated at the edges. This elevation is equal or lower than the E-field in the centre.
Figure 5. Contour plots of the E-field (Z-component) of the 20 × 34, 15 × 34 and 8.5 × 34 cm antennas (from left to right). The top row shows the distributions in the central transversal XY-plane and the bottom row the distributions in the sagittal YZ-plane (). The Z-component of the E-field in the centre of the phantom was normalised to 100%.
It was observed that the EFS in the Z-direction is approximately equal to the antenna width. The EFS in the X-direction is for all antennas ∼26 cm. The EFS is thus ∼17 × 26 cm2, 15 × 26 cm2 and 13 × 26 cm2 for the 20, 15 and 8.5 cm antenna, respectively.
Symmetrical two-antenna set-up: waveguides in phase
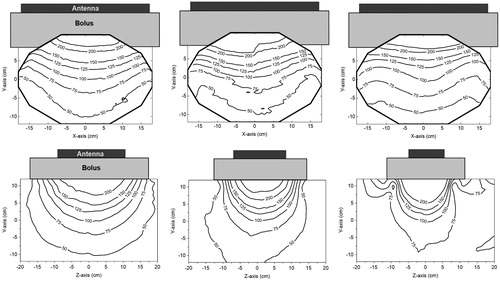
The E-field distributions for the three antenna combinations are presented in . The effect of the width of the top antenna (20, 15 and 8.5 cm) on the E-field distribution can be observed. The E-field distribution is symmetrical when the top and bottom antenna are equal in size. The smaller the top antenna the less its contribution to the E-field in the centre of the phantom. The reduction of the field size near the top antenna demonstrates this influence on the field distribution.
Figure 6. E-field distributions of the different antenna combinations at zero phase. From left to right: The contour plots of the 20 × 34 + 20 × 34 cm, 20 × 34 + 15 × 34 cm and 20 × 34 + 8.5 × 34 cm antenna combinations. The first row shows the field distributions in the transversal XY-plane and on the second row shows the distributions in the sagittal YZ-plane (). The Z-component of the E-field in the centre of the phantom was normalised to 100%.
The FWHM measured in the centre and at 4 cm below the top antenna are shown in . The FWHM in the Z-direction at the centre of the phantom is dominated by the 20 cm bottom antenna and is ∼21 cm for all antenna combinations. The FWHM is sufficiently wide to heat large tumours, with the smallest dimensions for the 20 × 34 + 8.5 × 34 antenna combination.
Table 2. FWHM, i.e. the width where the SAR is 50% of maximum SAR, determined at the centre of the phantom and at 4 cm below the top antenna.
Symmetrical two-antenna set-up: effect of phase steering
shows E-field profiles along the central Y-axis for different phase settings in the three antenna combinations. The bottom antenna is the standard 20 cm waveguide.
Figure 7. E-field profiles measured along the central transversal Y-axis of the phantom for different two-antenna set-ups. Measurements were performed for seven different phase settings of the bottom antenna: 120°, 90°, 45°, 0, −45°, −90° and −120° for the 20 × 34 + 20 × 34 cm (top graph), the 20 × 34 + 15 × 34 cm (central graph) and the 20 × 34 + 8.5 × 34 cm antenna combination (bottom graph). All graphs are a fit (sixth degree polynomial) to the measured data. The E-field was normalised in the centre of the phantom at zero degrees phase difference.
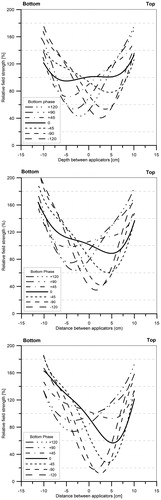
The smaller the antenna the lower the field contribution at that side of the phantom. When equally sized antennas are applied in equal phase, a symmetrical profile is observed. However, when a smaller top antenna is applied the profile becomes asymmetric. For example, the E-field at 5 cm depth from the top of the phantom is 40% lower for the 8.5 cm antenna compared to the 20 cm antenna. The E-field can drop to 20% when the bottom phase is about −90° for this combination.
Asymmetrical two-antenna set-up
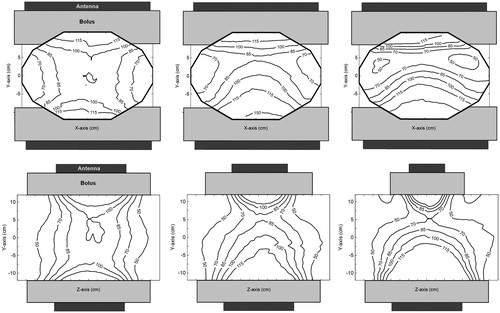
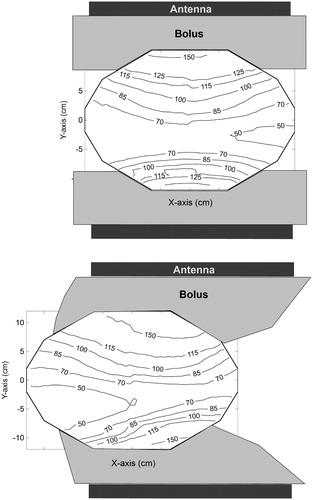
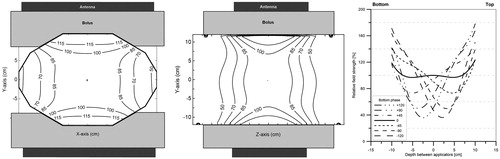
In , the field distribution in a symmetrical set-up is compared to an asymmetrical set-up, where the phantom was shifted 10 cm in the X-direction. The E-field was normalised to 100% in the centre of the phantom at 0° phase. A 20 × 34 + 15 × 34 antenna combination with a 120° phase shift for the bottom antenna was used for this measurement. No substantial change in the distribution was observed, apart from the expected drop of the E-field at the side where the antennas do not cover the phantom.
Figure 8. Contour plots of the field distribution in the transversal mid-plane for a symmetrical (top) and an asymmetrical (bottom) set-up using the 20 × 34 + 15 × 34 cm antenna combination with a −120° phase for the bottom antenna. In the asymmetrical set-up, the phantom was shifted 10 cm to the left. The Z-component of the E-field in the centre of the phantom was normalised to 100% at zero phase.
EHD
The SAR profiles in the Y-direction are shown for the three antennas in . The SAR was normalised to 100% at 1 cm depth under the PVC wall. A comparable EHD is expected since all waveguides operate at the same frequency. The measured EHD was 35, 31 and 27 mm for the 20 × 34, 15 × 34 and 8.5 × 34 cm antennas, respectively. The EHD of a 70 MHz plane wave signal is 36 mm.
Figure 9. SAR profiles as function of the depth on the central transversal axis of the elliptical phantom, for the three different applicators (20 × 34, 15 × 34 and 8.5 × 34 cm).
Antenna properties
The measured antenna properties are presented in . The smaller the antenna the less efficient, as can be observed from the increasing values of reflection coefficient S11, voltage standing wave ratio (VSWR) and reflected power. The reflected power for the 8.5 cm antenna was approximately twice as high as for the 20 cm antenna. Thus, the 8.5 cm antenna has the largest mismatch with the 50 ohm power driver. The reflection spectrum scans obtained with the network analyser on a phantom and on a volunteer show a clear difference. The S11 values at 70 MHz on a phantom are −9.0, −5.0, −2.4 dB and for the volunteer −13.6, −10.8, −9.6 dB for the 20 × 34, 15 × 34 and 8.5 × 34 waveguides, respectively (). Repositioning and breathing of the volunteer can cause significant fluctuations in the reflection coefficient.
Figure 10. Measured reflection loss (S11) as function of frequency for the three waveguides (20 × 34, 15 × 34 and 8.5 × 34 cm). All waveguides are positioned on top of the phantom with a 6 cm bolus in the left graph, and positioned on the chest of a volunteer with ∼6 cm upper bolus in the right graph.
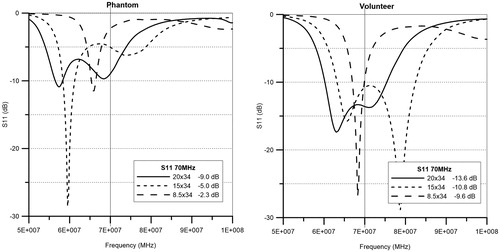
Table 3. Measured values of the reflection coefficient (S11), VSWR and the relative reflected power for each antenna positioned on an elliptical saline phantom with a bolus of 6 cm between antenna and phantom.
Simulations
The simulated E-field distribution in the transversal and sagittal mid-planes of the phantom, for the 20 × 34 + 20 × 34 antenna combination is shown in , generally showing a relative difference smaller than 10% compared to the measured distribution shown in . The measured sagittal distribution is slightly more asymmetrical than the simulated distribution and thus has a maximal deviation of 15% from the simulation shown in . The simulated profiles along the central Y-axis, shown at the right hand side of , match the measured profiles shown in the top graph of with a difference smaller than 10%.
Figure 11. Simulated E-field distributions and profiles of the 20 × 34 + 20 × 34 antenna combination. The distribution in the transversal XY-plane (left), the distribution in the sagittal YZ-plane (middle) and the E-field profiles on the central Y-axis for seven different phase settings (120°, 90°, 45°, 0, −45°, −90° and −120°) of the bottom antenna with respect to the top antenna (right). The Z-component of the E-field in the centre of the phantom was normalised to 100% at 0° phase difference.
Clinical application
Clinical feasibility of the system is illustrated by a treatment of a melanoma located in the left axilla of a male patient. The main results of the treatment series are shown in . A suboptimal phase set-up in the first session and the use of only one antenna in the second session yielded suboptimal tumour temperatures in those first two sessions. Adequate intratumoral temperatures were reached in the third and fourth session, with a T50 of ∼42 °C.
Table 4. Treatment results for a male patient with a melanoma in the left axilla.
In the third session, the tumour temperature stopped rising 35 min after treatment-start. Extra power to the bottom antenna resulted in an additional temperature rise of 1.3 °C and ultimately yielded adequate tumour temperatures. This experience in the third-treatment session was used in the fourth session. An increased bottom power in combination with a 60° change in the phase resulted in adequate tumour temperatures already during the pre-steady-state period in the fourth session. The extra 60° phase shift was introduced to move the impact of the higher bottom energy toward to the tumour and avoid hotspots in the skin and in the dorsal part of the body.
The last two sessions of this treatment show that the AMC-2 system can adequately heat deep-seated tumours.
Discussion
A flexible hyperthermia system with two antennas has been designed to treat deep-seated tumours located in the supraclavicular region and deep-seated superficial tumours. This AMC-2 system operates at the same 70 MHz frequency as the AMC-4 and AMC-8 deep hyperthermia systems [Citation20,Citation21] to assure good penetration of the E-field. The 20 × 34 cm bottom antenna can be rotated over 180°. For the upper antenna, a 20 × 34, 15 × 34 or 8.5 × 34 cm waveguide can be selected, depending on the tumour size and location. The upper antenna should be placed on the patient’s chest, aligned with the tumour centre and bottom antenna. But even in an asymmetrical set-up where the patient has to be shifted horizontally, this will not necessarily lead to a serious under dosage in clinical applications, when the part of the body is not the target, as shown in .
Results showed that all waveguides developed for this system are suitable for clinical hyperthermia. The EHD, EFS and FWHM allow to heat deep-seated tumours. According to the QA guidelines, a muscle phantom with a 1 cm fat layer should be used to characterise heating patterns. In this study, a phantom with a 2 mm PVC shell was used, which yields similar heating patterns as shown by Schneider et al. [Citation24]. Furthermore, we used an elliptical phantom instead of a rectangular phantom, since this is a more realistic representation for clinical applications. A drawback of this approach is the difficulty to determine an exact EFS and FWHM in the transversal midplane, because of the curved surface which bounds the E-field contour in the X-direction. However, the use of an elliptical phantom shows realistic heating patterns and results show that the effectively heated region is sufficiently large for clinical applications.
The measured and simulated E-field distributions for the 20 × 34 + 20 × 34 antenna combination in the phantom correspond within 10% except for the Z+ side of the sagittal plane. The larger difference (15%) at this location is caused by a slight asymmetry of the distribution, which can be due to asymmetry of the phantom in the Z-direction with a boundary on one side and the opening to provide access for the probe on the other side ().
In clinical practice, the maximum tumour depth that can be adequately heated by a single antenna is ∼4–6 cm. Much deeper located tumours can be adequately heated by adding the second, contra-lateral applicator and the phase steering. The clinical application in a melanoma treated with the 8.5 × 34 and 20 × 34 cm applicator combination shows adequate temperatures at 10 cm depth. The EHD was found to decrease with the aperture size of the waveguide. This decrease is logical since the emitted E-field pattern of smaller applicators deviates more from a perfect plane wave which has an EHD of 3.6 cm at 70 MHz.
Some techniques have been described in the literature to significantly increase the effectively heated region. Leybovich et al. [Citation31] developed a dual-antenna applicator to extend the EFS by ∼80% in the direction perpendicular to the E-field by using two-antenna rods in one 110 MHz waveguide [Citation31]. However, this approach would not help to treat larger tumours in our case, since the 50% SAR in the critical direction is 8 cm, which is almost equal to the width of the antenna.
The smallest waveguides showed a lower efficiency and a larger mismatch compared to the standard 20 × 34 cm waveguide on the phantom. All S11 values on the phantom are lower than on the volunteer as can be seen in the S11 graphs (). The PVC phantom shell appears to give higher reflection compared to the skin and fat layer of the volunteer. The S11 values obtained on the volunteer thus give a better prediction of the mismatch during clinical use. The mismatch causes a loss of efficiency that can be compensated by a higher amount of forward power and is therefore not a problem for clinical use. Furthermore, field patterns become asymmetrical when a smaller top antenna is used. The operator should be aware of this possible asymmetry, since appropriate phase steering may be necessary to ensure good SAR coverage, as shown in and .
The intended patient group for treatment with the AMC-2 system consists of deep-seated breast and supraclavicular tumours. The selected top antenna should be as large as possible to ensure a good SAR coverage of the target region. The more cranial the tumour location the smaller the antenna that can be used. A two-antenna set-up is generally preferred, since this allows to heat a larger region compared to a single-antenna set-up. A two-antenna set-up also provides the possibility to apply phase steering to improve SAR coverage of the tumour. A single-antenna set-up should be considered only for superficial tumour locations (<6 cm), or when the second antenna cannot be used, e.g. when the tumour is located too close to the neck of the patient. Which configuration, i.e. a set-up with one or two antennas, is most beneficial in terms of SAR coverage has to be determined before the start of the treatment.
There are some limitations to the clinical use of this system. The upper antenna can only be used in vertical position due to the use of the open water bolus. The relatively large size of the 70 MHz antennas makes it difficult to heat the smaller tumours in the head and neck region. Tumour coverage is a problem for large deep-seated tumours as for example cervix tumours, these cannot be heated adequately with only two 70 MHz antennas and should be heated using the existing deep hyperthermia devices with four or more antennas.
Clinical radiative deep hyperthermia systems are commercially available. The Pyrexar Company (Salt lake City, UT) produces a complete line of superficial and deep systems [Citation32,Citation33]. A new phased array waveguide system from ALBA (Rome, Italy), based on the AMC-4 system from Amsterdam [Citation18–21], is coming on the market. Furthermore, there are different capacitive RF deep hyperthermia systems in use [Citation34–36]. The Pyrexar BSD2000–3D system with Sigma Eye applicator consists of three dipole rings in a fixed cylindrical configuration, as result placement of patients in the applicator is limited to locations below the location of the arms. Focusing energy into a tumour in the upper part of the trunk will thus be challenging, even when using the cranial-caudal phase steering. The single bolus of this system can also be a limiting factor to heat tumours close to the head of the patient. Capacitive RF systems have smaller, flexible applicators and are an option to heat tumours in the upper region. An adequate tumour temperature elevation can be obtained, but with a high risk of causing very high temperatures in the superficial fat and muscle layers [Citation34–36].
A number of new applicators for deep superficial heating have been developed in the last decade. Less new applicator designs have been proposed for deep-seated tumours beside existing clinical systems like the aforementioned 100 MHz phased array system of Pyrexar and the 70MHz AMC-4 system. The 27 MHz inductive-folded loop antenna of Kouloulias et al. [Citation10] is a promising new development. Its large PD of 8 cm makes this antenna a good candidate for heating deep-seated tumours. The low frequency and field shape probably make creation of a tumour-conformal SAR focus in deep-seated tumours like cervix a challenge. Important advantage of this antenna is the small size (20 cm) and simple construction which can make this antenna a good candidate for heating superficial tumours with deep infiltration in the upper part of the trunk. The latter also applies for the 70 MHz microstrip applicator arrays developed Kosterev et al. [Citation17].
The E-field profiles show that a phase change can be necessary to correct for the asymmetry when using unequal sized antennas. The required phase correction can be determined at the start of treatment using the phase optimisation procedure used during loco-regional hyperthermia treatments with the four antenna AMC-4 system [Citation37]. This procedure involves temperature rise measurements performed with three distinctly different phase settings for the dorsal antenna. A similar procedure can be applied when using the double waveguide system, using the intratumoral thermometry measurements.
Hyperthermia treatment planning can be very helpful to compare the quality of heating for different set-ups and rotation angles of the antennas [Citation38]. Pre-treatment planning can also be helpful to determine the optimal temperature of the water bolus. To translate results of treatment planning to the clinic, accurate reproducibility of the positioning of the patient and the antennas is essential.
For a reproducible set-up, the positioning parameters, e.g. the rotation angles of the antennas, should be documented. A reproducible set-up is very important to ensure continuous treatment quality of all sessions for each patient. The optimal power ratio and phase setting for tumour heating should be determined during the pre-steady-state period. Invasive temperature measurements in the tumour are therefore indispensable for treatment monitoring.
The clinical example demonstrated the feasibility of heating large tumours in the axilla with the AMC-2 system. As stated above, the relatively large reflection coefficient of the 8.5 × 34 cm waveguide could be compensated by a higher amount of forward power. Clinical results showed that a T50 of 42 °C can be achieved, provided adequate antenna positioning and phase-amplitude steering. However, this is not trivial and requires some training of the treatment operator. Patient positioning and amplitude-phase steering for the AMC-2 system requires more experience compared to the AMC-4 or AMC-8 phased array system.
Conclusion
The flexible 70 MHz AMC-2 waveguide system is suitable to heat tumours up to a depth of 12 cm and is therefore a useful addition to the rigid loco-regional AMC-4 and AMC-8 hyperthermia equipment for heating of deep-seated advanced breast, axillary and supraclavicular tumours. A single 70 MHz waveguide antenna can be considered for large tumours deeper than 4 cm where superficial systems operating at 434 or 915 MHz cannot provide adequate heating because of the small PD. If possible, the double antenna set-up is preferred as this allows better SAR coverage by phase-amplitude steering.
Disclosure statement
The authors report no conflicts of interest. The authors alone are responsible for the content and writing of the paper.
References
- Franckena M, Stalpers LJA, Koper PCM, et al. (2008). Long-term improvement in treatment outcome after radiotherapy and hyperthermia in locoregionally advanced cervix cancer: an update of the Dutch Deep Hyperthermia Trial. Int J Radiat Oncol Biol Phys 70:1176–82.
- Issels RD, Lindner LH, Verweij J, et al. (2010). Neo-adjuvant chemotherapy alone or with regional hyperthermia for localised high-risk soft-tissue sarcoma: a randomised phase 3 multicentre study. Lancet Oncol 11:561–70.
- Overgaard J, Bentzen SM, Gonzalez Gonzalez D, et al. (1995). Randomised trial of hyperthermia as adjuvant to radiotherapy for recurrent or metastatic malignant melanoma. European Society for Hyperthermic Oncology. The Lancet 345:540–3.
- Van der Zee J, González González D, Van Rhoon GC, et al. (2000). Comparison of radiotherapy alone with radiotherapy plus hyperthermia in locally advanced pelvic tumours: a prospective, randomised, multicentre trial. Dutch Deep Hyperthermia Group. Lancet 355:1119–25.
- Vernon CC, Hand JW, Stanley BF, et al. (1996). Radiotherapy with or without hyperthermia in the treatment of superficial localized breast cancer: results from five randomized controlled trials. International Collaborative Hyperthermia Group. Int J Radiat Oncol Biol Phys 35:731–44.
- Harima Y, Ohguri T, Imada H, et al. (2016). A multicentre randomised clinical trial of chemoradiotherapy plus hyperthermia vs. chemoradiotherapy alone in patients with locally advanced cervical cancer. Int J Hyperthermia 32:801–8.
- Datta NR, Puric E, Klingbiel D, et al. (2016). Hyperthermia and radiation therapy in locoregional recurrent breast cancers: a systematic review and meta-analysis. Int J Radiat Oncol Biol Phys 94:1073–87.
- Cihoric N, Tsikkinis A, van Rhoon G, et al. (2015). Hyperthermia-related clinical trials on cancer treatment within the ClinicalTrials.gov registry. Int J Hyperthermia 31:609–14.
- Datta NR, Gomez Ordonez S, Gaipl US, et al. (2015). Local hyperthermia combined with radiotherapy and/or chemotherapy: recent advances and promises for the future. Cancer Treat Rev 41:742–53.
- Kouloulias V, Karanasiou I, Giamalaki M, et al. (2015). Theoretical analysis, design and development of a 27-MHz folded loop antenna as a potential applicator in hyperthermia treatment. Int J Hyperthermia 31:23–32.
- Myerson RJ, Perez CA, Emami B, et al. (1990). Tumor control in long-term survivors following superficial hyperthermia. Int J Radiat Oncol Biol Phys 18:1123–9.
- van der Zee J, Holt van der B, Rietveld PJM, et al. (1999). Reirradiation combined with hyperthermia in recurrent breast cancer results in a worthwhile local palliation. Br J Cancer 79:483–90.
- Oldenburg S, Griesdoorn V, van Os R, et al. (2015). Reirradiation and Hyperthermia for irresectable locoregional recurrent breast cancer in previously irradiated area: size matters. Radiother Oncol 117:223–8.
- Curto S, Prakash P. (2015). Design of a compact antenna with flared groundplane for a wearable breast hyperthermia system. Int J Hyperthermia 31:726–36.
- Gelvich EA, Mazokhin VN. (2002). Contact flexible microstrip applicators (CFMA) in a range from microwaves up to short waves. IEEE Trans Biomed Eng 49:1015–23.
- van Wieringen N, Wiersma J, zum Vörde Sive Vörding P, et al. (2009). Characteristics and performance evaluation of the capacitive Contact Flexible Microstrip Applicator operating at 70 MHz for external hyperthermia. Int J Hyperthermia 25:542–53.
- Kosterev VV, Kramer-Ageev EA, Mazokhin VN, et al. (2015). Development of a novel method to enhance the therapeutic effect on tumours by simultaneous action of radiation and heating. Int J Hyperthermia 31:443–52.
- Schneider CJ, Kuijer JPA, Colussi LC, et al. (1995). Performance evaluation of annular arrays in practice: the measurement of phase and amplitude patterns of radio-frequency deep body applicators. Med Phys 22:755–65.
- Wiersma J, van Dijk JDP, Sijbrands j, Schneider CJ. (1998). The measurement of fringing fields in a radio-frequency hyperthermia array with emphasis on bolus size. Int J Hyperthermia 14:535–51.
- van Dijk JDP, Schneider C, van Os R, et al. (1990). Results of deep body hyperthermia with large waveguide radiators. Adv Exp Med Biol 267:315–19.
- Crezee J, van Haaren PMA, Westendorp H, et al. (2009). Improving locoregional hyperthermia delivery using the 3-D controlled AMC-8 phased array hyperthermia system: a preclinical study. Int J Hyperthermia 25:581–92.
- Van der Gaag ML, De Bruijne M, Samaras T, et al. (2006). Development of a guideline for the water bolus temperature in superficial hyperthermia. Int J Hyperthermia 22:637–56.
- Lagendijk JJW, Molls M. (1991). Conclusions deep body QA. Comac-BME Bulletin 5:95–6.
- Schneider CJ, Olmi R, van Dijk JDP. (1995). Phantom design: applicability and physical properties. In: Seegenschmiedt MH, Fessenden P, Vernon CC, eds. Thermoradiotherapy and thermochemotherapy. Vol. 1. Biology, physiology and physics. Berlin: Springer, 381–97.
- Trefná H, Crezee J, Schmidt M, et al. (2017). Quality assurance guidelines for superficial hyperthermia clinical trials: I. clinical requirements. Int J Hyperthermia. [Epub ahead of print]. doi: 10.1007/s00066-017-1106-0.
- Kok HP, Bakker A, van Stam G, Crezee J. A 70 MHz double waveguide setup for hyperthermia of deep superficial tumours. Proceedings European Microwave Week 2016, 2016 October 3–7; London.
- Lagendijk JJ, Van Rhoon GC, Hornsleth SN, et al. (1998). ESHO quality assurance guidelines for regional hyperthermia. Int J Hyperthermia 14:125–33.
- Dewhirst MW, Phillips MD, Samulski TV, et al. (1990). RTOG quality assurance guidelines for clinical trials using hyperthermia. Int J Radiation Oncology Biol Phys 18:1249–59.
- de Leeuw AA, Crezee J, Lagendijk JJ. (1993). Temperature and SAR measurements in deep-body hyperthermia with thermocouple thermometry. Int J Hyperthermia 9:685–97.
- Bruggmoser G, Bauchowitz S, Canters R, et al. (2011). Quality assurance for clinical studies in regional deep hyperthermia. Strahlenther Onkol 187:605–10.
- Leybovich LB, Emami B, Myerson RJ, et al. (1991). Dual-antenna applicator for hyperthermia of tumours at intermediate depth. Int J Hyperthermia 7:455–64.
- Turner PF, Tumeh A, Schaefermeyer T. (1989). BSD-2000 approach for deep local and regional hyperthermia: physics and technology. Strahlenther Onkol 165:738–41.
- Wust P, Beck R, Berger J, et al. (2000). Electric field distributions in a phased-array applicator with 12 channels. Med Phys 27:2565–79.
- Kroeze H, van de Kamer JB, de Leeuw AA, et al. (2003). Treatment planning for capacitive regional hyperthermia. Int J Hyperthermia 19:58–73.
- Shoji H, Motegi M, Osawa K, et al. (2016). Output-limiting symptoms induced by radiofrequency hyperthermia. Are they predictable? Int J Hyperthermia 32:199–203.
- Kok HP, Crezee J. (2017). A comparison of the heating characteristics of capacitive and radiative superficial hyperthermia. Int J Hyperthermia. [Epub ahead of print]. doi: 10.1080/02656736.2016.1268726.
- Kok HP, Ciampa S, de Kroon-Oldenhof R, et al. (2014). Towards on-line adaptive hyperthermia treatment planning: correlation between measured and simulated SAR changes caused by phase steering in patients. Int J Radiat Oncol Biol Phys 90:438–45.
- Kok HP, de Greef M, van Wieringen N, et al. (2010). Comparison of two different 70 MHz applicators for large extremity lesions: simulation and application. Int J Hyperthermia 26:376–88.