
Abstract
One of the most common reasons inducing discomfort in wearing a respirator is an unpleasant local thermal perception. In this study, the effect of a power-assisted filtering device incorporating a full-face mask on the thermophysiological response was investigated by performing tests on a Newton manikin in a climatic chamber, where hot conditions were simulated setting the ambient temperature at 34 °C and the relative humidity at 32%. Two different levels of metabolic rate (1 MET and 3 MET) were considered. Results show that the variation of metabolic rate plays an important role in the heat exchanges with the environment causing different values of the local and global temperatures. At 1 MET the manikin is in thermal balance with the external environment with or without respirator. At 3 MET although the thermoregulation system is very stressed (the rectal temperature Tre increases continuously with or without respirator), the effect of the respirator produces a small decrease of the local and global temperatures and also of the amount of sweat generated by active thermoregulation Swa (reaching its maximum value of 30 g/min when the respirator is not worn). Furthermore, a little amelioration of the face and body sensation and comfort was observed. In any case, wearing the respirator seems not to provide additional thermal load.
Introduction
Respiratory protective devices are used to protect workers from inhalation of hazardous atmospheres. When such devices are uncomfortable and the health risk is not perceveid as immediate, they are sometimes removed or not worn [Citation1]. Discomfort resulting from wearing respirators has been ascribed to the decrease in heat exchanges between the person wearing respirator and the environment [Citation2].
Some studies have noted that the use of respiratory protective devices has impacts on thermoregulation [Citation3]. Facial warmth is one of the most common complaints, and it was ascribed to temperature and humidity increase in the breathing zone during the use. At the same time, little impact was observed on core body temperature [Citation4].
Other studies have attempted to quantify the subjective assessment of discomfort associated with face skin temperature while wearing a respirator; they concluded that a face skin temperature under the respirator greater than 34.5 °C was considered by the wearers to be warm and uncomfortable [Citation2,Citation5–7]. The cooling of the face by an ambient air flow may be a practical method to minimise the thermophysiological strain and to reduce perceived discomfort [Citation6,Citation8–11]; it was also demonstrated that cooling the face improves thermoregulation system response and comfort during hyperthermia [Citation12].
Power-assisted filtering devices require a low inspiratory effort as they supply a continuous stream of filtered ambient air to the breathing zone. The flow provides benefit to comfort and thermal sensation of the face compared to no power-assisted devices, as reported explicitly by Johnson et al. [Citation11] in the case of a tight fitting powered air purifying respirator at different flow rates.
The aim of this work is to investigate the effect of a power-assisted filtering device incorporating a full-face mask on the thermophysiological response of a thermal manikin by carrying out tests in a climatic chamber in hot conditions and considering two different levels of metabolic rate. Thermal manikins are widely used in the field of ergonomics of thermal environment because they allow for the simulation of the physiological human response to a given environment in terms of global and local effects such as temperature and thermal comfort and sensation.
Methods
The study is based on experimental tests performed in climatic chamber carried out by using a Newton sweating thermal manikin (Thermetrics LLC, Seattle, WA).
Respiratory protective device
The respirator utilised in this study is a power-assisted filtering device classified as TM3P R SL, meeting the requirements of the European Standard [Citation13]. The respirator consists of a powered fan system that forces the contaminated ambient air through a particle filter and supplies the purified air to a tight fitting full-face mask by means of a breathing hose.
The mask, which can be used also in negative pressure respirators, has an oro-nasal cup whose main function in negative mode is to reduce respirator dead space. When the mask is used in power-assisted mode, the air is first addressed to the screen zone, then it enters the oro-nasal cup through the inner cup valves and finally it exits directly to the outside through the exhalation valve. The whole facial area is involved in the circulation of the airflow.
The minimum flow rate, as stated by the manufacturer, is 160 l/min for a duration of not less than 4 h. The powered fan system with its own battery is fastened to a waist belt held by the thermal manikin.
Thermal manikin
The sweating thermal manikin Newton [Citation14,Citation15], used in this study, is a standard 26-thermal zone configuration. The simulation is regulated by Manikin PC software package (Thermo Analytics, Inc., Calumet Township, MI) which includes two modules: the Human Physiological Model, which implements the Fiala Model of Human Thermoregulation [Citation16,Citation17] and the Human Comfort Model, based on the Berkley Human Comfort Model developed by Hui Zhang, PhD at the Berkley Center for the Built Environment [Citation18–20]. The first module allows one to perform a virtual thermal simulation of human response to thermal environment; the second is employed to compute local and whole-body sensation and comfort as a function of local skin and core temperature and their rate of changes. Newton has 50th percentile Western Male body form and its surface area is 1.697 m2.
The models used allow one to investigate both local effects (skin surface temperature, comfort and sensation of each zone) and global effects (mean skin temperature Tsk, rectal temperature Tre, overall thermal sensations, etc.).
Test protocol establishes that the manikin is first preheated to a thermal neutral state with chamber being at thermoneutral conditions then the chamber was brought to the test conditions, model control was initiated and test was started. The levels of metabolic rate are input data and the manikin generates metabolic heating levels as requested by the regulation model.
Sensation is a measure of how warm or cold the environment around the manikin feels relative to skin temperature. Sensation is based on a nine-point thermal sensation scale where −4 corresponds to a rating of “very cold”, −3 “cold”, −2 “cool”, −1 “slightly cool”, 0 “neutral”, 1 “slightly warm”, 2 “warm”, 3 “hot” and 4 “very hot”. Comfort is based on a scale of −4 (very uncomfortable) to 4 (very comfortable); 0 value represents a “comfortable” state.
Test protocol
The environmental conditions simulated in the climatic chamber were: air temperature, ta = 34.3 °C, relative humidity, RH = 32%, air velocity, va = 0.3 m/s.
The manikin wore a 100% cotton short-sleeved shirt, 100% cotton work pants, ankle-length athletic socks and athletic shoes (thermal characteristics of the clothing ensemble are: Icl = 0.59 clo, .
Two experimental conditions were considered:
Control condition (CC): the manikin performs activities without wearing the respirator and
Respirator condition (RC): the manikin performs activities wearing the respirator with power switched on.
Each condition was tested for two levels of activity: resting (the metabolic rate M was set to 1 MET) and moderate activity (M was set to 3 MET) according to Table A.2 of ISO 8996 [Citation21].
Each test was replicated three times and 12 tests were performed overall. Each test lasts until the steady state is reached. During the tests the manikin is in a standing stationary position.
Mean values of the following variables are considered: face (Tface) and head (Thead) temperatures, mean skin temperature (Tsk), rectal temperature (Tre), amount of sweat generated by active thermoregulation (Swa in g/min), face and body sensation, face and body comfort where “face” identifies the anterior part of the head and “head” the occipital area of the head. Due to the presence of an oro-nasal block, where temperature sensors are not present, Tface does not take into account this area.
Statistical analysis
The statistical analysis was performed using SPSS 17.0 software (SPSS Inc. Chicago, IL).
Paired t-test was used to detect any significant differences in the main variables considered at the time of reaching 38 °C.
A repeated-measures analysis of variance (ANOVA) was used to determine the main effects of the variables considered at the 150th minute of testing. The least significant difference (LSD) test was chosen for the post hoc pairwise comparison.
p values <0.05 were considered statistically significant.
Results
provides the dynamics of the surface skin temperatures of the two local zones: the head (Thead) and the face (Tface) underneath the full-face mask.
Figure 1. Tface and Thead for the tested conditions.
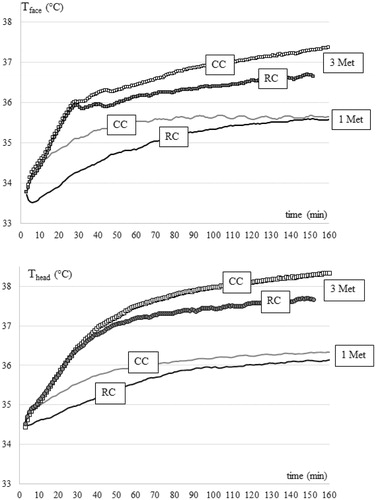
It can be noticed that:
Both Tface and Thead reach high values in the two conditions with M = 3 MET;
Thead values are higher than Tface values for all the conditions being considered;
In the resting state (M = 1 MET), Tface and Thead tend to very close values at the steady state condition (time >100 min). This trend is not valid in case of M = 3 MET: after a first common rapid increase, CC and RC curves tend to diverge and the effect of the respirator becomes evident after 30 min. In fact, a difference of ∼0.5 °C between RC and CC can be noticed at the 150th minute.
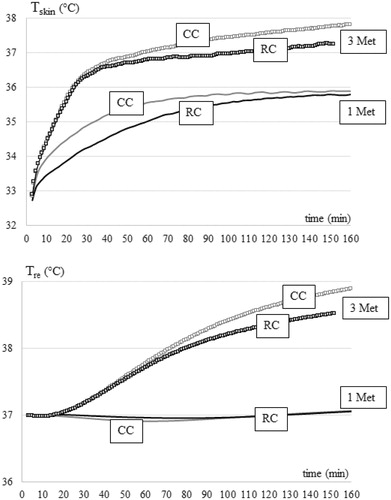
plots time variation of Tsk and Tre in order to describe the response of the body as a whole. Also for these variables, it can be noticed how the metabolism plays a determinant role causing an evident increase of the temperatures when it is set to 3 MET. At this activity level the respirator’s effect comes out causing a long-term effect (time >100 min) consisting in a decrease of ∼0.5 °C for Tsk and of ∼0.4 °C for Tre, if compared with CC.
Figure 2. Tsk and Tre for the tested conditions.
provides the time variation of face and body average sensation for the tested conditions. It shows that the face feels hot more than rest of the body in all the tested conditions and for the whole duration of the tests.
Figure 3. Time variation of face and body average sensations for the conditions tested.
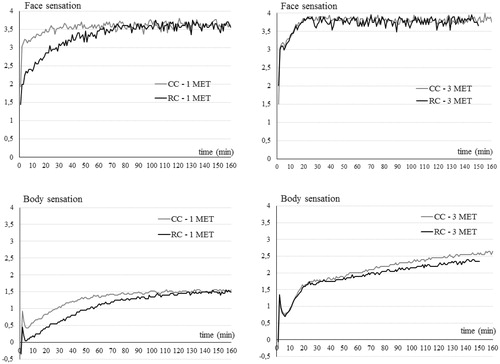
The curves of the face sensation (upper part of ) show that, in the CC and for both the activity levels considered, the steady state is reached at about the 20th minute from the start of the test. In the RC, the activity level influences the time of steady state achievement, which is ∼60 min from the beginning of the test for M = 1 MET and ∼20 min for M = 3 MET.
The body sensation curves (lower part of ) show that in case of 1 MET, for both CC and RC, the steady state is reached at the 100th minute. On the contrary, at 3 MET the body sensation curves show an increasing trend and the steady state is not as evident as in the other cases.
shows the values of the main variables, considered in this study, when Tre reaches 38 °C and at the 150th minute of testing. It can be noticed that Tre reaches 38 °C only for M = 3 MET and that, in this condition, the presence of the respirator protracts the time of reaching that temperature by few minutes. Results show also that at the 150th minute the face feels almost “very hot” (sensation value is ∼3.5 for M = 1 MET and 3.9 and 3.7 for M = 3 MET, respectively in CC and RC); the face comfort is close to “very uncomfortable” (comfort value is −3.3 and −3.4 for M = 1 MET and −3.8 and −3.5 for M = 3 MET, respectively in CC and RC). The whole body tends to a rate between “warm” and “hot” for M = 3 MET (2.4 in RC and 2.6 in CC) and between “slightly warm” and “warm” for M = 1 MET (1.5 in both conditions). In case of M = 3 MET, the respirator produces a decrease of 0.2 of the sensation rate (body and face) at the steady state (150th minute).
Table 1. Values of the considered variables when Tre reaches 38 °C and at the 150th minute of testing.
The amount of sweat generated by active thermoregulation (Swa) at 1 MET differs considerably from the amount produced at 3 MET: Swa is 3.9 and 3.7 g/min (for M = 1 MET respectively in CC and RC) and 30 and 26.7 g/min (for M = 3 MET respectively in CC and RC).
Paired t-test, applied to the results at the time when Tre reaches 38 °C, shows no statistically significant differences. The repeated-measures analysis of variance (ANOVA) shows statistically significant differences related to the presence of the respirator (CC vs. RC) and to the activity level (1 MET vs. 3 MET). Results of the LSD tests, applied to CC vs. RC at the 150th minute, shows statistically significant differences for all the variables listed in except for face comfort (p = 0.059). When the effect of the activity level was investigated (1 MET vs. 3 MET at the 150th minute) the LSD test revealed statistically significant differences in case of Thead (p = 0.039), Tsk (p = 0.013), Tre (p = 0.038), Swa (p = 0.00), body sensation (p = 0.023).
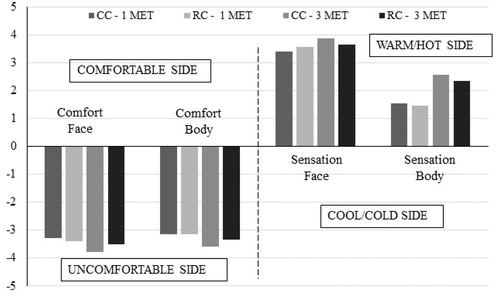
provides a comparison between local and global effects (face vs. body) in terms of comfort and sensation at the steady state condition (150th minute) for the conditions tested. The face is in a condition of discomfort: comfort values are −3.3 and −3.4 (i.e. between “uncomfortable” and “very uncomfortable”) for M = 1 MET and −3.8 and −3.5 for M = 3 MET, respectively in CC and RC as shown in and . The use of the respirator at 3 MET produces a variation of 0.3 of face comfort and 0.2 of body comfort, towards the comfortable state.
Figure 4. Comfort and sensation values of face and body at the 150th minute of testing.
Discussion
The results obtained are strictly dependent on the conditions tested in terms both of environmental conditions and of metabolic rate; every variation of the above-mentioned experimental settings can cause a different physiological response of the thermal manikin. In fact, results show that the variation of metabolic rate plays an important role in the heat exchanges with the environment and it causes different values of local and global temperatures.
In fact, at 1 MET it can be noticed that the manikin is in thermal balance with the external environment: Tre remains constant at ∼37 °C during the test and the low values of Swa imply that the thermoregulation system is little stressed. The effect of the respirator emerges in the first 60 min and produces a decrease of Tface, Thead, Tsk values even if the face sensation rate is between “hot” and “very hot” with and without the respirator (respectively in RC and CC). Furthermore, at M = 1 MET we observed a good agreement between our Tface values and the values of the forehead temperature (TFH), measured on human subjects and reported in [Citation8], both in the CC and when the respirator is worn (in [Citation8] this condition is named BZC). Specifically, if we compare the steady state values (at the 90th minute of Caretti and Barker’s results and 150th minute of our tests), Caretti and Barker obtained TFH = 35.3 ± 0.4 °C and TFH = 35.2 ± 0.7 °C, respectively in CC and BZC while we obtained Tface about 35.7 ± 0.1 °C and 35.6 ± 0.1 °C, respectively in CC and RC.
By contrast, at 3 MET the thermal balance is not reached in fact the Tre presents an increasing trend during the experiments which is weakened by the effect of the respirator. The action of the respirator arises firstly from Tface (between the 20th and the 30th minutes), then from Tsk and Thead, and finally from Tre (between the 60th and the 70th minutes) as shown in and in . The continuously increasing trend of Tre (in CC and RC) implies that the thermoregulation system is not able to dissipate the heat produced by the activity performed in the hot environment being considered. In fact the Swa reaches the value of 30 g/min, which is an approximation of the maximum human body sweating capacity experienced by individuals wearing clothing while engaged in light-intensity exercise [Citation22], and this Swa value shows the high stress level of the thermoregulation system. At this activity level, the respirator’s effect is evident for t > 30 min and produces a decrease of local and global temperatures. This effect seems to also affect both face and body sensation causing a little decrease of 0.2 in the sensation scale even if the face and body rates are respectively “very hot” and between “warm” and “hot” (RC and CC). At this activity level, which can simulate a real work activity, it appears that the ambient air flow on the face could produce a little amelioration of the body’s thermal condition in terms of local and global temperatures other than giving protection to the users [Citation3,Citation6,Citation8–12].
In both cases (M = 1 MET and M = 3 MET) the effect of the hot environment is weakened by the action of the respirator which allows a continuous heat exchange removing and renovating the air layer around the face without providing an additional thermal load. The effect of the respirator occurs at different times depending on the metabolic rate: for M = 1 MET during the first 60 minutes while for M = 3 MET at t > 60 min.
Finally Tface seems to have a huge weight in Tsk calculation. In hot environment, the face is very thermosensitive [Citation3] and it influences significantly the thermal state of the whole body [Citation3]. The highly thermosensitive nature of the face is exemplified by the fact that face cooling is from two to five times more effective than cooling any other equivalent segment of the body [Citation23].
Limitations of the study
The limitations of the study are related to the fact that, in the simulations carried out, the thermal manikin was in a standing, static position (i.e. other postures or movements of the body were not taken into account). Furthermore, the weight of the powered fan system would be added to the work load and this was not factored in this study.
Conclusions
Results obtained in the present study, by tests carried out on a Newton manikin in hot environment, indicate that the effect of the respirator is dependent on the activity level performed.
For both the activity levels tested (M = 1 MET and M = 3 MET), the respirator seems not to provide additional thermal load in comparison to the conditions where the respirator is not worn (control condition). Furthermore, at the moderate activity level (M = 3 MET), the respirator produces a small decrease of local and global temperatures and a little amelioration of the face and body sensation and comfort.
Disclosure statement
The authors report no conflicts of interest. The authors alone are responsible for the content and writing of this article.
References
- Morgan WP. (1983). Psychological problems associated with the wearing of Industrial respirators: a review. Am Ind Hyg Assoc J 44:671–6.
- Gwosdow AR, Nielsen R, Berglund LG, et al. (1989). Effect of thermal conditions on the acceptability of respiratory protective devices on humans at rest. Am Ind Hyg Assoc J 50:188–95.
- Roberge RJ, Kim JH, Coca A. (2012). Protective facemask impact on human thermoregulation: an overview. Ann Occup Hyg 56:102–12.
- Roberge RJ, Benson S, Kim JH. (2012). Thermal burden of N95 filtering facepiece respirators. Ann Occup Hyg 56:808–14.
- Nielsen R, Berglund LG, Gwosdow AR, et al. (1987). Thermal sensation of the body as influenced by the thermal microclimate in a face mask. Ergonomics 30:1689–703.
- DuBois AB, Harb ZF, Fox SH. (1990). Thermal discomfort of respiratory protective devices. Am Ind Hyg Assoc J 51:550–4.
- Jones JG. (1991). The physiological cost of wearing a disposable respirator. Am Ind Hyg Assoc J 52:219–25.
- Caretti DM, Barker DJ. (2014). Effects of respirator ambient air cooling on thermophysiological responses and comfort sensations. J Occup Environ Hyg 11:269–81.
- Hirata K, Nagasaka T, Nunomura T, et al. (1987). Effects of facial fanning on local exercise performance and thermoregulatory responses during hyperthermia. Eur J Appl Physiol 56:43–8.
- Katsuura T, Tomioka K, Harada H, et al. (1996). Effects of cooling portions of the head on human thermoregulatory response. Appl Human Sci 15:67–74.
- Johnson AT, Mackey KR, Scott WH, et al. (2005). Exercise performance while wearing a tight-fitting powered air purifying respirator with limited flow. J Occup Environ Hyg 2:368–73.
- Kato M, Sugenoya J, Matsumoto T, et al. (2001). The effects of facial fanning on thermal comfort sensation during hyperthermia. Pflugers Arch Phy 443:175–9.
- European Committee for Standardization. EN 12942:1998; EN 12942:1998/A1:2002; EN 12942:1998/A2:2008. Respiratory protective devices – power assisted filtering devices incorporating full face masks, half masks or quarter masks – requirements, testing, marking. Available from: www.cen.eu
- Burke R, Curran A, Hepokoski M. Integrating an active physiological and comfort model to the Newton sweating thermal manikin. Proceedings of the 13th International Conference on Environmental Ergonomics (ICEE). Wollongong: University of Wollongong; 2009, 313–17. Available from: http://www.lboro.ac.uk/microsites/lds/EEC/ICEE/textsearch/09proceedings/ICEE13-Proceedings.pdf
- Blood K, Burke R. Further validation of the model-controlled Newton thermal manikin against historical human studies. Proceedings of the 8th international meeting for thermal manikin and modeling (8I3M). Victoria, Canada; 2010.
- Fiala D, Lomans KJ, Stohrer M. (1999). A Computer model of human thermoregulation for a wide range of environmental conditions: the passive system. J Appl Physiol 87:1957–72.
- Fiala D, Lomans KJ, Stohrer M. (2001). Computer prediction of human thermoregulatory and temperature responses to a wide range of environmental conditions. Int J Biometeorol 45:143–59.
- Zhang H, Arens E, Huizenga C. (2006). Partial- and whole-body thermal sensation and comfort, Part I: uniform environmental conditions. J Therm Biol 31:53–9.
- Zhang H, Arens E, Huizenga C. (2006). Partial- and whole-body thermal sensation and comfort, Part II: non-uniform environmental conditions. J Therm Biol 31:60–6.
- Zhang H, Arens E, Huizenga C, Han T. (2010). Thermal sensation and comfort models for non- uniform and transient environments, Part III: whole-body sensation and comfort. Build Environ 45:399–410.
- International Organization for Standardization. ISO 8996. Ergonomics of the thermal environment – determination of metabolic rate. Genève, Switzerland: International Organization for Standardization; 2004. Available from: www.iso.org
- Coca A, Di Leo T, Jung-Hyun K, et al. (2015). Baseline evaluation with the sweating thermal manikin of personal protective ensembles recommended for use in west Africa. Disaster Med Public Health Prep 9:536–42.
- Cotter JD, Taylor NAS. (2005). The distribution of cutaneous sudomotor and alliesthesial thermosensitivity in mildly heat-stressed humans: an open-loop approach. J Physiol 565:335–45.