
 ?Mathematical formulae have been encoded as MathML and are displayed in this HTML version using MathJax in order to improve their display. Uncheck the box to turn MathJax off. This feature requires Javascript. Click on a formula to zoom.
Abstract
Purpose: Biological modelling of thermoradiotherapy may further improve patient selection and treatment plan optimisation, but requires a model that describes the biological effect as a function of variables that affect treatment outcome (e.g. temperature, radiation dose). This study aimed to establish such a model and its parameters. Additionally, a clinical example was presented to illustrate the application.
Methods: Cell survival assays were performed at various combinations of radiation dose (0–8 Gy), temperature (37–42 °C), time interval (0–4 h) and treatment sequence (radiotherapy before/after hyperthermia) for two cervical cancer cell lines (SiHa and HeLa). An extended linear-quadratic model was fitted to the data using maximum likelihood estimation.
As an example application, a thermoradiotherapy plan (23 × 2 Gy + weekly hyperthermia) was compared with a radiotherapy-only plan (23 × 2 Gy) for a cervical cancer patient. The equivalent uniform radiation dose (EUD) in the tumour, including confidence intervals, was estimated using the SiHa parameters. Additionally, the difference in tumour control probability (TCP) was estimated.
Results: Our model described the dependency of cell survival on dose, temperature and time interval well for both SiHa and HeLa data (R2=0.90 and R2=0.91, respectively), making it suitable for biological modelling.
In the patient example, the thermoradiotherapy plan showed an increase in EUD of 9.8 Gy that was robust (95% CI: 7.7–14.3 Gy) against propagation of the uncertainty in radiobiological parameters. This corresponded to a 20% (95% CI: 15–29%) increase in TCP.
Conclusions: This study presents a model that describes the cell survival as a function of radiation dose, temperature and time interval, which is essential for biological modelling of thermoradiotherapy treatments.
Introduction
Thermoradiotherapy, i.e. radiotherapy combined with hyperthermia, is an effective treatment for a wide range of tumours. During hyperthermia treatment, the tumour is typically heated to a temperature of 40–43 °C for one hour. Clinical studies have demonstrated a clear benefit of thermoradiotherapy over radiotherapy alone in cohorts of head and neck [Citation1,Citation2], breast [Citation3,Citation4], cervix [Citation5,Citation6] and melanoma [Citation7] patients. However, an individualised approach could further improve clinical outcome through better patient selection and individualised optimisation of treatment plans. A thermoradiotherapy treatment plan consists of a radiotherapy treatment plan and a hyperthermia treatment plan. Both plans, as well as the schedule according to which both treatments are delivered, may affect treatment outcome. In order to provide an individualised treatment approach, biological modelling is needed to predict the biological effect of the thermoradiotherapy treatment plan for an individual patient.
A first challenge in biological modelling is to account for different factors that affect the biological effect of a thermoradiotherapy treatment. In addition to the biological effect of the physical radiation dose [Citation8], hyperthermia has both a radiosensitising and a direct cytotoxic effect [Citation9–11]. Exact contributions of different mechanisms for the direct cytotoxic and radiosensitising effects are not well known. Literature data suggest that direct cytotoxicity may be caused by acidosis in poorly perfused tumours [Citation10,Citation11] and conformational changes in proteins [Citation12,Citation13], while radiosensitisation may be caused by suppression of DNA repair [Citation9,Citation14] and increased oxygenation [Citation15–18]. The cytotoxic effect depends on the temperature and the heating time [Citation12], while the radiosensitising effect depends not only on temperature and heating time, but also on the time interval between radiation and hyperthermia [Citation19–21]. Moreover, the radiosensitising and cytotoxic effects are different for tumour tissue and normal tissue (e.g. the radiosensitising effect disappears slower in tumour tissue than in normal tissue [Citation19]). In addition, both effects depend on the type of tumour [Citation22]. Cell survival as a function of radiation dose can be described by the conventional linear-quadratic (LQ) model. This model can also be applied for cells that are radiosensitised by hyperthermia, by using altered model parameters (α and β) to account for the radiosensitisation [Citation22–25]. An extension of the LQ model was previously proposed for thermoradiotherapy, with radiosensitivity parameters that depend on the temperature achieved in the hyperthermia treatment and on the time interval between radiotherapy and hyperthermia [Citation26,Citation27].
A second challenge in biological modelling is quantification of the biological effect of a thermoradiotherapy treatment. While the extended LQ model allows for quantification in terms of cell survival, this is not a convenient measure to compare clinical treatment plans. For this purpose, the use of equivalent radiation dose, i.e. the radiation dose yielding the same effect as the thermoradiotherapy treatment, was proposed [Citation26,Citation27]. A major advantage of this concept is that it allows for easy comparison with radiation-only treatment plans. Moreover, it allows for evaluation of thermoradiotherapy plans according to conventional, well known (radiation) dose constraints.
Equivalent radiation dose can be calculated using the extended LQ model [Citation26,Citation27]. However, because clinical temperature and radiation dose distributions are heterogeneous, and because the model parameters may depend on the type of tissue, the biological effect and the corresponding equivalent radiation dose are also heterogeneous. Thus, estimation of the equivalent radiation dose has to be done at the voxel level and dedicated biological treatment plan evaluation software was previously developed for this purpose [Citation27]. Moreover, radiobiological parameters for the extended LQ model are required, which can only be obtained from biological experiments (e.g. cell survival assays) that cover a wide range of combinations of different radiation doses, temperatures and time intervals [Citation28]. Unfortunately, previous studies on the biological effect of thermoradiotherapy were typically limited to variation of only one or two parameters at a time, e.g. investigating changes in survival fraction as a function of radiation dose and time interval at a single temperature, or as a function of radiation dose and temperature for a single time interval [Citation19–21].
The aim of this study is to describe, in mathematical terms, the dependency of cell survival on radiation dose, temperature and time interval. In this study, we focus on cervical cancer, a tumour site for which thermoradiotherapy is successfully applied [Citation5,Citation6]. Additionally, using our previously introduced biological treatment plan evaluation software [Citation27], we show how the resulting model can be used to estimate the equivalent radiation dose and its confidence interval (CI) for clinical thermoradiotherapy in a realistic case of a patient with cervical cancer.
Materials and methods
In vitro experiments
Two cervical carcinoma cell lines, SiHa and HeLa, were obtained from the American Type Culture Collection (ATCC). SiHa and HeLa are HPV 16 and 18 positive, respectively. As such, these cell lines are representative for the majority of cervical cancer cases in the western world, where the prevalence of HPV 16 and 18 is 70–90% [Citation29]. The cell lines were grown in EMEM, containing 25 mM Hepes (Gibco-BRL Life Technologies, Breda, The Netherlands) supplemented with 10% heat-inactivated foetal bovine serum (FBS) and 2 mM glutamine. Cells were maintained in a 37 °C incubator with humidified air supplemented with 5% CO2. The cell division time was approximately 24 h. Cell survival assays were performed to determine the dependency of cell survival on radiation dose, temperature and time interval between treatments, as well as the order of treatment (radiotherapy before and after hyperthermia).
Cell survival was determined for all combinations of five radiation dose levels (0, 2, 4, 6 and 8 Gy), four temperatures (37, 39, 41 and 42 °C) and six time intervals (0, 2 and 4 h, in both treatment orders, i.e. hyperthermia before or after irradiation). Time intervals are defined from the end of radiotherapy to the start of hyperthermia and from the end of hyperthermia to the start of radiotherapy for radiotherapy before/after hyperthermia, respectively, and cover the range of intervals that typically occur in clinical thermoradiotherapy. Experiments at each treatment condition were performed at least in triplicate.
Cells were plated 4 h prior to the first treatment. Hyperthermia was performed by partially submerging the culture dishes in a thermostatically controlled water bath (Lauda aqualine AL12, Beun de Ronde, Abcoude, The Netherlands) at 39, 41 or 42 °C. Temperature was monitored using thermocouple probes, which were placed in parallel culture dishes. The desired temperature (±0.1 °C) was reached in approximately 5 min. After this warm-up period, a constant temperature was maintained for 1 h, similar to the duration of a clinical treatment. For both cell lines, hyperthermia experiments were performed using a 5% CO2/95% air atmosphere with an air inflow of 2 L/min. Radiation was delivered using a Cs-137 source at a dose rate of 0.5 Gy/min. Finally, surviving fractions from the survival assays were calculated as described by Franken et al. [Citation30], with the surviving fraction of the untreated cells (37 °C, 0 Gy) as plating efficiency.
Analysis
Since hyperthermia has both a direct cytotoxic and a radiosensitising effect, a model accounting for both effects was used to describe the data. The rate of cell killing due to direct hyperthermic cytotoxicity was described using the Arrhenius relationship [Citation12], assuming a first order reaction [Citation31]. This results in a term for hyperthermic cytotoxicity (SFHT) given by
(1) with t (s), the heating time and k the reaction rate as a function of the temperature T (°C), given by
(2) where ΔS (cal/°C/mol) is the entropy of inactivation and ΔH (cal/mol) is the inactivation energy of the critical rate-limiting molecules that cause cell lethality. Since a standard heating time of 1 h was used throughout all experiments, SFHT reduces to a function of temperature alone.
Cell killing due to radiotherapy, including the radiosensitising effect, was described by the LQ model with temperature dependent parameters as we proposed earlier [Citation27],
(3) with
(4)
(5) where α37=α(37,0), α41=α(41,0), β37=β(37,0), β41=β(41,0), μ (h−1) is the rate at which the radiosensitising effect of hyperthermia disappears, tint (h) is the time interval between radiotherapy and hyperthermia and D (Gy) is the total radiation dose.
The overall cell survival is then given by
(6)
For convenience in subsequent biological modelling, this function was parametrised as a function of α37, α37/β37, α41/α37, β41/β37, μ, ΔS and ΔH by replacing β37=α37/(α37/β37) in EquationEquation (5)(5) .
The model described in EquationEquations (1)–(6) was used to fit the cell survival data (of each cell line separately) using maximum likelihood estimation, with the assumption that residuals were normally distributed with a standard deviation σ. Additionally, a constraint of α37/β37>0 Gy was imposed. As ΔS and ΔH in EquationEquation (2)(2) are highly correlated when the temperature varies over a relatively small range (37–42 °C), a model including both parameters would be overparametrised. Initially, a maximum likelihood analysis was carried out with both ΔS and ΔH as free parameters. This demonstrates the high correlation between ΔS and ΔH and provides an estimate for the most likely value of each parameter. Subsequently, ΔH was fixed at the value found in the initial estimation and a second maximum likelihood estimation was performed. This procedure was performed separately for each cell line. Maximum likelihood estimation was performed in R (v 3.3.2), using the bbmle (v 1.0.18) package [Citation32,Citation33].
Application to biological modelling
To illustrate how the data from the in vitro experiments may be used for biological modelling, the potential effect of hyperthermia was quantified for a cervical cancer patient by comparing the equivalent radiation dose distribution of a thermoradiotherapy treatment with the dose of a radiation-only treatment. The radiotherapy-only plan consisted of 23 × 2 Gy external beam radiotherapy (EBRT); the thermoradiotherapy plan consisted of 23 × 2 Gy EBRT plus weekly hyperthermia (for 1 h), where hyperthermia was delivered after radiotherapy with 1 h time interval between treatments. Clinically, both treatments would be followed by a 24 Gy (EQD2) brachytherapy boost. However, since hyperthermia is only given during EBRT, and since there is a gap of one week between EBRT and brachytherapy, it is unlikely that hyperthermia affects the brachytherapy [Citation34]. Thus, in the comparison of both plans, only the effect of hyperthermia combined with EBRT is considered. To account for different patient postures, separate, dedicated CT scans were used to create the radiotherapy and hyperthermia treatment plans. A VMAT EBRT plan was made using a commercial treatment planning system (Oncentra External Beam, Elekta AB, Stockholm, Sweden). Hyperthermia treatment planning was performed using dedicated in-house developed hyperthermia treatment planning software [Citation35–37]. The hyperthermia treatment plan was optimised for heating with the AMC-8 locoregional heating device [Citation38]. This system consists of two rings of four 70 MHz waveguides and can be used either as a single-ring or as a double-ring device. A single-ring device was considered in this study.
The biological evaluation was performed using our in-house developed software X-Term [Citation27] and in this example we used the parameters values obtained in the analysis of the SiHa data. The biological evaluation was limited to calculation of equivalent radiation dose for the GTV only, since the analyses in this study focussed on tumour cell lines. To compare both treatment plans, the DVH, D95 and equivalent uniform dose (EUD, [Citation39]) are reported for the GTV. Finally, the difference in tumour control probability (TCP) was estimated, assuming an increase in TCP of 2% per Gy [Citation8].
Equivalent radiation dose calculations
Equivalent radiation dose distributions were calculated using the software package X-Term, which has been described previously in more detail [Citation27]. After planning on the respective radiotherapy and hyperthermia planning CTs, these CTs were matched using deformable image registration (Velocity, Varian Medical Systems, Palo Alto, CA). Then, the radiation dose was warped to the hyperthermia frame of reference, allowing for calculation of equivalent radiation dose at the voxel level of the hyperthermia planning CT scan.
In our previous study [Citation27], a term for direct hyperthermic cytotoxicity was not yet included in the equivalent radiation dose calculation. With direct hyperthermic cytotoxicity taken into account and assuming a heating time of 1 h, the expression for equivalent radiation dose becomes
(7) where dref is the fraction dose of the reference (radiation-only) schedule and G is the protraction factor, which is calculated in X-Term using EquationEquations (3)–(5) from van Leeuwen et al. [Citation27]. All equivalent radiation doses reported in this study were calculated with dref=2 Gy (commonly denoted as EQD2).
Confidence intervals
The uncertainty in each of the parameters contributes to an uncertainty in the calculated EQDRT and one would like to estimate the resulting 95% CI for EQDRT. A straightforward method would be to combine the extreme values of the univariate 95% CIs to generate parameter sets to calculate EQDRT [Citation27]. The highest/lowest values of EQDRT predicted using these parameter sets would then provide a “first order” approximation of the 95% CI. However, this method will likely overestimate CIs in case of strong correlations between parameters; e.g. if α41/α37 and β41/β37 show a strong negative correlation, it is unlikely that these parameters are either both on the low or both on the high end of their CI, resulting in CIs for EQDRT that are unrealistically large (see Appendix A, supplemental material). Therefore, we used a method that also takes the correlation between parameters into account and provides a more accurate, “second order” approximation (see Appendix A, supplemental material). This method involves generation of a total of 14 parameter sets based on the principle components of the covariance matrix. These parameter sets are (approximately) on the boundary of the 95% confidence region produced by the maximum likelihood estimation. The calculation of EQDRT was performed for each of these parameter sets, and the 95% CI was estimated using the extreme values of EQDRT.
Results
Analysis of in vitro data
To estimate the parameters of the radiobiological model (EquationEquation (6)(6) ), we performed maximum likelihood estimation. Initially, both ΔS and ΔH were free parameters in the maximum likelihood estimation, and a very strong correlation between these parameters (larger than 0.9999) was observed for both cell lines. Thus, a subsequent maximum likelihood estimation was performed, with ΔH fixed at the most likely value found for each cell line. This provided the final estimates for the radiobiological parameters () and covariance matrices (supplementary Tables B1 and C1) for the SiHa and HeLa cells. From the covariance matrices, the parameter sets were calculated that can be used to propagate the uncertainty in these radiobiological parameters into a 95% CI on equivalent radiation dose (supplementary Tables B2 and C2).
Table 1. Maximum likelihood estimates for the parameters of the model in EquationEquation (6)(6) , for the SiHa and HeLa cell lines.
Comparison of the model with the measured survival fractions ( and supplementary Figure C1) shows that the model describes the dependency of survival fraction on radiation dose (left column), temperature (middle column) and time interval (right column) well for both the SiHa and HeLa cell lines (R2=0.90 and R2=0.91, respectively). The cell survival as a function of radiation dose straightens at higher temperatures (left column of and supplemental Figure C1), which is reflected by the fact that α increases (α41/α37>1) and β decreases (β41/β37<1) with increasing temperature.
Figure 1. Three different views on the SiHa survival data: survival fraction as a function of radiation dose (left column), temperature (middle column) and time interval (right column). Shown are the mean measured survival (data points) with 95% CI of the mean (error bars) and the model from Equation (7) (lines). Data for the HeLa cell line can be found in the supplementary Figure C1. RT: radiotherapy; HT: hyperthermia.
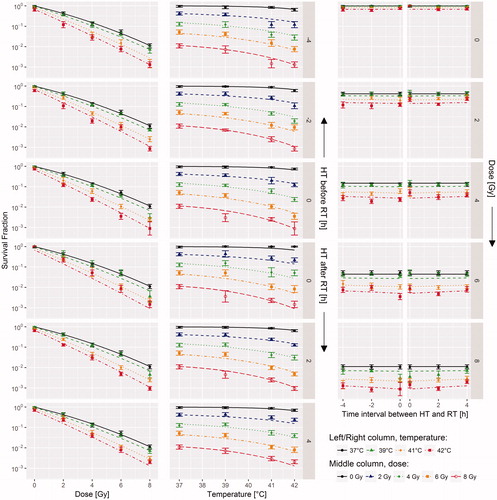
There are substantial differences in the maximum likelihood estimates for the model parameters between the two cell lines (). Compared with its value at 37 °C, the α-parameter was higher at 41 °C (α41/α37 was 1.73 and 2.55 for SiHa and HeLa, respectively), while the β-parameter at 41 °C was lower (β41/β37 was 0.41 and 0.57 for SiHa and HeLa, respectively). The decay rate (μ) for hyperthermic radiosensitisation appears to be low, corresponding to decay time constants τ (=1/μ) of 37 h and 18.9 h for the SiHa and HeLa cells, respectively. While the HeLa cells are less radiosensitive (i.e. lower α37) than the SiHa cells, they were more sensitive to hyperthermic radiosensitisation (i.e. higher α41/α37 and β41/β37) and slightly more sensitive to hyperthermic cytotoxicity. For example, given the model parameters from that describe direct cytotoxicity (ΔS and ΔH) and using EquationEquation (1)(1) , SFHT for 1 h heating at 42 °C would be 0.68 and 0.42 for the SiHa and HeLa cell lines, respectively.
Application to biological modelling
To illustrate the application of these radiobiological parameters in calculation of the equivalent radiation dose distribution, we used the data from the SiHa cell line to compare a thermoradiotherapy plan with a radiotherapy-only plan for a cervical cancer patient (). The radiotherapy plan showed sufficient coverage of the GTV (D95%=45.1 Gy, EUD =45.7 Gy). The hyperthermia treatment plan optimised tumour heating, without overheating normal tissue (, left panel). In this plan, T10%, T50% and T90% were 41.3 °C, 40.4 °C and 39.6 °C, respectively. The effect of hyperthermia is clearly visible in the equivalent radiation dose distribution: the increase in dose compared with the radiotherapy-only plan is most pronounced at the anterior side of the tumour, where the temperature in the hyperthermia plan is highest.
Figure 2. Radiation dose distribution and hyperthermia temperature distribution (left) and resulting equivalent radiation dose (right). Equivalent radiation dose calculation was limited to the GTV only. Temperatures below 37 °C are caused by bolus cooling. For a colour version of this figure, see the online version of this paper.
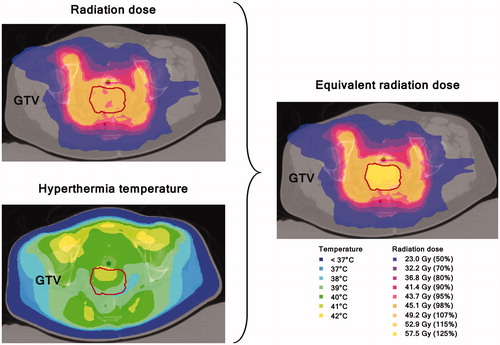
Figure 3. Temperature–volume histogram (left) and dose–volume histogram (right) showing the planned temperature in the GTV during hyperthermia (HT), the planned radiation dose (RT) and the estimated equivalent radiation dose for the combined thermoradiotherapy treatment plan (RT + HT). The equivalent radiation dose is calculated in 2 Gy/fraction using the maximum likelihood estimated parameters for the SiHa cell line (). The shaded region is the 95% CI based on the most extreme EQDRT values produced by the 14 parameter sets that represent the uncertainty in the radiobiological parameters (supplementary Table B2).
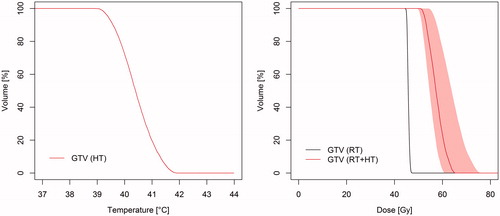
The thermoradiotherapy plan resulted in a substantially higher equivalent radiation dose to the GTV than the radiotherapy-only plan ( and ). D95% and EUD were increased by 7.5 Gy (95% CI: 5.8–11.5 Gy) and 9.8 Gy (95% CI: 7.7–14.3 Gy), respectively. Using the approximate increase in TCP of 2%/Gy (EUD), this would correspond to an increase in TCP of about 20% (95% CI: 15–29%). The uncertainty in estimation of the biological parameters translates to substantial CIs in terms of EQDRT, but even the lower limit of 7.5 Gy (EUD) and increase in TCP (15%) are clinically relevant improvements.
Discussion
This study is the first to present a mathematical model and accompanying biological experiments that describe the full dependency of cell survival on the radiation dose, temperature and time between radiotherapy and hyperthermia. These data are essential for biological modelling of thermoradiotherapy treatments [Citation28], which enables evaluation of thermoradiotherapy plans and may allow for further optimisation of clinical thermoradiotherapy.
The radiosensitisation parameters for simultaneous heating and irradiation (α41/α37 and β41/β37) are in line with previous measurements in other cell lines [Citation22,Citation23,Citation40] and with estimations from clinical data [Citation25]. However, the radiosensitising effect in the current cell lines seems to remain for a long time, with time constants for the decay of hyperthermic radiosensitization τ (=1/μ) of 37 h and 18.9 h for the SiHa and HeLa cells, respectively. This is much longer than what has been observed in other cell lines [Citation41] and in in vivo models [Citation19], where decay time constants were around 2 h. In addition, a retrospective clinical study of cervical cancer patients treated with thermoradiotherapy showed a significantly higher number of in-field recurrences for longer time intervals, with time intervals for the included patients varying from 0.5 to 2 h [Citation42], also suggesting a faster decay of hyperthermic radiosensitisation. The cause for the substantial difference in dynamic behaviour of the radiosensitisation remains unclear. A notable difference between the SiHa and HeLa cell lines and the HA-1 (Chinese hamster ovary) and EMT-6 (mouse mammary sarcoma) cell lines studied in the aforementioned literature [Citation41] is that SiHa and HeLa are HPV-positive cell lines. Since HPV has been shown to be one of the targets for hyperthermia [Citation43], this difference in HPV status could be related to the difference in dynamics and this should be investigated further. Additionally, the in vivo [Citation19] and clinical data [Citation42] may show different behaviour because of the presence of blood flow supplying oxygen and various nutrients, which may change the dynamics through which cells return to their normal state after hyperthermia. For radiobiological modelling of clinical thermoradiotherapy plans for cervical cancer patients, it is recommended to adapt the value of τ to a value that matches the behaviour in in vivo models and the clinical data (i.e. τ≈2 h) [Citation19,Citation42].
Visual inspection of the quality of fit of the model to the data ( and supplementary Figure C1) shows that, apart from random statistical variation, the proposed model fits the SiHa and HeLa data well. Thus, the model provides a reliable interpolation of the survival fractions over the range of temperatures, radiation doses and time intervals explored in this study. In general, this enables equivalent radiation dose calculation for the wide range of radiation doses and temperatures present in the radiation and temperature distributions simulated in radiotherapy and hyperthermia treatment planning. However, caution is warranted if the planned temperature/radiation dose distributions contain temperatures/radiation doses that are outside the range that was explored here (i.e. >42 °C or fraction doses >8 Gy), or if long time intervals between treatments (>4 h) are explored, as the predicted equivalent radiation doses are then based on extrapolations.
Clinical application of biological modelling requires robustness for uncertainty in biological parameters to be confident that the final plan results in a good clinical outcome. The presented example shows robustness: uncertainty in estimation of the biological parameters did translate to substantial CIs in terms of EQDRT, but even the lower limit yields a clinically relevant improvement for the thermoradiotherapy plan and thus the conclusion is robust. In practical situations, the clinician has to decide which limits are acceptable.
The analysis of the SiHa and HeLa data convincingly shows an increase in α and a decrease in β with temperature, the combination of which results in an increasing α/β value (i.e. a decreasing fractionation sensitivity) with temperature. It may be possible to exploit this effect through (hyper)fractionation, which specifically spares tissue with a low α/β value (as normal tissues generally have). However, three complicating factors are present in case of thermoradiotherapy that should be taken into account. First, hyperthermia is usually given only once or twice a week to prevent thermotolerance [Citation10,Citation44–46]. While hyperthermia may increase the α/β for the irradiation on the same day, it is unlikely that any effect would be present for the remainder of the week. Second, the therapeutic gain that could be obtained depends not only on the increase of α/β in tumour tissue, but also on the change in α/β in normal tissue. However, very little is known about the change in α/β for normal tissue. Finally, thermal enhancement appears to be cell-line dependent: a similar increase in α/β with temperature was observed by Xu et al. in NSY cells (colon) [Citation23], but Franken et al. have observed decreases in α/β in RKO (colon) and SW1573 (lung) [Citation22].
Considering the differences in radiobiological parameters between tumour types [Citation22,Citation23,Citation41], it would be valuable to repeat the measurements and analysis performed in this study on different tumour cell lines. In particular, since thermoradiotherapy is also commonly used in for example (recurrent) breast cancer and head and neck cancer, cell lines derived from these cancer types should be explored in order to also allow for radiobiological modelling of thermoradiotherapy treatments for these tumour sites. Furthermore, the present results are largely based on in vitro cell survival data. These cover an important part of the mechanisms responsible for direct cytotoxicity and radiosensitisation: conformational changes in proteins [Citation12,Citation13] and suppression of DNA repair [Citation9,Citation14], respectively. Further in vivo data will be needed to assess the contribution of for instance direct cytotoxicity by acidosis in poorly perfused tumours [Citation10,Citation11] and radiosensitisation associated with increased oxygenation [Citation15–18]. In vivo data are also valuable for modelling the response of normal tissues to thermoradiotherapy, since it is likely that radiobiological behaviour differs between normal tissue and tumours; e.g. the radiosensitising effect of hyperthermia has been suggested to disappear more rapidly in normal tissue [Citation19,Citation20,Citation47–49]. Having such radiobiological parameters available for a wide range of tumours and normal tissues enables a wide range of planning studies to be performed to further improve clinical thermoradiotherapy, e.g. to investigate the effect of the time interval between radiotherapy and hyperthermia on expected clinical outcome.
Modelling of in vitro data is logical first step, because it allows for complete control over the experimental conditions: temperature and dose distributions are homogeneous, and may be varied at will. Moreover, the dependent variable of the model (the fraction of surviving clonogenic cells, in case of the LQ model) can be measured directly. However, such in vitro experiments are clearly simplifications of the clinical reality, since factors like pH, oxygenation and clonogen distribution are not well represented. These factors are relevant and may change under hyperthermic conditions. To make certain that the model is representative for a clinical situation, future in vivo experiments and a comparison of model predictions with clinical data are essential. While an extensive comparison of predicted vs. measured differences in local control is beyond the scope of this paper, the estimated TCP increase of 15% in the biological modelling example does correspond well with the results of the Dutch Deep Hyperthermia Trial [Citation50], where a 19% increase in local control was observed for thermoradiotherapy compared with radiotherapy alone. A complete validation would require the prediction of differences in tumour control for a larger set of patients, since the increase in TCP will depend on the dose and temperature distribution achieved in each individual patient. This will be subject of further research.
Conclusions
This study presents a model to describe cell survival as a function of radiation dose, temperature and time interval, which is essential for biological modelling of thermoradiotherapy treatments. The model was applied to derive radiobiological parameters from cell survival data of cervical tumours. Additionally, we have demonstrated how these parameters can be used in biological modelling to calculate equivalent radiation dose distributions for thermoradiotherapy plans. This included estimation of an appropriate CI, a necessary step in determining whether conclusions from biological modelling are robust against the uncertainty in the radiobiological parameters.
Supplemental_Files.zip
Download Zip (3 MB)Disclosure statement
The authors report no conflicts of interest.
Additional information
Funding
Related Research Data
References
- Valdagni R, Amichetti M, Pani G. (1988). Radical radiation alone versus radical radiation plus microwave hyperthermia for N3 (TNM-UICC) neck nodes: a prospective randomized clinical trial. Int J Radiat Oncol Biol Phys 15:13–24.
- Huilgol NG, Gupta S, Sridhar CR. (2010). Hyperthermia with radiation in the treatment of locally advanced head and neck cancer: a report of randomized trial. J Cancer Res Ther 6:492–6.
- Vernon CC, Hand JW, Field SB, et al. (1996). Radiotherapy with or without hyperthermia in the treatment of superficial localized breast cancer: results from five randomized controlled trials. International Collaborative Hyperthermia Group. Int J Radiat Oncol Biol Phys 35:731–44.
- Zagar TM, Oleson JR, Vujaskovic Z, et al. (2010). Hyperthermia combined with radiation therapy for superficial breast cancer and chest wall recurrence: a review of the randomised data. Int J Hypertherm 26:612–17.
- van der Zee J, González D, van Rhoon GC, et al. (2000). Comparison of radiotherapy alone with radiotherapy plus hyperthermia in locally advanced pelvic tumours: a prospective, randomised, multicentre trial. Lancet 355:1119–25.
- Datta NR, Rogers S, Klingbiel D, et al. (2016). Hyperthermia and radiotherapy with or without chemotherapy in locally advanced cervical cancer: a systematic review with conventional and network meta-analyses. Int J Hypertherm 32:809–21.
- Overgaard J, Bentzen SM, Overgaard J, et al. (1995). Randomised trial of hyperthermia as adjuvant to radiotherapy for recurrent or metastatic malignant melanoma. European Society for Hyperthermic Oncology. Lancet 345:540–3.
- Okunieff P, Morgan D, Niemierko A, Suit HD. (1995). Radiation dose-response of human tumors. Int J Radiat Oncol Biol Phys 32:1227–37.
- Kampinga HH, Dynlacht JR, Dikomey E. (2004). Mechanism of radiosensitization by hyperthermia (> or =43 degrees C) as derived from studies with DNA repair defective mutant cell lines. Int J Hypertherm 20:131–9.
- Horsman MR, Overgaard J. (2007). Hyperthermia: a potent enhancer of radiotherapy. Clin Oncol (R Coll Radiol) 19:418–26.
- Overgaard J. (2013). The heat is (still) on-the past and future of hyperthermic radiation oncology. Radiother Oncol 109:185–7.
- Dewey WC, Hopwood LE, Sapareto SA, Gerweck LE. (1977). Cellular responses to combinations of hyperthermia and radiation. Radiology 123:463–74.
- Streffer C. (1995). Molecular and cellular mechanisms of hyperthermia. In: Seegenschmiedt MH, Fessenden P, Vernon CC, eds. Thermoradiotherapy and thermochemotherapy. Berlin: Springer-Verlag, 47–74.
- Oei AL, Vriend LEM, Crezee J, et al. (2015). Effects of hyperthermia on DNA repair pathways: one treatment to inhibit them all. Radiat Oncol 10:165.
- Winslow TB, Eranki A, Ullas S, et al. (2015). A pilot study of the effects of mild systemic heating on human head and neck tumour xenografts: analysis of tumour perfusion, interstitial fluid pressure, hypoxia and efficacy of radiation therapy. Int J Hypertherm 31:693–701.
- Vujaskovic Z, Song CW. (2004). Physiological mechanisms underlying heat-induced radiosensitization. Int J Hypertherm 20:163–74.
- Sun X, Xing L, Ling CC, Li GC. (2010). The effect of mild temperature hyperthermia on tumour hypoxia and blood perfusion: relevance for radiotherapy, vascular targeting and imaging. Int J Hypertherm 26:224–31.
- Brizel DM, Scully SP, Harrelson JM, et al. (1996). Radiation therapy and hyperthermia improve the oxygenation of human soft tissue sarcomas. Cancer Res 56:5347–50.
- Overgaard J. (1980). Simultaneous and sequential hyperthermia and radiation treatment of an experimental tumor and its surrounding normal tissue in vivo. Int J Radiat Oncol Biol Phys 6:1507–17.
- Stewart FA, Denekamp J. (1978). The therapeutic advantage of combined heat and X rays on a mouse fibrosarcoma. Br J Radiol 51:307–16.
- Sapareto SA, Hopwood LE, Dewey WC. (1978). Combined effects of X irradiation and hyperthermia on CHO cells for various temperatures and orders of application. Radiat Res 73:221.
- Franken NAP, Oei AL, Kok HP, et al. (2013). Cell survival and radiosensitisation: modulation of the linear and quadratic parameters of the LQ model (Review). Int J Oncol 42:1501–15.
- Xu M, Myerson RJ, Straube WL, et al. (2002). Radiosensitization of heat resistant human tumour cells by 1 hour at 41.1 degrees C and its effect on DNA repair. Int J Hypertherm 18:385–403.
- Mackey MA, Anolik SL, Roti Roti JL. (1992). Changes in heat and radiation sensitivity during long duration, moderate hyperthermia in HeLa S3 cells. Int J Radiat Oncol Biol Phys 24:543–50.
- Myerson RJ, Roti JLR, Moros EG, et al. (2004). Modelling heat-induced radiosensitization: clinical implications. Int J Hypertherm 20:201–12.
- Kok HP, Crezee J, Franken NAP, et al. (2014). Quantifying the combined effect of radiation therapy and hyperthermia in terms of equivalent dose distributions. Int J Radiat Oncol Biol Phys 88:739–45.
- van Leeuwen CM, Crezee J, Oei AL, et al. (2017). 3D radiobiological evaluation of combined radiotherapy and hyperthermia treatments. Int J Hypertherm 33:160–9.
- Myerson RJ. (2017). Incorporating detailed biology in hyperthermia treatment planning: a necessary condition for progress. Int J Hypertherm 33:364–5.
- Vesco K, Whitlock E, Eder M, et al. (2011). Screening for cervical cancer: a systematic evidence review for the U.S. Preventive Services Task Force. Rockville (MD): Agency for Healthcare Research and Quality.
- Franken NAP, Rodermond HM, Stap J, et al. (2006). Clonogenic assay of cells in vitro. Nat Protoc 1:2315–19.
- Landry J, Marceau N. (1978). Rate-limiting events in hyperthermic cell killing. Radiat Res 75:573–85.
- R Core Team. (2016). R: a language and environment for statistical computing. R Foundation for Statistical Computing, Vienna, Austria. https://www.R-project.org/
- Bolker B, R Development Core Team. (2016). bbmle: tools for general maximum likelihood estimation. https://CRAN.R-project.org/package=bbmle
- Crezee J, van Leeuwen CM, Oei AL, et al. (2016). Biological modelling of the radiation dose escalation effect of regional hyperthermia in cervical cancer. Radiat Oncol 11:14.
- Kok HP, Van Haaren PMA, Van de Kamer JB, et al. (2005). High-resolution temperature-based optimization for hyperthermia treatment planning. Phys Med Biol 50:3127–41.
- van Haaren PMA, Kok HP, van den Berg CAT, et al. (2007). On verification of hyperthermia treatment planning for cervical carcinoma patients. Int J Hypertherm 23:303–14.
- Kok HP, Kotte ANTJ, Crezee J. (2017). Planning, optimisation and evaluation of hyperthermia treatments. Int J Hypertherm. [Epub ahead of print]. doi: 10.1080/02656736.2017.1295323
- Crezee J, Van Haaren PMA, Westendorp H, et al. (2009). Improving locoregional hyperthermia delivery using the 3-D controlled AMC-8 phased array hyperthermia system: a preclinical study. Int J Hypertherm 25:581–92.
- Niemierko A. (1997). Reporting and analyzing dose distributions: a concept of equivalent uniform dose. Med Phys 24:103–10.
- Pajonk F, van Ophoven A, McBride WH. (2005). Hyperthermia-induced proteasome inhibition and loss of androgen receptor expression in human prostate cancer cells. Cancer Res 65:4836–43.
- Li GC, Kal HB. (1977). Effect of hyperthermia on the radiation response of two mammalian cell lines. Eur J Cancer 13:65–9.
- van Leeuwen CM, Oei AL, Chin KWTK, et al. (2017). A short time interval between radiotherapy and hyperthermia reduces in-field recurrence and mortality in women with advanced cervical cancer. Radiat Oncol. [Epub ahead of print]. doi: 10.1186/s13014-017-0813-0
- Oei AL, van Leeuwen CM, ten Cate R, et al. (2015). Hyperthermia selectively targets human papillomavirus in cervical tumors via p53-dependent apoptosis. Cancer Res 75:5120–9.
- Yarmolenko PS, Moon EJ, Landon C, et al. (2011). Thresholds for thermal damage to normal tissues: an update. Int J Hypertherm 27:320–43.
- Dewhirst MW, Viglianti BL, Lora-Michiels M, et al. (2003). Basic principles of thermal dosimetry and thermal thresholds for tissue damage from hyperthermia. Int J Hypertherm 19:267–94.
- Overgaard J, Nielsen OS. (1983). The importance of thermotolerance for the clinical treatment with hyperthermia. Radiother Oncol 1:167–78.
- Gillette EL, Ensley BA. (1979). Effect of heating order on radiation response of mouse tumor and skin. Int J Radiat Oncol Biol Phys 5:209–13.
- Hill SA, Denekamp J. (1979). The response of six mouse tumours to combined heat and X rays: implications for therapy. Br J Radiol 52:209–18.
- Hetzel FW, Dunn JA. (1984). Hyperthermia and radiation in cancer therapy: a review. Radiat Phys Chem 24:337–45.
- Franckena M, Stalpers LJA, Koper PCM, et al. (2008). Long-term improvement in treatment outcome after radiotherapy and hyperthermia in locoregionally advanced cervix cancer: an update of the Dutch Deep Hyperthermia Trial. Int J Radiat Oncol Biol Phys 70:1176–82.