
Abstract
Purpose: To establish a scoring system that predicts the difficulty level of high-intensity focussed ultrasound (HIFU) ablation of uterine fibroids.
Materials and methods: Four hundred and twenty-two patients with fibroids were enrolled. The energy efficiency factor (EEF) and sonication time were set as dependent variables, with factors possibly affecting EEF and sonication time including age, body mass index (BMI), the volume of fibroids, the location of the uterus, the type of fibroids, the signal intensity on the T2-weighted imaging (T2WI), the enhancement type, the thickness of the rectus abdominis and the subcutaneous fat layer, the distance from the anterior/posterior surface of the fibroid to the skin, and the abdominal wall scars were set as predictors for building optimal scaling regression models.
Results: The volume of the fibroids, the location of the uterus, the signal intensity on T2WI, enhancement type, rectus abdominis thickness, subcutaneous fat thickness, and distance from the anterior surface of fibroid to the skin were related to EEF. Signal intensity on T2WI, the volume of fibroids, distance from the posterior surface of fibroid to the skin, and enhancement type were related to sonication time. Models that can predict the difficulty level of HIFU for fibroids have been established: for EEF, y ′ = 0.338X ′1 − 0.231X ′2+0.156X ′3+0.167X ′4 ; for sonication time, y = 0.227X1+0.321X2+0.157X3+0.194X4.
Conclusions: A scoring system for predicting the difficulty level of HIFU treatment for uterine fibroids has been established and it can be used to help select patients and to predict the sonication time for a given fibroid.
Introduction
Uterine fibroids, occurring in 20–40% of women during reproductive age, are the most common benign tumours of female reproductive system [Citation1]. Although hysterectomy and myomectomy have been the standard treatments, technological revolutions have catalysed a shift from open surgery to minimally invasive or non-invasive treatment [Citation2]. Over the last decade, high intensity focussed ultrasound (HIFU) has succeeded in delivering the ultimate objective: truly non-invasive ablation. This non-invasive technique is becoming more widely applied in clinical practice due to its advantages of low risk for complications, short recovery time, no radiation exposure, no surgical incision, and no damage to ovarian function. HIFU has the ability to yield coagulative necrosis at a precise focal point within target lesions while not affecting any surrounding structures [Citation3–8].
Previous studies have shown that uterine fibroids displaying hyperintensity on T2-weighted imaging (T2WI) or on T1 weighted images (T1WI) with significant enhancement are difficult to treat using HIFU [Citation9–11]. Several studies have also demonstrated that besides the blood supply of uterine fibroids and tissue structure of fibroids, different tissue thicknesses in the acoustic pathway and the size of fibroids are also important factors influencing the energy efficiency factor (EEF), which is considered as the quantitative index of energy delivery [Citation11,Citation12]. To the best of our knowledge, no study has established a scoring system for predicting the difficulty level of HIFU ablation of uterine fibroids. Therefore, this retrospective study with a large number of subjects will first evaluate the relationship between ablation effects and predictive factors, then quantify the predictors to establish a scoring system for predicting the difficulty level of HIFU ablation of uterine fibroids.
Materials and methods
This retrospective study was approved by the ethics committee at our institute. Before HIFU treatment, the details of the treatment were discussed with all patients, who then signed a consent form.
Subjects
From February 2011 to June 2016, 422 patients with symptomatic uterine fibroids were treated with ultrasound-guided HIFU (USgHIFU) in the Chongqing Haifu Hospital. Patients were first evaluated by both gynaecologists and HIFU physicians with the following inclusion criteria and exclusion criteria.
Inclusion criteria for HIFU treatment were as follows: (1) all patients were 18 years or older; (2) all patients had clinical symptoms; (3) patients could communicate with the nurse or physician during HIFU procedure; (4) patients agreed to take pre- and post-HIFU MRI examinations.
Exclusion criteria included: (1) pregnancy; (2) patients were contraindicated for MR imaging or gadolinium-injection solution; (3) patients had a suspected or confirmed malignant uterine tumour; (4) patients had acute pelvic inflammatory disease or uncontrolled systemic disease; (5) patients could not lie in a prone position for 2 h; (6) patients with a history of a high dose of radiotherapy for malignant tumours located in the lower abdomen; (7) patients with scar tissue in the acoustic pathway, causing obvious attenuation of the B-model ultrasound in detecting tissues behind the scar.
Magnetic resonance imaging evaluation
A series of standard T1WI, T2WI and contrast-enhanced T1WI sequences were performed on all patients with a 1.5 T MR unit (uMR570, United Imaging Company, Beijing, China) one day before and one day after the treatment. Non-perfused volume (NPV), usually considered as fibroid necrosis volume, was measured on enhanced images. The targeted fibroids and NPV were measured in three dimensions: longitudinal (d1), antero-posterior (d2) and transverse (d3). Fibroid volume and NPV were calculated according to the following equation: V = 0.5233 × d1 × d2 × d3 [13]. EEF was defined as the ultrasound energy delivered for ablating 1 mm3 of the uterine fibroid tissue (EEF = η × P × t/V (J/mm3), where η indicates a focussing factor (= 0.7), P indicates sonication power (W), t indicates sonication time, and V indicates NPV (mm3) [Citation14]. Fractional ablation was defined as (NPV)/(fibroid volume) × 100%.
The following data from MR images were recorded: the location and volume of uterine fibroids; uterus location; distance from the anterior surface of the fibroid to the skin of abdominal wall (measurement as shown in ); the distance from the posterior surface of the fibroid to the skin of abdominal wall (); the thickness of the rectus abdominis and the subcutaneous fat layer on the inferior border of the second sacral vertebrae according to the T2WI sagittal image (); the type of uterine fibroid (either submucosal fibroids, subserousal fibroids, or intramural fibroids) (); signal intensity on T2WI (hypointense, isointense, heterogeneous-type hyperintense and homogeneous-type hyperintense) (. According to the degree of enhancement of uterine fibroids compared to the myometrium within 60 s after the gadolinium injection, the degree of lesion enhancement was classified as slight when less than that of the myometrium, moderate when similar to that of the myometrium, and significant when greater than that of the myometrium (.
Figure 1. Sagittal view of MRI from a patient with uterine fibroid. (a) Thickness of the subcutaneous fat layer. (b) Thickness of the rectus abdominis. (c) Distance from the anterior surface of the fibroid to the skin. (d) Distance from the posterior surface of the fibroid to the skin.
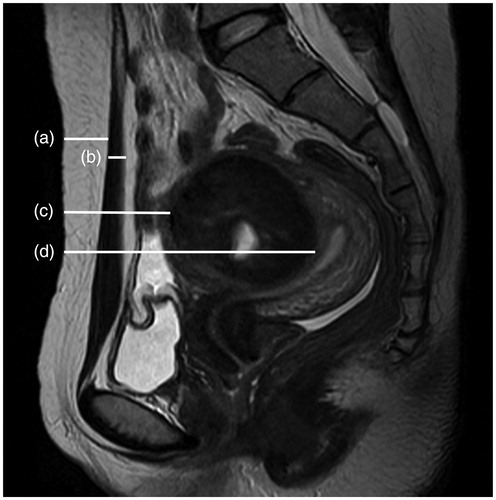
Figure 2. Types of uterine fibroids: (a) submucosal fibroids; (b) subserousal fibroids; (c) intramural fibroids.
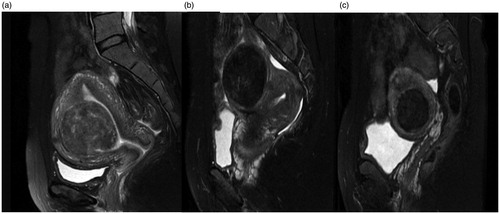
Figure 3. Signal intensity on T2WI. (a) Hypointense fibroid; (b) isointense fibroid; (c) homogeneous-type hyperintense fibroid; (d) heterogeneous-type hyperintense fibroid.
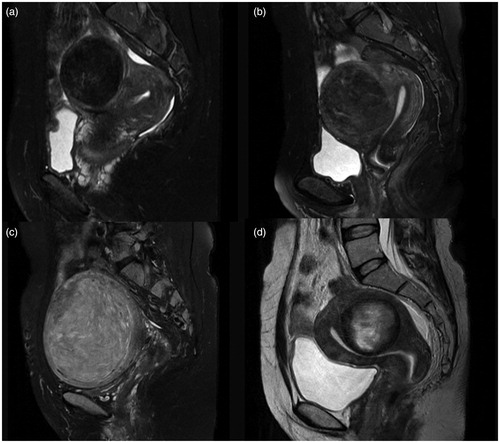
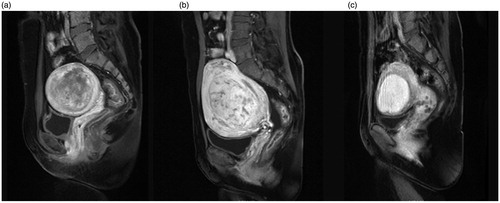
Figure 4. Contrast enhanced MRI from the patients with uterine fibroids. (a) Slight enhancement: the enhancement of the fibroid is less than that of the myometrium; (b) moderate enhancement: the enhancement of the fibroid is similar to the myometrium; (c) significant enhancement: the enhancement of the fibroid is greater than the myometrium.
Pretreatment preparation
All patients were required to undergo specific bowel and skin preparation before HIFU treatment. Bowel preparation included ingestion of half liquid food or liquid food for 2–3 days, a 12-h fast before HIFU and a mandatory enema in the morning of treatment day. In skin preparation, any scar in acoustic pathway was recorded and the hair of the anterior abdomen between the umbilicus and the superior border of the symphysis pubis was shaved, then the skin was degreased and degassed. Before HIFU treatment, a urinary catheter was inserted into the bladder and normal saline was used to regulate the bladder volume to get a safe acoustic pathway.
HIFU ablation
HIFU ablation was performed using an USgHIFU tumour therapeutic system (JC200, Chongqing Haifu Medical Technology Co., Ltd., Chongqing, China). This system is equipped with a therapeutic focussed ultrasound transducer 20 cm in diameter and a B mode ultrasound diagnostic probe sits at the centre of the therapeutic transducer to monitor the ablation process. The patients were positioned prone on the HIFU table, with the anterior abdominal wall placed in contact with the degassed water. The HIFU ablation procedure was performed under intravenous conscious sedation. The aim of conscious sedation was to relieve pain or discomfort during treatment. All patients remained conscious, and vital signs included respiration, oxygen saturation, heart rate and blood pressure were monitored during the procedure.
The procedure was performed by doctors licenced in HIFU. Real-time ultrasonographic imaging was used to monitor the target area and the adjacent tissue. Treatment began from the deeper part of the fibroid to shallower part and the focus was at least 1 cm away from the boundary of the fibroid. During the procedure, sonication power was adjusted based on feedback from the patient and changed greyscale on the ultrasonographic image. This process was repeated on a section-by-section basis to achieve complete ablation of the planned treatment volume; once the increased grey scale covered the treated lesion, the treatment was terminated. Treatment time (defined as the time from the first sonication to the last sonication), sonication power, sonication time, treatment intensity (seconds/hour, the sonication time per hour in treatment) and treatment efficiency (mm3/s, ablated fibroid volume per second) were recorded.
Statistical analysis
The data were analysed using SPSS software (SPSS19.0, IBM Company, Chicago, IL). The normally distributed data are reported using mean ± standard deviation; the skewed data distribution was reported using the median and the interquartile range. Optimal scaling regression analysis models were created by analysing the characteristics of the data. A p value less than 0.05 was defined as statistically significant.
Results
Patients and lesions
The median age of the patients was 38.0 years (with an interquartile range of 32.0–42.0 years); the average body mass index (BMI) was 21.6 ± 2.8 (kg/m2); the median largest diameter was 5.8 cm (interquartile range: 4.8–7.3 cm). The median volume of uterine fibroids was 79.1 cm3 (with an interquartile range of 41.6–160.0 cm3); the median thickness of the rectus abdominis was 10.0 mm (interquartile range: 8.0–11.5 mm); the median thickness of the subcutaneous fat layer was 15.0 mm (interquartile range: 11.0–20.0 mm); the median distance from the anterior surface of the fibroid to the skin and the average distance from the posterior surface of the fibroid to the skin were 42.0 mm (interquartile range: 28.5–61.0 mm) and 103.3 ± 21.5 mm, respectively ().
Table 1. Baseline characteristics of patients with uterine fibroids.
Peri-procedural evaluation
The mean sonication power was 400 ± 20 W; the median treatment time was 80.0 min (interquartile range: 50.0–124.5 min); the median sonication time was 800 s (interquartile range: 450–1400 s); the mean fractional ablation was 83.1% (interquartile range: 70.1–92.3%); and the median EEF was 3.7 J/mm3 (interquartile range: 1.6–7.0 J/mm3) ().
Table 2. Treatment results of uterine fibroids treated by USgHIFU.
Establishment of dosimetric model
In this dosimetric model, EEF was used as a dependent variable, and the factors including age, BMI, volume of the uterine fibroid, location of the uterus, type of uterine fibroid, signal intensity on T2WI, enhancement type on T1WI, thickness of the rectus abdominis, thickness of the subcutaneous fat layer, distance from the anterior surface of the fibroid to the skin, distance from the posterior surface of the fibroid to the skin, and abdominal surgical scars were used as independent variables. The statistical analysis results showed that the volume of the uterine fibroid, distance from the anterior surface of the fibroid to the skin, location of uterus, signal intensity on T2WI, enhancement type on T1WI, thickness of the rectus abdominis, and thickness of the subcutaneous fat layer all had significant relationship with EEF (). Then we included these seven independent variables in a regression analysis to get the predicted EEF value. In this regression analysis, “Nominal” was selected as the optimal scaling level for the independent variables location of uterus, signal intensity on T2WI, and enhancement type on T1WI, and “Numeric” was selected as the optimal scaling level for EEF, volume of the uterine fibroid, distance from the anterior surface of the fibroid to the skin, thickness of the rectus abdominis and thickness of the subcutaneous fat layer. “Random” was selected as the initial configuration. The results of the regression analysis showed that the volume of the uterine fibroid, the signal intensity on T2WI, the enhancement type on T1WI, and the distance from the anterior surface of the fibroid to the skin were included into the optimal scaling regression mode and they were all statistically significant related to EEF (p < 0.05), whereas the other categorical predictors had no correlation with EEF (p > 0.05). The optimal scaling regression mode is presented in . The quantification of the distance from the anterior surface of the fibroid to the skin, the volume of the uterine fibroid, the quantification of the signal intensity on T2WI and the enhancement type on T1WI was performed through the model of EEF. shows the results of the quantification of signal intensity on T2WI and shows the results of the quantification of enhancement type on T1WI. Based on these results, we obtained the optimal scaling regression equation for EEF: y ′ = 0.338X ′1 − 0.231X ′2 + 0.156X ′3 + 0.167X ′4, where variable y ′ stands for a quantified value of EEF; X ′1 stands for a quantified value of the distance from the anterior surface of fibroid to the skin; X ′2 stands for a quantified value of the volume of the uterine fibroid; X ′3 stands for a quantified value of the signal intensity on T2WI (hypointense = −1.2, isointense = −0.5, heterogeneous hyperintense = 1.9, homogenous hyperintense = 0.7) (); and X ′4 stands for a quantified value of the enhancement type on T1WI (slight enhancement = −0.8, moderate enhancement = −0.2, significant enhancement = 2.0) (. The tolerance of each statistically significant predictor was greater than 0.1, and no collinearity was found among the predictors. After the y ′ value was obtained using the equation, the real predicted EEF value can be found from . A scatter plot shows that the EEF distribution correlated well with predicted values (). The correlation coefficient between the actual EEF and the predicted EEF was 0.654, showing a strong correlation between them (p = 0.000).
Figure 5. Quantisation of the signal intensities of uterine fibroids for EEF.
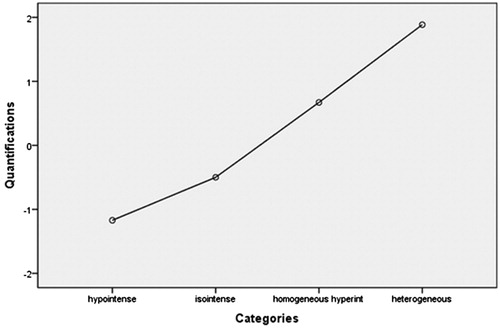
Figure 6. Quantisation of the enhancement types of uterine fibroids for EEF.
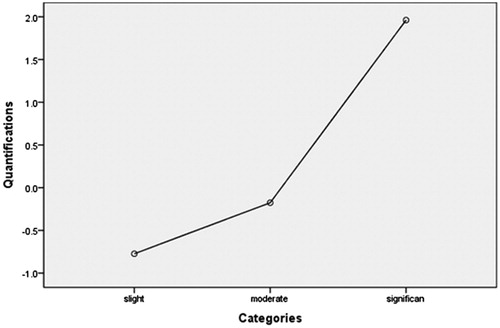
Figure 7. Correlation of EEF distribution and the predict values.
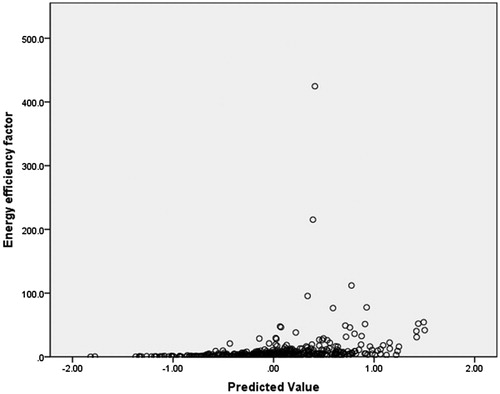
Table 3. Correlation between predictors and EEF.
Table 4. Optimal scaling regression mode of EEF.
Table 5. Optimal scaling level of EEF.
Establishment of model for sonication time
In this model, the sonication time was used as a dependent variable, and the factors including age, BMI, volume of the uterine fibroid, location of the uterus, type of uterine fibroid, signal intensity on T2WI, enhancement type on T1WI, thickness of the rectus abdominis, thickness of the subcutaneous fat layer, distance from the anterior surface of the fibroid to the skin, distance from the posterior surface of the fibroid to the skin, and abdominal surgical scarring were used as independent variables. The statistical analysis results showed that the volume of the uterine fibroid, distance from the posterior surface of the fibroid to the skin, type of uterine fibroid, signal intensity on T2WI, enhancement type on T1WI, age, and BMI all had a significant relationship with sonication time (). Then, we included these seven independent variables in a regression analysis as predictors to predict sonication time. In this model, “Nominal” was selected as the optimal scaling level for the categorical predictors of signal intensity on T2WI, type of uterine fibroid, and enhancement type on T1WI. “Numeric” was selected as the optimal scaling level for sonication time, volume of uterine fibroid, distance from the posterior surface of the fibroid to the skin, age and BMI. “Random” was selected as the initial configuration. The results of the regression analysis showed that the signal intensity on T2WI, the enhancement type on T1WI, the volume of the uterine fibroid, and the distance from the posterior surface of the fibroid to the skin were included into the optimal scaling regression mode. The included predictors in the model were all significantly related to the sonication time (p < 0.05), whereas the other predictors had no correlation with sonication time (p > 0.05). The optimal scaling regression mode is presented in . Quantification plots of signal intensity on T2WI and enhancement type on T1WI were saved in the model for sonication time. The quantification of signal intensity on T2WI was presented in and the quantification of enhancement type on T1WI was shown in . Based on the results, we obtained the optimal scaling regression equation for sonication time; y = 0.227X1 + 0.321X2 + 0.157X3 + 0.194X4. In this equation, y is the predicted sonication time; X1 stands for a quantified value of the distance from the posterior surface of the fibroid to the skin; X2 stands for a quantified value of the signal intensity on T2WI (hypointense = −1.4, isointense = −0.4, heterogeneous hyperintense = 1.4 homogenous hyperintense = 1.0); X3 stands for a quantified value of the enhancement type on T1WI (slight enhancement = −0.9, moderate enhancement = 0.1, significant enhancement = 1.8); X4 stands for a quantified value for the volume of the uterine fibroid. The tolerance of each predictor was greater than 0.1, and no collinearity was found among the predictors. After the value of y was solved for from this equation, we could find the predicted sonication time using . A scatter plot shows that the distribution of sonication time is correlated well with predicted values (. The correlation coefficient between actual sonication time and predicted sonication time was 0.563, showing a strong correlation between them (p = 0.000).
Figure 8. Quantisation of the signal intensities of uterine fibroids for sonication time.
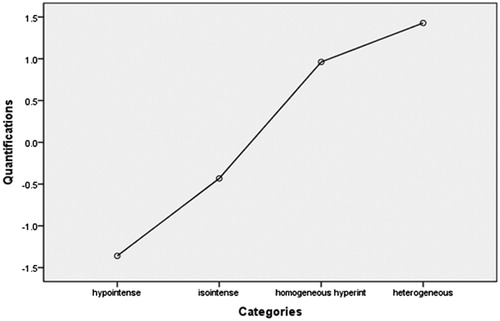
Figure 9. Quantisation of the enhancement types of uterine fibroids for sonication time.
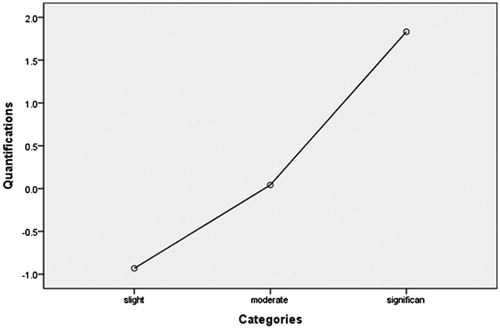
Figure 10. Correlationship between the distribution of sonication time and the predicted values.
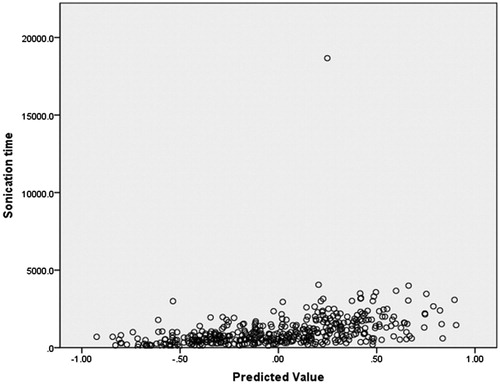
Table 6. Correlation between predictors and sonication time.
Table 7. Optimal scaling regression mode of sonication time.
Table 8. Optimal scaling level of sonication time.
Discussion
EEF and sonication time can be used as the quantitative indexes to reflect the difficulty level of HIFU ablation of uterine fibroids. In this study, we found that the independent variables included volume of the uterine fibroid, distance from the anterior surface of the fibroid to the skin, location of uterus, signal intensity on T2WI, enhancement type on T1WI, thickness of the rectus abdominis and thickness of the subcutaneous fat layer, which all had significant relationships with EEF. We also found the independent variables volume of the uterine fibroid, distance from the posterior surface of the fibroid to the skin, type of uterine fibroid, signal intensity on T2WI, enhancement type on T1WI, age and BMI had significant relationships with sonication time. These independent variables were considered as the categorical predictors.
With the introduction of multiple predictors into a categorical regression model, the results showed that the contribution of the independent variables, including the location of the uterus, type of uterine fibroid, the thickness of the rectus abdominis, the thickness of the subcutaneous fat layer, age and BMI, to the dependent variables was not significant. We found that only the distance from the anterior surface of the fibroid to the skin, the enhancement type on T1WI, the volume of the uterine fibroid, and the signal intensity on T2WI had significant contributions to EEF. These four predictors were quantified and brought into the regression model for EEF. y ′ = 0.338X ′1 − 0.231X ′2 + 0.156X ′3 + 0.167X ′4 can be used to calculate the value of EEF. The distance from the posterior surface of the fibroid to the skin, the enhancement type on T1WI, the volume of the uterine fibroid, and the signal intensity on T2WI had significant contributions to sonication time. These four predictors were quantified and brought into the regression model for sonication time. This equation y = 0.227X1 + 0.321X2 + 0.157X3 + 0.194X4 can be used to calculate the sonication time for treating a fibroid.
In comparison to the lesions located in superficial regions, deeper lesions required more energy to achieve the same volume of necrotic tissue because the interface in the acoustic pathway may arouse absorption, reflection, and scattering of ultrasound waves, and can eventually induce ultrasonic energy attenuation with an increasing amount of tissue in front of the focus. Peng et al. and Gong et al. investigated the relationship between EEF and focus depth, and found that the ultrasonic energy required to ablate the same unit volume of target tissue had a positive correlation with focus depth [Citation12,Citation15]. Our study demonstrated that the distance from the anterior surface side of fibroid to skin correlated well with EEF, while the distance from the posterior surface side of fibroid to skin correlated well with sonication time. For patients with fibroids closer to the skin, the EEF was significantly lower and the sonication time was significantly shorter. However, we did not find any significant correlations between the thickness of the rectus abdominis and the thickness of the subcutaneous fat layer with any dependent variables. These results may be explained by the small distribution ranges of the thickness of the rectus abdominis and the thickness of the subcutaneous fat layer.
Clinical studies have confirmed that the blood supply of uterine fibroids is related to the degree of difficulty of HIFU ablation [Citation10]. A higher degree of enhancement reflects a richer blood supply. In this study, we quantified the type of enhancement degree based on the optimal scaling regression model of EEF and found that slight enhancement equals −0.8, moderate enhancement equals −0.2, and significant enhancement equals 2.0. We also quantified the type of enhancement based on the optimal scaling regression model for sonication time and found that slight enhancement equals −0.9, moderate enhancement equals 0.1, and significant enhancement equals 1.8.
Biological characteristics of lesions can be reflected by different signal intensities on T2WI of MRI. Hyperintensity on T2WI of the fibroid indicates angiogenesis, richness in aqueous tissues and cell components with less fibrous tissue. In hypointense or isointense fibroids, angiogenesis is less common and fibrous content is richer than that of fibroids with hyperintensity on T2WI. Therefore, it is more difficult to treat uterine fibroids with hyperintense signals on T2WI than those with hypointense or isointense signals [Citation9,Citation12,Citation16–18] because the ultrasound beams can more easily penetrate and the energy is more difficult to deposit in a fibroid showing hyperintensity on T2WI. In this study, we quantified the different intensities on T2WI of the fibroids based on the optimal scaling regression model of EEF and obtained that hypointense equals −1.2, isointense equals −0.5, heterogeneous hyperintense equals 1.9 and homogenous hyperintense equals 0.7. We also quantified fibroids by T2WI signal type based on the optimal scaling regression model of sonication time and found that hypointense equals −1.4, isointense equals −0.4, heterogeneous hyperintense equals 1.4 and homogenous hyperintense equals 1.0.
In this study, we found that the volume of uterine fibroids is negatively related to EEF, which indicates that the larger the volume of uterine fibroid, the less the dosage required to ablate a given volume of fibroid. This may be explained by larger uterine fibroid occupying a larger area of the acoustic pathway, thus the sciatic pain is minimised during treatment and more acoustic energy could be delivered in a given time by decreasing the interval between sonications and therefore preventing the treated region from cooling down; since the necrotic area will dynamically influence the acoustic environment of fibroid tissue, it may also contribute to ultrasonic energy deposition [Citation19]. An experimental study done in vitro showed that the EEF for ablating a section of tissue is less than that for ablating a line of tissue, and the EEF for the volumetric tissue ablation is less than that for a section of tissue ablation, which can be used to explain this phenomenon [Citation14]. We also found that the volume of uterine fibroids is positively related to sonication time.
Our results have shown that the correlation coefficient between the predicted EEF and actual EEF was 0.654 (p = 0.000), and the correlation coefficient between the predicted sonication time and the actual sonication time was 0.563 (p = 0.000). Therefore, this scoring system is reliable in predicting the difficulty level of HIFU ablation of uterine fibroids.
This study is limited because this is a retrospective study and different doctors performing the procedure could have influenced dosage delivery or the termination of treatment. Another limitation is that for the measurement of the distance from the anterior/posterior surface of the fibroid to the skin by MRI, patients were in a supine position, but during treatment, the patients were in a prone position, which may have changed the distance. Therefore, it is necessary to perform a prospective study using these equations to get the predictive values in comparison with the actual values to improve these equations.
Conclusions
Based on the results of this study, a scoring system for predicting the difficulty level of HIFU ablation of uterine fibroids has been established. The equation of y ′ = 0.338X ′1 − 0.231X ′2 +0.156X ′3 + 0.167X ′4 can be used to predict EEF; while y = 0.227X1 + 0.321X2 + 0.157X3 + 0.194X4 can be used to predict the value of sonication time.
Disclosure statement
We are grateful to Wendy (Wenyi) Zhang for helping us edit and revise this paper. L.Z. is a senior consultant to Chongqing Haifu Company. The other authors report no conflict of interest to declare. The authors alone are responsible for the content and writing of the paper.
Additional information
Funding
References
- Okolo S. (2008). Incidence, aetiology and epidemiology of uterine fibroids. Best Pract Res Clin Obstet Gynaecol 22:571–88.
- Jolley S. (2009). An overview of uterine fibroids. Nurs Stand 24:44–8.
- Zhang L, Chen WZ, Liu YJ, et al. (2010). Feasibility of magnetic resonance imaging-guided high intensity focused ultrasound therapy for ablating uterine fibroids in patients with bowel lies anterior to uterus. Eur J Radiol 73:396–403.
- Chen J, Chen W, Zhang L, et al. (2015). Safety of ultrasound-guided ultrasound ablation for uterine fibroids and adenomyosis: a review of 9988 cases. Ultrason Sonochem 27:671–6.
- Funaki K, Fukunishi H, Sawada K. (2009). Clinical outcomes of magnetic resonance-guided focused ultrasound surgery for uterine myomas: 24-month follow-up. Ultrasound Obstet Gynecol 34:584–9.
- Zhang L, Wang ZB. (2010). High-intensity focused ultrasound tumor ablation: review of ten years of clinical experience. Front Med China 4:294–302.
- Zhang L, Zhang W, Orsi F, et al. (2015). Ultrasound-guided high intensity focused ultrasound for the treatment of gynaecological diseases: a review of safety and efficacy. Int J Hyperthermia 31:280–4.
- Orsi F, Arnone P, Chen W, Zhang L. (2010). High intensity focused ultrasound ablation: a new therapeutic option for solid tumors. J Cancer Res Ther 6:414.
- Zhao WP, Chen JY, Zhang L, et al. (2013). Feasibility of ultrasound-guided high intensity focused ultrasound ablating uterine fibroids with hyperintense on T2-weighted MR imaging. Eur J Radiol 82:e43–9.
- Zhao WP, Chen JY, Chen WZ. (2016). Dynamic contrast-enhanced MRI serves as a predictor of HIFU treatment outcome for uterine fibroids with hyperintensity in T2-weighted images. Exp Ther Med 11:328–34.
- Mindjuk I, Trumm CG, Herzog P, et al. (2015). MRI predictors of clinical success in MR-guided focused ultrasound (MRgFUS) treatments of uterine fibroids: results from a single centre. Eur Radiol 25:1317–28.
- Peng S, Zhang L, Hu L, et al. (2015). Factors influencing the dosimetry for high-intensity focused ultrasound ablation of uterine fibroids: a retrospective study. Medicine 94:e650.
- Orsini LF, Salardi S, Pilu G, et al. (1984). Pelvic organs in premenarcheal girls: real-time ultrasonography. Radiology 153:113–6.
- Li F, Wang Z, Du Y, et al. (2006). Study on therapeutic dosimetry of HIFU ablation tissue. Sheng Wu Yi Xue Gong Cheng Xue Za Zhi 23:839–43.
- Gong C, Yang B, Shi Y, et al. (2016). Factors influencing the ablative efficiency of high intensity focused ultrasound (HIFU) treatment for adenomyosis: a retrospective study. Int J Hyperthermia 32:496–503.
- Oguchi O, Mori A, Kobayashi Y, et al. (1995). Prediction of histopathologic features and proliferative activity of uterine leiomyoma by magnetic resonance imaging prior to GnRH analogue therapy: correlation between T2-weighted images and effect of GnRH analogue. J Obstet Gynaecol 21:107–17.
- Murase E, Siegelman ES, Outwater EK, et al. (1999). Uterine leiomyomas: histopathologic features, MR imaging findings, differential diagnosis, and treatment. Radiographics 19:1179–97.
- Funaki K, Fukunishi H, Funaki T, et al. (2007). Magnetic resonance-guided focused ultrasound surgery for uterine fibroids: relationship between the therapeutic effects and signal intensity of preexisting T2-weighted magnetic resonance images. Am J Obstet Gynecol 196:184 e1–6.
- Chen L, ter Haar G, Hill CR. (1997). Influence of ablated tissue on the formation of high-intensity focused ultrasound lesions. Ultrasound Med Biol 23:921–31.