
Abstract
Purpose: Integrating small-animal experimental hyperthermia instrumentation with magnetic resonance imaging (MRI) affords real-time monitoring of spatial temperature profiles. This study reports on the development and preliminary in vivo characterisation of a 2.45 GHz microwave hyperthermia system for pre-clinical small animal investigations, integrated within a 14 T ultra-high-field MRI scanner.
Materials and methods: The presented system incorporates a 3.5 mm (OD) directional microwave hyperthermia antenna, positioned adjacent to the small-animal target, radiating microwave energy for localised heating of subcutaneous tumours. The applicator is integrated within the 30 mm bore of the MRI system. 3D electromagnetic and biothermal simulations were implemented to characterise hyperthermia profiles from the directional microwave antenna. Experiments in tissue mimicking phantoms were performed to assess hyperthermia profiles and validate MR thermometry against fibre-optic temperature measurements. The feasibility of delivering in vivo hyperthermia exposures to subcutaneous 4T1 tumours in experimental mice under simultaneous MR thermometry guidance was assessed.
Results: Simulations and experiments in tissue mimicking phantoms demonstrated the feasibility of heating 21–982 mm3 targets with 8–12 W input power. Minimal susceptibility and electrical artefacts introduced by the hyperthermia applicator were observed on MR imaging. MR thermometry was in excellent agreement with fibre-optic temperatures measurements (max. discrepancy ≤0.6 °C). Heating experiments with the reported system demonstrated the feasibility of heating subcutaneous tumours in vivo with simultaneous MR thermometry.
Conclusions: A platform for small-animal hyperthermia investigations under ultra-high-field MR thermometry was developed and applied to heating subcutaneous tumours in vivo.
Introduction
Several clinical trials have established mild hyperthermia, tissue heating in the range of 40 < T < 45 °C for 20–90 min, as a potent sensitiser for tumour radiation therapy and chemotherapy [Citation1]. Mild heating has also been extensively investigated as a stimulus for triggered release of therapeutic agents for the treatment of cancer and other diseases [Citation2–7]. The optimal target temperature and heating duration for triggered release may vary in the range between 39 and 42 °C; at temperatures in excess of 42 °C, heat-induced microvascular damage limits effectiveness of this modality. Thermal therapies are also known to stimulate a mild antitumour immune response [Citation8,Citation9], although, the time–temperature profiles that yield optimal stimulation of the immune response are not currently well understood. In addition to hyperthermia, thermal ablation, heating to temperatures in excess of 50 °C, is in clinical use for the treatment of localised tumours in the liver, kidney, lung and other organs [Citation10]. As clinical application of thermal therapies grows, there have been increased efforts investigating thermal therapies as part of multimodality cancer treatment strategies [Citation11]. Due to the availability of extensively developed tumour models, pre-clinical investigations in experimental small animals are widely employed to elucidate the efficacy and mechanisms of novel therapies [Citation12].
Platforms for reliable delivery of prescribed experimental thermal therapy protocols (i.e. desired time–temperature profiles) to small animal targets are a crucial tool for facilitating these pre-clinical investigations. As in the clinical scenario, a challenge to reliably delivering a desired thermal dose to experimental small animals is that hyperthermia procedures employing a fixed set of energy delivery parameters (e.g. applied power levels, heating duration) may yield highly variable transient temperature profiles, due to considerable variations in tissue biophysical properties. Therefore, clinical and experimental hyperthermia procedures often incorporate a mechanism for monitoring transient temperature profiles. When combined with automatic feedback control algorithms, these platforms facilitate the delivery of hyperthermia treatments with increased likelihood of meeting the desired treatment goal. While probe-based temperature sensors, such as thermocouples and thermistors, provide an inexpensive and facile mechanism for monitoring tissue temperature profiles, they increase the invasiveness of the procedures, thereby posing a risk of complications such as infection and haemorrhage, may reduce patient comfort, and only provide temperature measurement at discrete points [Citation13]. In contrast, image-based temperature measurements such as magnetic resonance imaging (MRI) thermometry using the proton resonance frequency shift (PRFS) technique, afford spatio-temporal monitoring of hyperthermic exposures [Citation14]. Ultrasound [Citation15] and X-ray CT [Citation16]-based thermometry have also been the subject of investigation for monitoring clinical and experimental thermal therapy procedures. Besides thermometry, MRI affords the potential for monitoring structural, physiological and metabolic changes within tissue during thermal therapy.
Convective heating of experimental tumours in rodents within a temperature controlled water bath provides a practical heating modality that has been widely used for pre-clinical thermal therapy investigations [Citation17–19]. Water bath heating yields near-homogeneous temperature profiles; however, it is challenging to restrict heating to the tumour. For example, to heat tumours implanted in a limb, the entire limb may be immersed within the hot water bath leading to heating of skin and muscle adjacent to the tumour [Citation19]. Systems employing ultrasound transducers have been developed for investigating thermal and mechanical effects of therapeutic ultrasound energy [Citation20–26]. Several of these systems have been integrated with MRI to enable feedback-controlled delivery of prescribed thermal dose profiles. Microwave and radiative radiofrequency applicators have also been employed for small animal hyperthermia; however, these have typically relied on invasive temperature sensors [Citation27,Citation28]. Due to the relatively long wavelength of microwave energy in tissue (∼cm), there are considerable technical challenges with limiting the volume of heating that can be achieved within small animal targets. Two types of radiofrequency/microwave (i.e. frequency > ∼70 MHz) applicators have been developed for hyperthermia – surface applicators and whole-body applicators. Surface applicators typically consist of single or multiple radiative elements, integrated with surface cooling to limit skin heating. This results in peak tissue temperature close to the skin surface and relatively less homogeneous heating within the target. Whole body applicators consist of multielement antenna arrays, positioned around the targeted region. Suitable selection of excitation amplitude and phase for each antenna enables focussing of electric fields within deep-seated targets, with minimal heating of surrounding tissues. The use of antenna arrays facilitates more homogeneous heating than surface applicators. As such, in humans and large animals, array applicators are best suited for treating deep-seated targets, while surface applicators are well suited for treating superficial targets [Citation29]. In smaller animals, such as rodents, which are often used for pre-clinical investigations, surface applicators may be suitable for heating both superficial and deep-seated targets [Citation28]. James et al., developed a dual-mode radiofrequency coil for delivering inductive hyperthermia, while also serving as an MRI receive coil [Citation30].
To date, the vast majority of experimental hyperthermia platforms that have been integrated with MRI have been implemented on clinical MR scanners – typically 1.5 or 3 T [Citation31,Citation32], although a 9.4 T system has recently been reported [Citation27]. Ultra-high-field MRI (B0>7 T) systems have emerged offering the advantages of imaging at high spatial and temporal resolution [Citation33]. In such systems, the high magnetic field is confined within a small bore, typically on the order of a few centimetres. In comparison, the bore size for 3 T clinical systems is typically on the order of ∼60–70 cm, which affords the inclusion of wide aperture focussed ultrasound transducers. Due to the limited space within the bore, integrating existing small animal hyperthermia delivery systems within ultra-high-field scanners is a considerable technical challenge.
The objective of this study is to describe the technical development and characterisation of an integrated platform for preclinical thermal therapy investigations in experimental small animals under 14 T ultra-high-field MRI guidance. 3D electromagnetic-biothermal simulations are employed to characterise the heating profile of the applicator. Applicators were fabricated from MRI-compatible materials and experimentally assessed to evaluate integration within the high-field MRI environment. MR thermometry using the PRFS technique was employed to characterise hyperthermia profiles delivered by the proposed applicator and verified against fibre-optic temperature measurements. MRI-derived temperature maps from preliminary in vivo heating experiments with the proposed system are presented.
Methods
System design goals
The proposed system was designed to enable pre-clinical thermal therapy investigations in small animals under ultra-high-field MRI guidance. While the primary efforts in this study are focussed towards mild hyperthermia (39–42 °C) exposures, our long-term objective is to apply the system for both hyperthermia and thermal ablation studies. Within the mild hyperthermia temperature range, increased blood perfusion, enhanced extravasation and triggered release (e.g. via temperature-sensitive liposomes), offer several advantages for enhancing the efficacy and potentially reducing side effects of radio- and chemotherapy. The applicator was designed to facilitate delivery of hyperthermic temperature profiles to targeted tissue within the 14 T MRI scanner. The applied power levels necessary for achieving adequate heating, while limiting peak tissue temperatures, will be guided by MR thermometry; we note that for this initial study, real-time MR thermometry data were not available due to restrictions of the MRI scanner control software. The targeted tumours are expected to range in size from 3 to 10 mm (maximum diameter), subcutaneously implanted in the mouse flank.
Specific system design goals/challenges include: (1) the hyperthermia device has to fit within the 30 mm diameter microimaging probe, while allowing space for the experimental animal and monitoring system; (2) electromagnetic and material artefacts introduced by the hyperthermia applicator should not compromise MR thermometry within the target region; (3) temperature measurements derived from MR thermometry should be within 1 °C of fibre-optic measurements; (4) the hyperthermia applicator should be able to heat subcutaneous targets, while thermally sparing the skin surface.
A challenge when introducing RF/MW applicators within the MRI environment is the potential for electrical interference between the radiative hyperthermia applicator and the MRI receive coils. This may be due to spurious frequencies introduced by the signal generator, resulting in radiation at frequencies other than the operating frequency (i.e. other than 2.45 GHz). For instance, Morikawa et al. [Citation34] reported severe radiofrequency noise on MR images when performing 2.45 GHz microwave ablation within a 0.5 T scanner. By using a notch filter at the Larmor frequency, they were able to mitigate this radiofrequency interference. The role of the filter was to attenuate spurious signals from the microwave source at frequencies other than the antenna operating frequency, and especially the Larmor frequency [Citation34]. For similar reasons, low-pass filters are typically employed in therapeutic ultrasound systems integrated with MRI [Citation20,Citation35].
System description and implementation
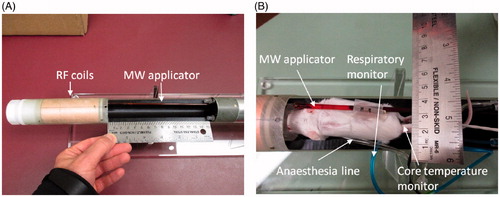
Due to the limited space available within the microimaging probe of the 14 T vertical scanner (Bruker Ascend III, 30 mm diameter microimaging probe), we investigated the feasibility of delivering hyperthermia with a coaxial-type microwave applicator positioned adjacent to the experimental small animal. The applicator is adapted from a 2.45 GHz directional microwave antenna, previously developed for thermal ablation applications, as described by McWilliams et al. [Citation36]. The antenna consists of a coaxial monopole antenna, augmented with a hemicylindrical reflector to limit energy in a preferred direction (i.e. away from the reflector). The device incorporates circulating water, which provides active cooling to mitigate heating along the applicator length to cool the skin surface, and provides a high-dielectric constant medium, to reduce the wavelength, thereby limiting overall applicator diameter. Hyperthermia applicators were constructed from MRI-compatible materials for experimental evaluation. The applicator has an outer diameter of 3.5 mm and an overall length of 65 cm, so the radiating element is appropriately positioned within the micro-imaging probe of the vertical scanner. Coaxial cable with copper for the outer conductor, low density PTFE for the dielectric, and silver-plated copper for the 0.32 mm diameter centre conductor (UT-47 C-LL, Micro-coax, Philadelphia, PA) was employed to implement the monopole antenna. The coaxial cable was inserted into a 2.4 mm (OD) and 1.7 mm (ID) copper tubing (McMaster-Carr, Elmhurst, IL), which served as the reflector structure. A 3.5-mm (OD) polyimide tube (American Durafilm, Holliston, MA) was used to enclose the applicator. An SMA connector with copper beryllium alloy for the cable entry centre contact, cable entry outer contact and body and PFA/PTFE for the dielectric (21_SMA-50–1-2/111_NE, Huber + Suhner, Pfäffikon, Switzerland) was used to feed the antenna. Room temperature (∼20 °C) water was circulated through the applicator with a peristaltic pump; the water was continuously circulated throughout the applicator during heating experiments. The small-animal microimaging probe incorporates lines for anaesthesia, and respiratory and animal core-temperature monitoring. illustrates the proposed system, including photographs of the applicator positioned adjacent to an experimental animal.
Figure 1. (A) MR microimaging probe with the microwave hyperthermia applicator, and (B) hyperthermia applicator positioned adjacent to an experimental animal.
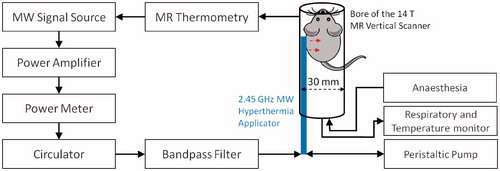
During experimental hyperthermia sessions, microwave power was supplied using an HP 8648 C signal generator (Keysight, Santa Rosa, CA) and a solid-state amplifier (RFCore, RCA0527H49A, Karmel Tech, Korea). A Bird 5012 A (Bird Technologies, Solon, OH) power meter was employed to measure forward and reflected power during experiments. A three port 50 Ω high-power PE8432 circulator (Pasternack, Fitch, Irvine, CA) was connected in line with the power meter and to the input port of a ZFBP-2400 + 2400 MHz ±100 MHz bandpass filter (Mini-Circuits, Brooklyn, NY). The circulator was included as a precautionary measure to limit the amount of reflected power returned to the amplifier. The bandpass filter was employed to attenuate spurious frequencies at the MRI scanner Larmor frequency, thereby mitigating electrical interference between hyperthermia applicator and the micro MR receiver coils. All power measurements reported were made with the power meter positioned proximal to the circulator; attenuation measurements indicated that approximately 20–25% of the reported power measurements reached the input port of the antenna. shows the block diagram of the small-animal microwave hyperthermia integrated with 14 T MR thermometry system. Due to the highly localised fields of the 14 T vertical scanner, the hyperthermia delivery instrumentation can be placed in the same room and adjacent to the scanner.
Figure 2. Block diagram of small-animal microwave hyperthermia system integrated with 14 T MR thermometry.
Paravision 6.0.1 software (Bruker BioSpin MRI GmbH, Ettlingen, Germany) was used to acquire the MR data for all the experiments. High-resolution anatomical images were acquired with a T1-RARE protocol (multislice, rapid acquisition with refocused echoes) with parameters: TR/TE =1700/4.50 ms, field of view (FOV) = 30 mm, image size =128 × 128, flip angle = 90°, slice thickness = 1 mm, number of slices = 13, scanning duration = 2 min 30 s. MR thermometry was implemented using the PRFS technique, acquired with a FLASH protocol (fast low angle shot) with parameters TR/TE = 40/4.0 ms, FOV = 30 mm, image size = 128 × 128, flip angle = 25°, slice thickness = 1 mm, one slice, scanning duration = 5 s and PRF temperature coefficient α= −0.01 ppm/°C.
Computational model
A 3D electromagnetic-heat transfer model using the finite-element method was implemented to characterise the energy deposition and temperature profiles afforded by the proposed system. Models were employed to assess the relationship between applied power level and spatiotemporal temperature profiles in tissue phantoms. Electric fields radiated into tissue phantoms were computed using the time-harmonic wave equation:
(1)
where E [Vm−1] is the electric field, β0 [m−1] is the wavenumber in free space, εr is relative permittivity, σ [Sm− 1] is electric conductivity, ω [rads−1] is angular frequency and ɛ0 [Fm−1] is the permittivity of free space. The time-averaged resistive losses are given by the equation:
(2)
Transient temperature profiles due to microwave heating were then computed using the transient heat equation:
(3)
where ρ [kg m−3] is density, c [Jkg−1 K−1] is specific heat capacity, T [K] is the temperature, and k [Wm−1 K−1] is the thermal conductivity. lists all material properties for the tissue-mimicking phantom employed in this study. illustrates the geometry employed for computer simulations. The antenna is positioned 1.25 mm from the edge of a cylindrical container (27 mm diameter, 70 mm length) filled with a tissue-mimicking agar phantom. The phantom initial temperature was set to 20 °C. To approximate surface cooling provided by circulating water at room temperature, a fixed temperature boundary condition of T = 20 °C was applied at the applicator surface (i.e. the components of the applicator were excluded from thermal simulations). Perfect electric conductor boundary conditions were applied on all metallic surfaces. Scattering boundary conditions were applied at the edges of the phantom to minimise reflections at model boundaries. The model was discretised using a non-uniform mesh of tetrahedral elements, with the finest meshing at the antenna input port (maximum edge length = 0.2 mm), and the coarsest elements were employed further away from the antenna (maximum element edge length = 4.0 mm). Electromagnetic and thermal simulations were implemented using COMSOL Multiphysics (Burlington, MA) on a computer with 16 GB RAM and an Intel i7–4702HQ processor.
Figure 3. Illustration of geometry employed in the computational model.
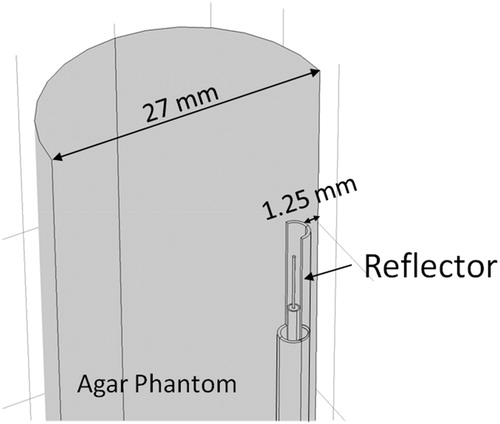
Table 1. Thermal and dielectric properties (at 2.45 GHz) used in simulations.
Experimental evaluation in tissue-mimicking phantoms
An agar tissue-mimicking phantom was fabricated for experimental characterisation of the fabricated hyperthermia applicators. To reduce T1 relaxation time and to increase MR signal intensity, the agar phantom was doped with 3.3 mM copper sulphate. Dielectric properties of the agar phantom were measured with an Agilent 85070 D (Santa Clara, CA) open-ended coaxial dielectric probe kit. The measured values were relative permittivity of 34.6 and effective conductivity of 0.93 S/m at 2.45 GHz. The impedance matching of fabricated antennas was evaluated with the antennas loaded within the agar phantom at room temperature using a HP8753D (Keysight, Santa Rosa, CA) vector network analyser. Three fibre-optic temperature probes (Neoptix RFX-04–1, Qualitrol, Fairport, NY) guided with a PTFE template were placed within the tissue-mimicking phantom, two probes in the direction of microwave radiation and one in the reverse direction.
Subcutaneous tumour model and in vivo hyperthermia experiments
The integrated platform for microwave hyperthermia delivery under high-field MRI guidance was used to deliver hyperthermia to two mice with subcutaneously implanted tumours in vivo. The experimental tumour model was established as follows. 4T1-Luc2 cells were purchased from Caliper Life Sciences (Hopkinton, MA). These cells stably express firefly luciferase, Luc2. The line was established by transducing lentivirus-containing luciferase 2 gene under the control of the human ubiquitin C promoter. Cells were maintained in RPMI 1640 (Gibco, Grand Island, NY) containing 10% foetal bovine serum (Sigma-Aldrich, St. Louis, MO) and were subcultured by lifting using 0.25% trypsin-EDTA (Sigma-Aldrich, St. Louis, MO). Prior to injection into the mice, cells were lifted, then counted using Trypan Blue dye (Sigma-Aldrich, St. Louis, MO) and a Cellometer AutoT4 cell counter (Nexcelom, Lawrence, MA). The desired number of cells was centrifuged for 3 min at 1000 rpm, the medium was aspirated, and the cells were resuspended in phosphate-buffered saline.
Two-month-old Balb/C mice were obtained from Charles River (Wilmington, MA) and were housed in the facility of the Comparative Medicine Group of Kansas State University (KSU). Animal experiments were carried according to a protocol approved by KSU’s Institutional Animal Care and Use Committee (IACUC). One day prior to the implantation of tumour cells in the mice, the lower right flank of mouse hair was removed using an hair clipper and hair removal cream. The following day, 10 000 4T1 Luc2 cells were resuspended in 10 μL 1X PBS as described earlier and injected subcutaneously on the lower right flank of the mice using a 25-μL Hamilton syringe. Prior to delivering hyperthermia, the mouse was anaesthetised in an induction chamber using 3% of isoflurane and 1000 cc/circuit flow of oxygen and placed on the MRI microimaging probe. Artificial tear, lubricant ophthalmic ointment (Patterson Veterinary, Devens, MA) was applied to both eyes of the mice to prevent drying. Isoflurane tubing, respiratory monitoring unit and core temperature monitor were attached to the mouse and the microwave applicator was positioned so as to direct microwave radiation towards the tumour and the microimaging probe was inserted into the MRI scanner. Warm water was circulated in the MRI unit to keep the mouse warm and isoflurane level was maintained at 1.5–2% with 500 mL/circuit flow of oxygen. The position of the mouse inside the micro-imaging probe was determined by running a localiser scan, and orientation of the microwave antenna with respect to the tumour was further confirmed with a T1-RARE sequence.
The hyperthermia experiment was performed with applied input power of 20 W. Transient temperature profile of the tumour area was measured during hyperthermia with a FLASH sequence, identical to what was used for phantom experiments. Respiratory rate and core-temperature of the mouse were continuously monitored during all in vivo experiments. At the end of hyperthermia procedures, the mouse was removed from the scanner and placed in a warm cage until it recovered and later transported to the animal facility in a HEPA filter containing transport cage.
Results
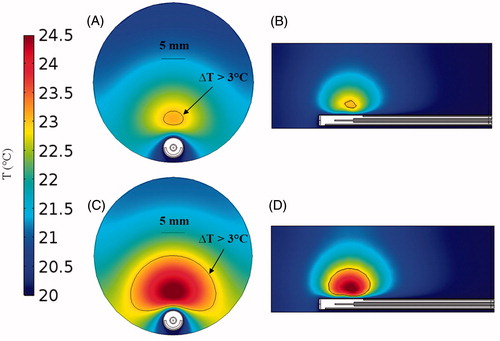
illustrates simulated temperature profiles with the microwave applicator in an agar phantom. Simulation results indicate that 21 mm3 volumes can be heated to a temperature rise of 3 °C for antenna input power of 8 W, compared to 982 mm3 at 12 W for a heating duration of 5 min. Furthermore, the simulations also suggest that circulating water enables thermal sparing of regions immediately adjacent to the applicator surface; temperature elevation is maintained below 3 °C at distances up to 2.1 mm for 8 W input power, and 0.7 mm for 12 W input power.
Figure 4. Temperature maps derived from simulations in agar phantom after 5 min heating with an input power of 8 W (A) in axial view and (B) sagittal view; and input power 12 W (C) in axial view and (D) sagittal view.
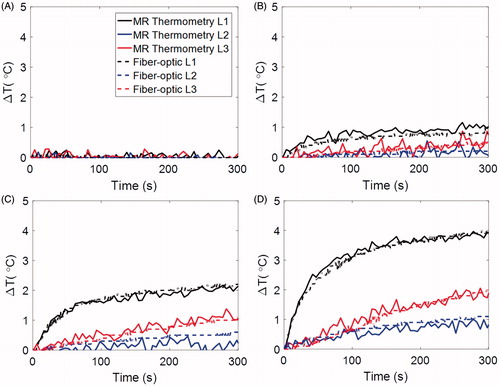
shows a T1-weighted image acquired using a RARE sequence (axial and sagittal views) of the applicator inserted within the agar phantom. These images indicate minimal susceptibility artefact introduced by the applicator. Furthermore, the high spatial resolution afforded by the 14 T scanner enables identification of the orientation of the antenna; the 0.7-mm-thick metallic reflector can clearly be identified and facilitates confirmation of antenna orientation relative to the target. Temperature measurements from fibre-optic probes compared to MR thermometry (in 3 × 3 pixel ROIs) are shown in with antenna input power of 0 W, 2 W, 5 W and 10 W over 5 min microwave exposure. The location of the ROIs is shown in . The experiment with 0 W input power indicates that the discrepancy between fibre-optic and MR-thermometry is within 0.4 °C. Across all experiments, MR-derived temperature measurements were within ±0.6 °C of fibre-optic temperature measurements. Temporal interval between successive thermometry images was ∼5 s.
Figure 5. T1-RARE images of the antenna in agar phantom. (A) Axial view and (B) sagittal view through the dotted line shown in (A).
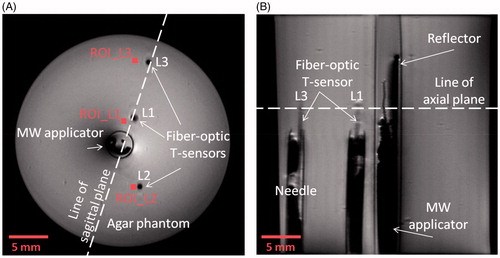
Figure 6. Experimentally measured fibre-optic temperatures at the locations “L1”, “L2” and “L3” and MR thermometry at the locations “ROI_L1”, “ROI_L2” and “ROI_L3” shown in Figure 5, with antenna input power of (A) 0 W, (B) 2 W, (C) 5 W and (D) 10 W.
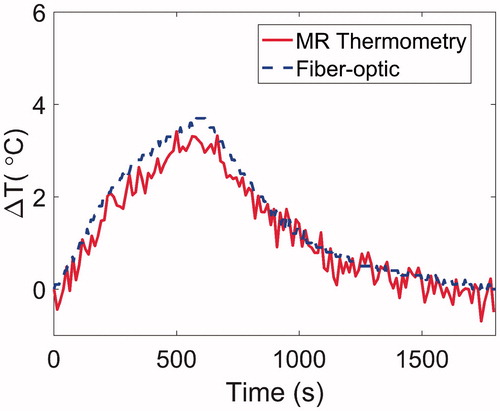
Since in preliminary experiments (data shown in ), MR scanning was terminated at the same time as microwave power was turned off, it was not possible to observe whether the temperature change, as calculated by MRI thermometry, returned to 0 °C. An additional heating experiment was conducted with 15 W applied for 10 min; MR scanning was performed throughout the heating process and continued for 20 min following heating to assess the temperature calculations during the cool down period. The data from this experiment, compared to a fibre-optic temperature sensor, are provided in . These data indicate that MRI-derived temperature calculations yield temperature elevations returning to 0 °C, similar to fibre-optic thermometry. To further assess drift, a 20 min scan was conducted without any heating to observe temperature elevations within a phantom. This experiment indicated that temperature changes were less than 0.2 °C, suggesting minimal impact of drift on temperature calculations.
Figure 7. Experimentally measured fibre-optic temperatures and MR thermometry for a 10 min heating experiment with 15 W input power followed by 20 min cool down period.
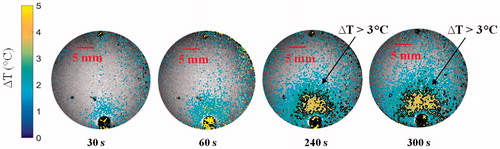
In order to characterise temperature profiles in the forward and reverse directions, we first measured the temperature distribution when the antenna was placed in the centre of the phantom. In further experiments, the temperature distribution was measured with the antenna positioned on the periphery of the agar phantom, similar to experiments with small animals. shows temperature maps following 5 min, 10 W microwave exposures with the antenna located in the centre and on the periphery of the agar phantom. shows the transient evolution of the temperature profile in the agar phantom over a 5 min, 10 W microwave exposure with the antenna located on the periphery of the phantom.
Figure 8. (A) Temperature elevation map with the antenna in the centre of the phantom, and (B) with the antenna positioned along the phantom periphery. In both cases, the antenna input power was set to 10 W and the temperature maps are shown after 5 min heating.
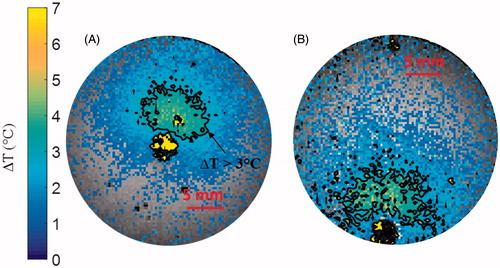
Figure 9. Transient evolution of the temperature profile in the agar phantom during a 5 min microwave exposure at 10 W.
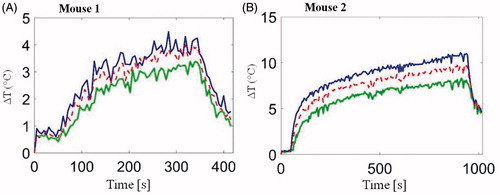
As illustrated in , T1-weighted RARE sequences enabled accurate localisation of the implanted subcutaneous tumour and the hyperthermia antenna orientation relative to the tumour. illustrates the transient evolution of spatial temperature profiles during two in vivo (mouse 1 and mouse 2) microwave hyperthermia exposures with 20 W applied power to the antenna. Transient temperature profiles for mouse 1 and mouse 2 at three locations (3 × 3 ROIs shown in ) within implanted subcutaneous tumours, are shown in .
Figure 10. Anatomical axial image depicting the microwave applicator and in vivo mice with implanted subcutaneous tumour enclosed within the red-dashed line.
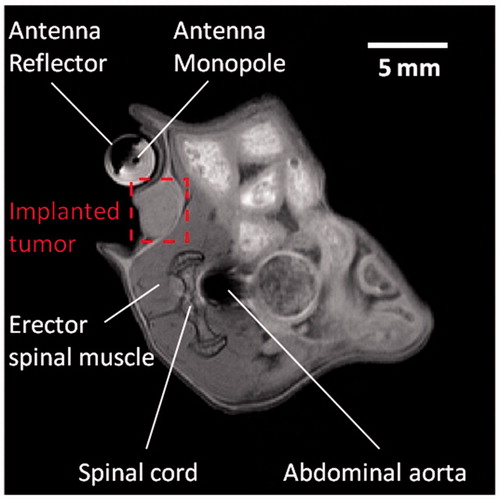
Figure 11. Transient evolution of spatial temperature profiles during and after (A) 5 min and (B) 15 min microwave exposure in vivo with 20 W input power.
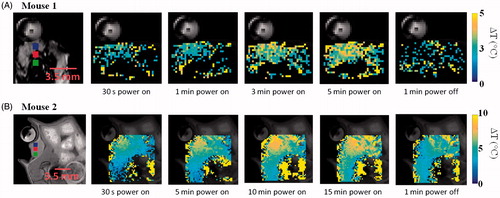
Figure 12. In vivo transient temperature profiles within subcutaneous tumours during (A) 5 min microwave exposure (from regions 2.3, 3 and 3.5 mm radially from the applicator) and (B) 15 min microwave exposure (from regions 2, 3 and 4 mm radially from the applicator). Input power was 20 W for both experiments. ROIs are shown in Figure 11.
Discussion
We have designed and implemented a system for delivering microwave hyperthermia to experimental small animal targets integrated with 14 T MR thermometry. The limited size of the microimaging probe within the 14 T high-field scanner (30 mm), precludes the use of existing small animal hyperthermia applicators, such as those using focussed ultrasound transducers [Citation23,Citation24,Citation26]. The proposed 3.5 mm (OD) applicator is positioned along the periphery of the microimaging probe adjacent to the mouse and directs microwave energy towards the target (), leaving sufficient room for the mouse, anaesthesia lines and vital signs monitoring sensors (i.e. respiratory pad, core temperature monitor).
Simulations predicted the ability of the device to generate mild temperature elevation (3 ≤ ΔT ≤ 5 °C) in volumes ranging between 21–982 mm3. Simulations also predicted a 0.7–2.1 mm gap between the antenna and the hyperthermic region, illustrating the feasibility of thermally sparing the skin of experimental animals during hyperthermia exposures (). The short length of the hyperthermia applicator radiating element of 6 mm limits heating along the applicator length. Since implanted tumours in mice models are typically in the range of 3–10 mm diameter (volumes in the range of 36–1333 mm3), these results demonstrate suitability of the proposed applicator for delivering hyperthermia during pre-clinical experiments. Spatial temperature profiles in tissue phantoms measured with MRI thermometry ( and ) illustrate the ability to achieve temperature rises of ΔT > 3 °C at radial distances up to ∼6 mm from the applicator.
Minimum susceptibility artefacts were observed on MR imaging with the applicator inserted in an agar phantom (). The geometry of the antenna reflector could be readily detected with a T1-RARE sequence, thereby providing a means for confirming appropriate orientation of the directional microwave antenna with respect to the target. Detailed visualisation of the antenna structure also provides a guide for prescribing location of MR thermometry slices.
MR thermometry was validated against fibre-optic temperature measurements with the antenna radiating into an agar phantom (). The uncertainty of MR thermometry measurements was 0.4 °C when antenna input power was 0 W, indicating excellent stability of the system, and it’s suitability for monitoring hyperthermia experiments. Also evident in and is the lack of observable B0 drift over 5–30 min imaging. Maximum temperature variation between fibre-optic measurements was 0.3 °C, 0.4 °C and 0.6 °C, respectively, for the cases were the antenna input power was 2 W, 5 W and 10 W; all the measurements were within the manufacturer-specified uncertainty of the fibre-optic probes (±0.8 °C). Given the high spatial and temporal resolution of 14 T MR thermometry, and the minimal electrical interference between the applicator and the scanner, the presented system may also provide a means for validation of electromagnetic-heat transfer models that are typically employed for design of microwave thermal therapy applicators. This may be especially important for thermal ablation applications where there are significant changes in tissue dielectric properties, and there are limited means for experimentally measuring spatial temperature profiles during ablation.
Preliminary in vivo characterisation of the system was assessed in two mice with implanted 4T1 tumours. High-resolution anatomic scans with a T1-RARE sequence facilitated tumour localisation, and appropriate positioning of the applicator (). As illustrated in and , temperature profiles could be measured simultaneous to microwave exposure with MR thermometry. In this study, a fixed microwave power level was applied for the duration of heating. With the same input power, we observed considerable differences in spatial temperature profiles between the two experiments with 5 min and 15 min heating duration, which may be due to differences in tissue biophysical properties, as well as discrepancies in experimental setup, such as the relative position of the experimental mouse and the applicator. These preliminary results demonstrate the need for incorporating feedback control algorithms to adjust applied power levels during experiments in order to maintain temperature profiles within the prescribed range.
The rectal temperature probe indicated temperature increases of 1.8 and 5.7 °C, respectively, for the two in vivo experiments. This may be an indication of heating of tissue adjacent to the rectum, or an elevation in the core body temperature as a result of microwave power dissipation within the tumour. If core temperature was elevated substantially during heating, after microwave power was turned off, tumour temperature would take longer to return to the pre-heating temperature, compared to cases when core temperature was not significantly altered during tumour heating. While we note that the ΔT profiles in (Mouse 2, for which the rectal temperature probe indicated a rise of 5.7 °C) did not return to 0 °C after microwave power was turned off, this may be because temperature data were not acquired for a long enough duration following the end of heating. These observations indicate the need to incorporate a method for regulating core body temperature of the animal. Prior to initiating heating, such a system would enable warming of the mouse to counteract the effects of anaesthesia, which impairs the animal’s natural thermoregulatory system. Secondly, the system would enable adequate cooling of the mouse to ensure core temperature remains stable during hyperthermia exposures. We are currently investigating methods for maintaining the core temperature of the mouse both prior to and during hyperthermia exposures within the limited space of our scanner.
The presented system will facilitate pre-clinical investigations of thermal therapy protocols as part of multimodality cancer therapy strategies. While small-animal hyperthermia systems have been developed and integrated with scanners up to 9.4 T [Citation27], there are limited data available at higher field strengths. Benefits of using higher field strengths include the ability to perform imaging with higher spatial and temporal resolution. Rapid temporal resolution may enable simultaneous imaging of temperature, as well as other physical/physiological changes in tissue during experimental hyperthermia procedures. Although the limited bore size presents a challenge with regards to the space available for integrating hyperthermia instrumentation, an advantage of this system is that the delivery of power to the applicator is simplified (i.e. microwave power source and other electrical components can be positioned in close vicinity to the scanner, rather than delivered from another room through a waveguide, as is typical for clinical scanners). Compared to small hyperthermia systems employing focussed ultrasound, the proposed applicator may allow for simplified heating of tumour volumes without requiring scanning of the therapeutic beam [Citation20,Citation23].
A limitation of this study is the relatively short maximum heating duration (∼15 min). While this treatment duration may be suitable for some applications, many thermal therapy applications require longer heating durations. Due to the significant motion associated with the cardiorespiratory cycle, care had to be taken to position the applicator and experimental mouse to minimise impact on thermometry quality. The time taken during these efforts limited the total amount of time available for experimental heating as permitted by our current IACUC protocol. Future efforts will investigate the use of MR thermometry sequences that correct for motion-related errors, as well as include experiments with longer heating durations [Citation37]. The signal to noise ratio of the temperature images could be further improved by reducing spatial resolution [Citation38].
Conclusions
We have designed and demonstrated a platform for performing pre-clinical hyperthermia experiments in small animals under 14 T ultra-high-field guidance. MR-derived temperature maps in agar-based phantoms were validated with fibre-optic temperature measurements. Maximum error between MR thermometry and fibre-optic temperatures measurements was 0.6 °C with antenna input power of 10 W. There was no observable electrical artefact introduced by operation of antenna within the MR environment. Susceptibility and flow artefacts were negligible and localised to submillimetre distance from the applicator. Ongoing efforts in our laboratory are geared towards implementation of software to gain access to MRI data in real time and the integration of feedback control algorithms with the reported MRI-hyperthermia system, to facilitate delivery of prescribed experimental thermal doses.
Disclosure statement
No potential conflict of interest was reported by the authors.
Additional information
Funding
References
- Dewhirst MW, Vujaskovic Z, Jones E, Thrall D. (2005). Re-setting the biologic rationale for thermal therapy. Int J Hyperthermia 21:779–90.
- Koning GA, Eggermont AMM, Lindner LH, ten Hagen TLM. (2010). Hyperthermia and thermosensitive liposomes for improved delivery of chemotherapeutic drugs to solid tumors. Pharm Res 27:1750–4.
- Li L, ten Hagen TLM, Hossann M, et al. (2013). Mild hyperthermia triggered doxorubicin release from optimized stealth thermosensitive liposomes improves intratumoral drug delivery and efficacy. J Control Release Soc 168:142–50.
- Gasselhuber A, Dreher MR, Partanen A, et al. (2012). Targeted drug delivery by high intensity focused ultrasound mediated hyperthermia combined with temperature-sensitive liposomes: computational modelling and preliminary in vivovalidation. Int J Hyperthermia 28:337–48.
- Partanen A, Yarmolenko PS, Viitala A, et al. (2012). Mild hyperthermia with magnetic resonance-guided high-intensity focused ultrasound for applications in drug delivery. Int J Hyperthermia 28:320–36.
- Saxena V, Johnson CG, Negussie AH, et al. (2015). Temperature-sensitive liposome-mediated delivery of thrombolytic agents. Int J Hyperthermia 31:67–73.
- Wardlow R, Bing C, VanOsdol J, et al. (2016). Targeted antibiotic delivery using low temperature-sensitive liposomes and magnetic resonance-guided high-intensity focused ultrasound hyperthermia. Int J Hyperthermia 32:254–64.
- Calderwood SK. (2003). Hyperthermia, the tumor microenvironment and immunity. In: Keisari Y, ed. Tumor ablation. The Netherlands: Springer, 29–37.
- Multhoff G, Habl G, Combs SE. (2016). Rationale of hyperthermia for radio(chemo)therapy and immune responses in patients with bladder cancer: biological concepts, clinical data, interdisciplinary treatment decisions and biological tumour imaging. Int J Hyperthermia 32:455–63.
- Ahmed M, Brace CL, Lee FT, Goldberg SN. (2011). Principles of and advances in percutaneous ablation. Radiology 258:351–69.
- Dewhirst MW, Lee CT, Ashcraft KA. (2016). The future of biology in driving the field of hyperthermia. Int J Hyperthermia 32:4–13.
- Ruggeri BA, Camp F, Miknyoczki S. (2014). Animal models of disease: pre-clinical animal models of cancer and their applications and utility in drug discovery. Biochem Pharmacol 87:150–61.
- van der Zee J, Peer-Valstar JN, Rietveld P, et al. (1998). Practical limitations of interstitial thermometry during deep hyperthermia. Int J Radiat Oncol Biol Phys 40:1205–12.
- Winter L, Oberacker E, Paul K, et al. (2016). Magnetic resonance thermometry: methodology, pitfalls and practical solutions. Int J Hyperthermia 32:63–75.
- Lewis MA, Staruch RM, Chopra R. (2015). Thermometry and ablation monitoring with ultrasound. Int J Hyperthermia 31:163–81.
- Fani F, Schena E, Saccomandi P, Silvestri S. (2014). CT-based thermometry: an overview. Int J Hyperthermia 30:219–27.
- Alberts DS, Peng YM, Chen HS, et al. (1980). Therapeutic synergism of hyperthermia-cis-platinum in a mouse tumor model. J Natl Cancer Inst 65:455–61.
- Kuroda M, Urano M, Reynolds R. (1997). Thermal enhancement of the effect of ifosfamide against a spontaneous murine fibrosarcoma, FSa-II. Int J Hyperth Off J Eur Soc Hyperthermic Oncol North Am Hyperth Group 13:125–31.
- Willerding L, Limmer S, Hossann M, et al. (2016). Method of hyperthermia and tumor size influence effectiveness of doxorubicin release from thermosensitive liposomes in experimental tumors. J Control Release 222:47–55.
- Chopra R, Curiel L, Staruch R, et al. (2009). An MRI-compatible system for focused ultrasound experiments in small animal models. Med Phys 36:1867–74.
- Novák P, Moros EG, Parry JJ, et al. (2005). Experience with a small animal hyperthermia ultrasound system (SAHUS): report on 83 tumours. Phys Med Biol 50:5127–39.
- Chen X, Novák P, Benson DG, Jr., et al. (2011). An alternating focused ultrasound system for thermal therapy studies in small animals. Med Phys 38:1877–87.
- Hijnen NM, Heijman E, Köhler MO, et al. (2012). Tumour hyperthermia and ablation in rats using a clinical MR-HIFU system equipped with a dedicated small animal set-up. Int J Hyperthermia 28:141–55.
- Hoogenboom M, van Amerongen MJ, Eikelenboom DC, et al. (2015). Development of a high-field MR-guided HIFU setup for thermal and mechanical ablation methods in small animals. J Ther Ultrasound 3:14.
- Fite BZ, Liu Y, Kruse DE, et al. (2012). Magnetic resonance thermometry at 7T for real-time monitoring and correction of ultrasound induced mild hyperthermia. PLoS One 7:e35509.
- Bing C, Nofiele J, Staruch R, et al. (2015). Localised hyperthermia in rodent models using an MRI-compatible high-intensity focused ultrasound system. Int J Hyperth Off J Eur Soc Hyperthermic Oncol North Am Hyperth Group 31:813–22.
- Togni P, Vrba J, Vannucci L. (2010). Microwave applicator for hyperthermia treatment on in vivo melanoma model. Med Biol Eng Comput 48:285–92.
- Salahi S, Maccarini PF, Rodrigues DB, et al. (2012). Miniature microwave applicator for murine bladder hyperthermia studies. Int J Hyperth Off J Eur Soc Hyperthermic Oncol North Am Hyperth Group 28:456–65.
- Winter L, Özerdem C, Hoffmann W, et al. (2013). Design and evaluation of a hybrid radiofrequency applicator for magnetic resonance imaging and RF induced hyperthermia: electromagnetic field simulations up to 14.0 tesla and proof-of-concept at 7.0 tesla. PLoS One 8:e61661.
- James JR, Gao Y, Soon VC, et al. (2010). Controlled radio-frequency hyperthermia using an MR scanner and simultaneous monitoring of temperature and therapy response by 1 H, 23 Na and 31 P magnetic resonance spectroscopy in subcutaneously implanted 9L-gliosarcoma. Int J Hyperthermia 26:79–90.
- Cernicanu A, Lepetit-Coiffe M, Roland J, et al. (2008). Validation of fast MR thermometry at 1.5 T with gradient-echo echo planar imaging sequences: phantom and clinical feasibility studies. NMR Biomed 21:849–58.
- Ramsay E, Mougenot C, Köhler M, et al. (2013). MR thermometry in the human prostate gland at 3.0T for transurethral ultrasound therapy. J Magn Reson Imaging 38:1564–71.
- Badea A, Johnson GA. (2013). Magnetic resonance microscopy. Stud Health Technol Inform 85:153–84.
- Morikawa S, Inubushi T, Kurumi Y, et al. (2002). MR-guided microwave thermocoagulation therapy of liver tumors: initial clinical experiences using a 0.5 T open MR system. J Magn Reson Imaging 16:576–83.
- Pauly KB, Diederich CJ, Rieke V, et al. (2006). Magnetic resonance-guided high-intensity ultrasound ablation of the prostate. Top Magn Reson Imaging 17:195–207.
- McWilliams BT, Schnell EE, Curto S, et al. (2015). A directional interstitial antenna for microwave tissue ablation: theoretical and experimental investigation. IEEE Trans Biomed Eng 62:2144–50.
- Rieke V, Vigen KK, Sommer G, et al. (2004). Referenceless PRF shift thermometry. Magn Reson Med 51:1223–31.
- Pisani LJ, Ross AB, Diederich CJ, et al. (2005). Effects of spatial and temporal resolution for MR image-guided thermal ablation of prostate with transurethral ultrasound. J Magn Reson Imaging 22:109–18.
- Balanis CA. (1989). Advanced engineering electromagnetics, vol. 20. New York: Wiley.
- Camelia G, Gabriel S, Grant EH, et al. (1998). Dielectric parameters relevant to microwave dielectric heating. Chem Soc Rev 27:213–23.
- Solazzo SA, Liu Z, Lobo SM, et al. (2005). Radiofrequency ablation: importance of background tissue electrical conductivity–an agar phantom and computer modeling study. Radiology 236:495–502.