
Abstract
There is little doubt that increases in thermal load beyond the thermo-neutral state prove progressively stressful to all living organisms. Increasing temperatures across the globe represent in some locales, and especially for outdoors workers, a significant source of such chronic load increase. However, increases in thermal load affect cognition as well as physical work activities. Such human cognition has perennially been viewed as the primary conduit through which to solve many of the iatrogenic challenges we now face. Yet, thermal stress degrades the power to think. Here, we advance and refine the isothermal description of such cognitive decrements, founded upon a synthesis of extant empirical evidence. We report a series of mathematical functions which describe task-specific patterns of performance deterioration, linking such degrees of decrement to the time/temperature conditions in which they occur. Further, we provide a simple, free software tool to support such calculations so that adverse thermal loads can be monitored, assessed and (where possible) mitigated to preserve healthy cognitive functioning.
Introduction
Allusions as to the effects of the thermal environment on behaviour go back to the earliest written tracts that we possess. Within the sacred writings of many cultures are references to diminishing response capacities, especially under heat stress. Formal scientific observations upon such influences can now be traced over some centuries [Citation1–3]. In the eighteenth century, for example, the exigencies of work in pottery firing kilns led to questions as to whether, and how long, workers could tolerate heat levels that exceeded natural resting human body temperature. Even some two and a half centuries ago, the issues of work efficiency and production capacity were to the forefront of concern [Citation4,Citation5]. The empirical question as to whether a worker could tolerate such conditions was answered in the affirmative. However, prolonged exposure could, and would, prove debilitating, dangerous and eventually fatal.
In the more modern era, the impact of thermal stress on cognitive performance has been a perennial matter of concern [Citation6,Citation7] specifically for those seeking to prevent occupational damage and injury [Citation8,Citation9]. This concern has also permeated military operations which, in today’s world, are frequently conducted in locations in which thermal stress is endemic [Citation10]. Such concerns persist and proliferate today. With the evident degree of global warming that we are currently experiencing, such concerns have only grown, with special concern for the particular case of outdoor workers. Although here we are concerned specifically with thermal effects on cognition, we certainly recognise that such influences have important impacts on emotional affect also. Such effects can well lead to greater levels of inter-personal violence and social disruption [Citation3]. Thus, the quantitative conclusions presented here are not solely of academic concern but, if corroborated by a more extensive analysis, they may be also of importance for many other practical aspects of human society.
Embedded within such an evolution in global trends, resides a fundamental transition in the nature of human work. While we still assert that physical effort remains a pivotal element of many human occupations, we want to affirm that much of human work now primarily features cognitive dimensions. Safe occupational threshold limit values (TLVs), which are reasonably established for physical and muscular demands thus may not protect against such adverse influences on cognition, which frequently proves more vulnerable to thermal threats [Citation11]. In essence, we are protecting against the vestigial aspects of work and not its predominant, modern incarnation. We have been on the forefront of championing safety directives predicated upon acknowledge behavioural thresholds [Citation12–14]. Indeed, this concern has been pointed out on numerous occasions, by a number of investigators and institutions [Citation15–17] that health and safety temperature exposure limits should be inferred primarily from behavioural responses, not solely from physiological effects alone. Despite this necessity, the designation of exposure limits founded on cognitive performance has proved somewhat problematic because of the multiple interacting factors that have to be taken into account. These include critical influences such as the type of task being undertaken, the exposure duration, but also the individual’s skill level and their state of acclimation to the stress [Citation18,Citation19]. In addition, there are propensities for large individual differences (IDs) in response to divergent thermal conditions. Indeed, we acknowledge that our present work still needs to be calibrated to such IDs, as we discuss later.
One key development in this battle for descriptive accuracy was the introduction and development by Ramsey and Morrissey [Citation20] of isodecrement curves. While most synthetic approaches [Citation21] have naturally focussed upon the upper limits of tolerance (see also [Citation22,Citation23]), isodecrement curves represent a key way to describe the full panoply of performance degradation. The isodecrement approach accomplishes this by providing a method to articulate the degree of change experienced in different tasks under differing thermal loads. This is a very useful conception and so we here explore and exploit the isodecrement framework to illustrate such a full picture of heat stress degradation as we currently understand it.
In the original report of Ramsey and Morrissey [Citation20], the experimental results available [Citation24] were used in order to develop a predictive model, differentiating two separate classes of task. These were (i) predominantly cognitive tasks and (ii) predominantly psycho-motor tasks. Thus, they took data from results reported in more than 20 bibliographic references and integrated them with data they themselves obtained at Texas Tech University. In their review procedure, those reports which gave performance data for perceptual motor skills as a function of thermal environment and exposure time were selected. Only performance data that were judged relevant, reputable and identifiable by environmental conditions were included in the data pool. For each of these two different task orders, a listing of constituent studies was prepared. These rendered specific data points in terms of performance change related to the exposure times and heat stress levels at which they occurred. Each specific data point represented in the task-performance summaries was valued as minus one (−1) or plus one (+1) depending on whether performance decrement or enhancement had been reported. A zero (0) was coded if no change had occurred. A full exposition of their original methodology and the work they relied on can be found in their original work [Citation20]. A step-wise, multiple regression was used to develop predictive equations for each task order, and the coefficients for those equations and their correlations were also calculated. Isodecrement curves, representing likelihood of impaired performance, were developed by setting each predictive equation equal to 0, −0.3, −0.5, −0.8 and −1.0, respectively, and then solving for the temperature and exposure times that represented the decrement level for each of the task categories. The zero contour (0.0) in this isodecrement space represented the conditions which induced no appreciable change. Minus one (−1) isodecrement curves represented the boundary for a definitively significant decrement in task performance over time by temperature level [Citation22,Citation25]. The region between each contour may be considered as representing an increasing likelihood of decrement in performance and may be calculated according to the contour value which is requested (e.g. setting the equations to −0.45). Ramsey and Morrissey [Citation20] reported their findings in the form of graphs but despite the importance of these visualisations, the usability of this approach was somewhat limited. Thus, our present work looks to achieve two specific ends. First, an updated and more fully articulated expression of the isodecrement picture: Here, we provide a set of mathematical functions which characterise each curve as well as explore the implications of this update. Second, we look to provide a simple, usable application which permits broad-spread deployment of this crucial information regarding the decrement in order to support the prevention of hazardous exposures.
Research methods
From the extant isodecrement curves, through the application of the specific free software package engauge digitiser [Citation26], we obtained a succession of points for each order of task as plotted in a Cartesian space of temperature (ordinate) and time (abscissa). These foundational points unequivocally characterised the original curves, providing an input to be used by different software applications. Then, we systematically evaluated which kind of function best fitted the successions of data points obtained, that is, linear, logarithmic, polynomial or exponential. We could thus identify the equations that provided the best fit in each case. Some of the original curves showed clearly differentiated regions, so various functions were needed to adequately describe them. Discrete points were obtained for each curve, in quantities sufficient to assure an unambiguous and comprehensive characterisation of the original curves. Also, the free software package Graph [Citation27] was used to examine the correlation between different mathematical functions and the set of points acquired for each curve so as to attain simple and usable equations which adequately characterised each.
Results
Temperature-time effects on mental performance
shows the graphical representation of points acquired for tasks which are predominantly mental in nature (e.g. coding, multiplication, mental arithmetic, etc.). thus presents the associated isodecrement curves from 0.0 (zero) to −0.8 for time/temperature combinations. The latter is expressed in values of Wet-Bulb, Globe Temperature (WBGT) [Citation28]. Superimposed upon this is a graphical representation of calculated functions in these intervals (dashed lines). The analysis carried out to find the mathematical functions which best fitted each curve on discarded exponential, linear and logarithmic functions. To find a satisfactory degree of correlation, a polynomial adjustment was required (see for a summary of equations and supplementary information for extensive information on these and following equations), from which no clear physical significance can yet be inferred. Bearing this in mind, we considered the possibility of dividing each curve into differing straight segments for their evaluation (solid lines, see for a summary of these equations).
Figure 1. Graphical representation of points acquired for mental task isodecrement curves and calculated functions in these intervals.
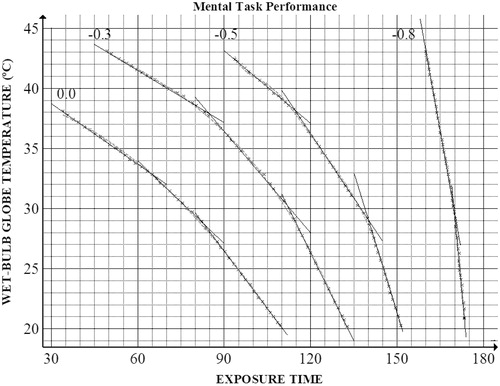
Table 1. Calculated functions for mental task isodecrement curves.
Table 2. Calculated straight segments representing 0.0, −0.3, −0.5 and −0.8 mental task isodecrement curves (from top to bottom: Line 1 to Line 3).
The graphical representation of points acquired for the zero isodecrement curve (adjusted to three straight segments) can be described as follows: Line 1 from (x = 33.58 min, y = 38.09 °C) to (x = 64.48 min, y = 32.93 °C), with a slope of −0.1676 °C/min; Line 2 from (x = 64.48 min, y = 32.93 °C) to (x = 83.13 min, y = 28.66 °C), with a slope of −0.2295 °C/min; and Line 3 from (x = 83.13 min, y = 28.66 °C) to (x = 109.34 min, y= 20.29 °C), with a slope of −0.3179 °C/min. According to this analysis, there exist three differentiable regions. The first region is defined by Line 1 which operates at relatively high temperatures (WBGT = 38.09–32.93 °C), for which changes in temperature (WBGT) have the largest effects on exposure time (slope equal to −0.1676 °C/min, maximum horizontality). In comparison, the region characterised by Line 3 (WBGT = 28.66–20.29 °C) operating at the more comfortable temperatures, for which changes in temperature (WBGT) have the smallest effects on exposure time (slope equal to −0.3179 °C/min, maximum verticality). Line 2 (WBGT = 32.93–28.66 °C) can be understood as the transitional zone between these two other regions. The effectiveness of dividing decrement contours into three regions is further discussed below.
A similar analysis was accomplished for −0.3, −0.5 and −0.8 isodecrement curves and gave analogous results (see ). In general, a comfortable region, where changes in temperature (WBGT) have little effect on permissible exposure time for a given probability of mental impairment stands in contrast to an extremely higher temperature region in which small changes in temperature (WBGT) have the more profound influence on exposure time for a given probability of mental impairment. It’s worth noting the systematic variation of slopes, increasing in absolute values from the isodecrement contours of zero (0.0) sequentially to −0.8 tending to verticality which indicates that higher probabilities of mental impairment are associated with longer exposure times. With respect to the near verticality of the −0.8 isodecrement curve, data should be handled with some caution until additional analysis can be carried out and integrated. However, it is possible that this order of performance is generally more vulnerable to decrement, perhaps depending less on stress itself.
Temperature-time effects on tracking performance
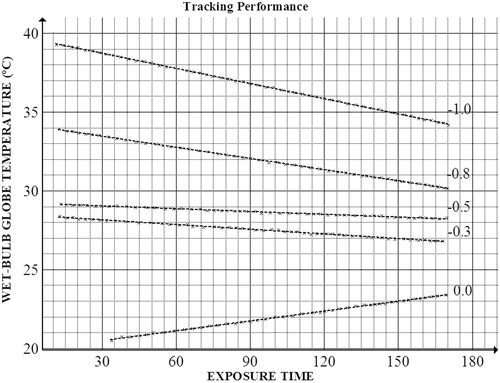
shows the graphical representation of points acquired for the isodecrement curves for tracking performance and the corresponding calculated functions. These data are also represented from 0.0 to −1.0. Significantly, the typology of these latter isodecrement curves changes dramatically compared to curves obtained for mental tasks (cf. vs. ). In fact, a perfect linearity seems to govern the probability of suffering impairment due to temperature-time effects during the realisation of tracking tasks [Citation13]. One point is especially noteworthy. Here, we see that the slope changes from a marginally positive value for the 0.0 isodecrement curve (i.e. 0.0208 °C/min), to negative values for all other identified curves, from (−0.0099 °C/min) for the −0.3 curve to (−0.032 °C/min) for the −1.0 isodecrement curve. Thus, the zero isodecrement curve, which represents time-temperature combinations for which no impairment is expected, apparently operates at the lowest temperatures (WBGT = 20.47 – 23.39 °C). This may be a veridical increase or it may be due to some minor variations in observed data, since the slope itself here is close to zero. In this scenario, WBGT values are sufficiently low for discomfort to be taken into account, so the lowest WBGT values are associated with the lowest exposure times (t) allowed for a certain probability of impairment. Alternatively, there may even be a marginal thermal advantage in the longer duration and such heat exposure conditions as the individual becomes exposed to forms of thermal facilitation [Citation29]. In direct contrast, the −1.0 isodecrement curve here, which represents time-temperature combinations for which an absolute certainty of tracking impairment is expected, operates at the highest temperatures (WBGT), far from the comfort zone, in a region where little increments in temperature creates much more notable effects on reducing safe exposure time (t).
Figure 2. Graphical representation of points acquired for tracking performance isodecrement curves and calculated functions.
Temperature-time effects on reaction (response) time
shows the graphical representation of points acquired for reaction (response) time isodecrement curves, from 0.0 to −1.0 (we use reaction/response time relatively interchangeably here but recognise that they do possess discrete and separable definitions in certain relevant literatures in which response time also involves muscular/physical movement). Superimposed are also presented the calculated functions (dashed lines). Similarly to the results obtained for predominantly mental tasks, our analysis discarded exponential, linear and logarithmic functions in all cases except for the 0.0 and −1.0 isodecrement curves. In these latter cases, an accurate linear adjust was possible. For the other curves (−0.3, −0.5 and −0.8) a polynomial adjustment can be performed in order to establish a satisfactory degree of correlation. Thus, we proceeded to evaluate each curve by dividing them into a number of straight segments (solid lines).
Figure 3. Graphical representation of points acquired for reaction time isodecrement curves and calculated functions.
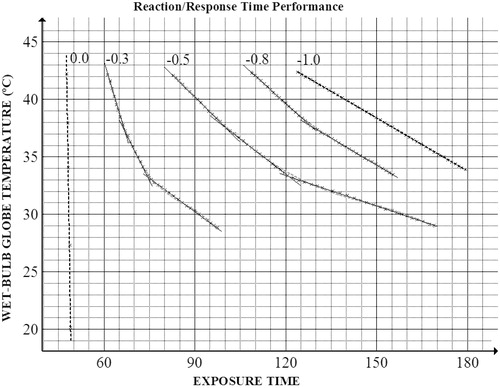
We were able to adjust the graphical representation of points acquired for −0.3 isodecrement curve, adjusted to three straight segments which can be described as follows: Line 1 from (x = 61.16 min, y = 42.14 °C) to (x = 66.68 min, y = 37.41 °C), with a slope of −0.8853 °C/min. Line 2 from (x = 66.68 min, y = 37.41 °C) to (x = 74.49 min, y = 33.22 °C), with a slope of −0.5278 °C/min; and Line 3 from (x = 74.49 min, y = 33.22 °C) to (x = 97.22 min, y = 28.88 °C), with a slope of −0.1942 °C/min. Again, we can identify these three differentiated regions for this curve, the first one being defined by Line 1 which operates at relatively high temperatures (WBGT= 42.14–37.41 °C), for which changes in temperature (WBGT) have relatively small effects on exposure time (slope equal to −0.8853 °C/min, maximum verticality). On the opposite end is the region described by Line 3 (WBGT = 33.22–28.88 °C) operating at the more comfortable temperatures, for which changes in WBGT have major effects on exposure time (slope equal to −0.1942 °C/min, maximum horizontality). Line 2 (WBGT = 37.41–33.22 °C) again represents a transition region. A similar analysis for −0.5 and −0.8 isodecrement curves gave analogous regional differentiation, in general where changes in temperature (WBGT) have a more profound influence on exposure time is in the comfortable region (Line 3 for −0.3 and −0.5 curves and Line 2 for −0.8 curve). At the highest WBGT values region (Line 1 for −0.3, −0.5 and −0.8 curves), changes in WBGT have the smallest influence on exposure time for a given probability of reaction (response) time impairment. Notably, these curves evolve in the opposite direction to those evident in purely mental transformations (cf. ).
Temperature-time effects on vigilance and sustained attention
shows the graphical representation of points acquired to identify the isodecrement curves for vigilance tasks [Citation30] and of calculated functions superimposed (dashed lines). A polynomial adjustment was applicable in all cases, except for the 0.0 isodecrement curve. This enables us to find a satisfactory degree of correlation. Exponential, linear and logarithmic functions were thus discarded as unsatisfactorily representing the −0.3, −0.5, −0.8 and −1.0 isodecrement curves. Accordingly, in order to elucidate possibly unnoticed implications relating to these curves, we evaluated each of them by their subdivision into respective straight segments (solid lines).
Figure 4. Graphical representation of points acquired for vigilance tasks isodecrement curves and calculated functions.
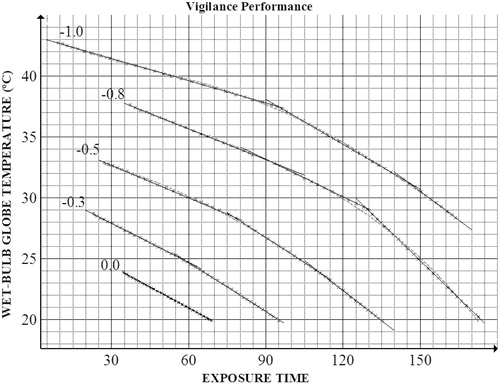
The graphical representation of points acquired for −0.3 isodecrement curve, resulted in two straight segments (). These two lines can be described as follows: Line 1 from (x = 22.99 min, y = 28.71 °C) to (x = 59.14 min, y = 24.78 °C), with a slope of −0.1068 °C/min and Line 2 from (x = 59.14 min, y = 24.78 °C) to (x = 95.07 min, y = 19.92 °C), with a slope of −0.1338 °C/min. In the burgeoning description, the −0.5, −0.8 and −1.0 isodecrement curves can be represented by three straight segments for each of these two thresholds. Thus, for example, the graphical representation of points acquired for −0.5 isodecrement curve, perfectly adjusts to three straight segments and can be described as follows: Line 1 from (x = 27.11 min, y = 32.90 °C) to (x = 77.65 min, y = 28.42 °C), with a slope of −0.089 °C/min; Line 2 from (x = 77.65 min, y= 28.42 °C) to (x = 110.23 min, y = 23.98 °C), with a slope of −0.1364 °C/min; and Line 3 from (x = 110.23 min, y = 23.98 °C) to (x = 135.13 min, y = 19.86 °C), with a slope of −0.1648 °C/min. A similar typology is evident across mental tasks () and vigilance tasks isodecrement curves (). It is, at present, reasonable to suggest that parallel conclusions can be postulated: It is in the region of high temperatures where changes in WBGT have the more prominent effects on exposure time. On the opposite is the region of more comfortable temperatures, for which changes in temperature (WBGT) have little effect on exposure time. It is of interest to note that the zero isodecrement curve is represented by one single line relationship here. This is perhaps related to the well-known phenomenon of the baseline “vigilance decrement” [Citation31,Citation32].
Temperature-time effects on complex tasks
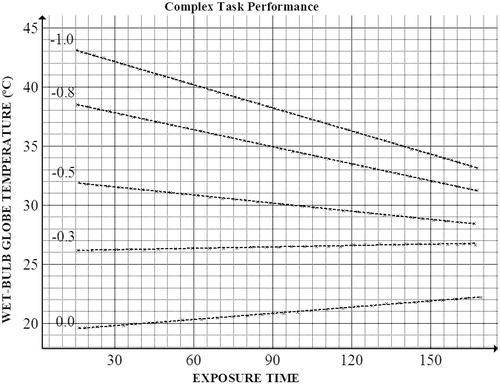
shows the graphical representation of points acquired for complex task performance isodecrement curves, from 0.0 to −1.0, and of calculated functions (dashed lines). Here, complex refers to multi-tasking in which the individual is asked to do two or more combined perceptual and motor tasks at the same time. The typology of these latter curves is very similar to that obtained for the tracking performance isodecrement curves. Thus, linearity seems to govern the probability to suffer impairment due to temperature-time effects during the realisation of these complex tasks. The evolution of the slopes, from positive values for the 0.0 (0.0174 °C/min) and −0.3 (0.0039 °C/min) isodecrement curves, to gradually more negative values for the other curves, from (−0.0229 °C/min) for the −0.5 curve to (−0.0652 °C/min) for the −1.0 curve, is also a pattern that is analogous to that found for tracking performance isodecrement curves and thus, again, similar conclusions can potentially be inferred. The 0.0 and −0.3 isodecrement curves operate at the lowest temperatures (WBGT = 19.60 – 26.63 °C), at T values low enough for discomfort to be taken into account. Therefore, the lowest WBGT values are related to the lowest exposure times (t) allowed for a certain probability of associated impairment. In contrast, the −1.0 isodecrement curve is operating in the region of the highest WBGT values, where increments in T naturally exert the more substantive effects on reduction of exposure time (t).
Figure 5. Graphical representation of points acquired for complex task performance isodecrement curves and calculated functions.
Temperature-time effects on combined mental and reaction time performance
shows the graphical representation of points specifically acquired for tasks combining mental and reaction (response) time isodecrement curves, and of calculated functions (dashed lines). The typology of these curves is comparable to that obtained for reaction time alone. Thus, as with the reaction (response) time example, our analysis here discarded the potential, exponential, linear and logarithmic functions in all cases, except for the −1.0 and −0.8 isodecrement curves, for which an accurate linear adjust proved to be possible.
Figure 6. Graphical representation of points acquired for conjoint mental and reaction time isodecrement curves and calculated functions.
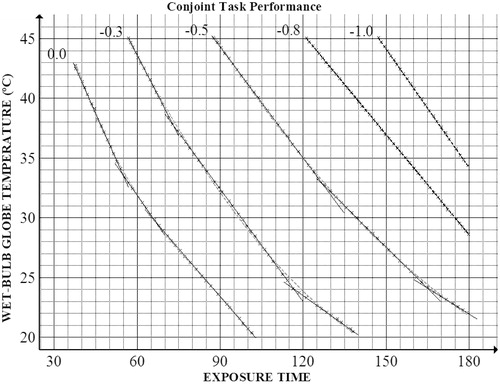
On the other hand, the 0.0, −0.3 and −0.5 isodecrement curves here were subdivided into componential straight segments (solid lines), establishing that there exist three differentiable regions. The first region is characterised by Line 1, which operates at the highest temperatures, for which changes in WBGT have the less significant effect on exposure time. At the opposite end is the region characterised by Line 3, at the more comfortable temperatures, for which changes in WBGT have the more significant effect on exposure time. Line 2 characterises the transition between them ().
Temperature-time effects on combined tracking, vigilance and complex tasks
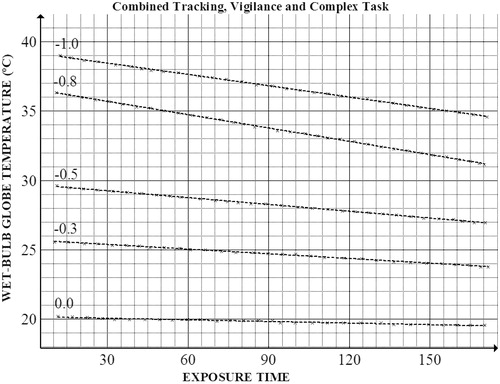
With respect to the final aspect of the present results, shows the graphical representation of points acquired for combined tracking, vigilance and complex tasks performance isodecrement curves and of calculated functions (dashed lines). As it can be seen, a linear relationship governs the probability of suffering mental impairment due to temperature-time effects when tracking, vigilance and complex tasks are considered together. This typology is consistent with that obtained for tracking and complex tasks isodecrement curves on their own, as well as with the 0.0 and −0.3 vigilance tasks isodecrement curves.
Figure 7. Graphical representation of points acquired for combined tracking, vigilance and complex tasks performance isodecrement curves and calculated functions.
Discussion and conclusions
In the present work, the isodecrement curves have been evaluated by means of simple and usable mathematical functions and groups of functions which accurately characterise each curve. Thus, we have obtained quantitative data useful for an overall, global assessment of healthy cognitive functioning under thermal stress. We must again emphasise that these functions are nomothetic thresholds, and idiographic as IDs provide variability around these mean thresholds. According to our analysis, cognitive performance during the performance of mental tasks is expected to be more sensitive to WBGT variations in the region of high temperatures (≈32–38 °C) than in the region of more comfortable temperatures (≈20–28 °C). Information about the extension in which this occurs is given by the fine examination of changes in the values of slopes of segments describing each curve. Similar conclusions were obtained for vigilance tasks: it appears to be the region of high temperatures where changes in WBGT have the more prominent effects on exposure time, for the same probability of mental impairment [Citation30]. Somewhat in contrast, the behaviour expected for reaction time performance tasks, alone or in combination with other cognitive demands, appears to be more sensible to WBGT variations within the comfortable region, as changes in temperature (WBGT) show a more profound influence on exposure time in this region. This, for the same probability of mental impairment than in the region of high temperatures. On the other hand, a linear relationship governs the probability of suffering mental impairment due to temperature-time effects for tracking and complex tasks, and similarly this occurs for vigilance tasks also. This typology is also attained when tracking, vigilance and complex tasks are considered together. For these kinds of tasks, at the lowest temperatures (≈20–23 °C) discomfort because of cold occurs and positive slopes are attained, connecting the lowest WBGT values with the lowest exposure times for a certain probability of mental impairment. As temperature increases, the slopes tend toward even more negative values. This results in accentuated reductions of exposure time allowed for a given probability of mental impairment. This is a proof-of-concept for our present quantitative approach to take advantage of the full spectrum of empirical reports that have been published since Ramsey and Morrissey [Citation20] first offered their work. The availability of easy, practical and relevant mathematical functions which accurately describe these correlations would be of great utility for the development and implementation of prevention and control of hazard strategies.
Thermal stress remains an important and contemporary social issue. We know that people continue to work in operational environments that impose considerable thermal load, and more and more we are seeing that such tasks have an ever greater cognitive component. While we have registered the benefits of introducing environmental controls (i.e. heating and air-conditioning) into work environments that feature cognition, such engineering controls are not always possible. And in the background persists the growing spectra of iatrogenic global warming. The costs of energy may make the sustenance of thermo-neutral conditions ever more prohibitive. Given that human cognition is often touted as the primary way in which such persuasive problems will be solved, understanding how elements of cognition deteriorate under thermal stress can well prove of critical importance. Using the isothermal decrement contour framework, now pioneered some four decades ago, we sought to provide such information here.
Acknowledgments
The authors would like to explicitly acknowledge the fecund conception of Jerry Ramsey and Steve Morrissey. The authors have built upon their seminal framework here and seek to advance this notion in the present and future submissions.
Disclosure statement
The authors report no conflicts of interest.
References
- Ellis H. (1758). An account of the heat of the weather in Georgia. Philos T Roy Soc 50:754–6.
- Montesquieu C. (1748). The spirit of the laws. New York: Cambridge University Press.
- Anderson CA. (2001). Heat and violence. Curr Dir Psychol Sci 10:33–8.
- Blagden C. (1775). Experiments and observations in a heated room. Philos T Roy Soc 65:111–23.
- Blagden C. (1775). Further experiments and observations in an heated room. Philos T Roy Soc 65:484–94.
- Liu K, Li B, Qian S, et al. (2015). Altered interhemispheric resting state functional connectivity during passive hyperthermia. Int J Hyperthermia 31:840–9.
- Wetsel W. (2011). Hyperthermic effects on behavior. Int J Hyperthermia 27:353–73.
- NIOSH. (2016). Criteria for a recommended standard: occupational exposure to heat and hot environments. Edited by Jacklitsch B, Williams WJ, Musolin K, Coca A, Kim J-H, Turner N. Cincinnati, OH: U.S. Department of Health and Human Services, Centers for Disease Control and Prevention, National Institute for Occupational Safety and Health, DHHS (NIOSH) Publication 2016-106.
- NIOSH. (1972). Criteria for a recommended standard: Occupational exposure to hot environments. Cincinnati, OH: U.S. Department of Health, Education, and Welfare, Health Services and Mental Health Administration, National Institute for Occupational Safety and Health, DHEW (NIOSH) Publication No. HSM 72-10269.
- Hancock PA, Szalma JL. (Eds.) (2008). Performance under stress. Aldershot: Ashgate Publishing.
- Hancock PA, Ross JM, Szalma JL. (2007). A meta-analysis of performance response under thermal stressors. Hum Factors 49:851–77.
- Hancock PA. (1981). Heat stress impairment of mental performance: a revision of tolerance limits. Aviat Space Environ Med 52:177–80.
- Hancock PA. (1982). Task categorization and the limits of human performance in extreme heat. Aviat Space Environ Med 53:778–84.
- Hancock PA, Vasmatzidis I. (1998). Human occupational and performance limits under stress: The thermal environment as a prototypical example. Ergonomics 41:1169–91.
- Enander AE. (1989). Effects of thermal stress on human performance. Scand J Work Env Health 15:27–33.
- Enander AE, Hygge S. (1990). Thermal stress and human performance. Scand J Work Env Health 16:44–50.
- Hancock PA, Vercruyssen M. (1988). Limits of behavioral efficiency for workers in heat stress. Int J Ind Ergonom 3:149–58.
- Parsons KC. (2003). Human thermal environments. 2nd ed. London: Taylor & Francis.
- Pilcher JJ, Nadler E, Busch C. (2002). Effects of hot and cold temperature exposure on performance: a meta-analytic review. Ergonomics 45:682–98.
- Ramsey JD, Morrissey SJ. (1978). Isodecrement curves for task performance in hot environments . Appl Ergon 9:66–72.
- Hancock PA, Vasmatzidis I. (2003). Effects of heat stress on cognitive performance: the current state of knowledge. Int J Hyperthermia 19:355–72.
- Wing JF. (1965). Upper thermal tolerance limits for unimpaired mental performance. Aerosp Med 36:960–4.
- Wing JF. (1965). A review of the effects of high ambient temperature on mental performance. AMRL-TR-65-102. Dayton, OH: Aerospace Med Lab, WPAFB.
- Ramsey JD, Dayal D, Ghahramani B. (1975). Heat stress limits for the sedentary worker. Am Ind Hyg Assoc J 36:259–65.
- Hancock PA, Vasmatzidis I. (1999). On the behavioral basis for stress exposure limits: The foundational case of thermal stress. In: Karwowski W, Marras W, eds. The occupational ergonomics handbook. New York and Boca Raton, FL: CRC Press, 1707–1739.
- Mitchell M, Jędrzejewski-Szmek Z, Muftakhidinov B, et al. (2016). Available from: http://doi.org/10.5281/zenodo.597553.
- Johansen I. (2012). Graph. Available from: http://www.padowan.dk.
- Epstein Y, Moran DS. (2006). Thermal comfort and the heat stress indices. Ind Health 44:388–98.
- Hancock PA. (1983). The effect of an induced selective increase in head temperature upon performance of a simple mental task. Hum Factors 25:441–8.
- Hancock PA. (1986). Sustained attention under thermal stress. Psychol Bull 99:263–81.
- Hancock PA. (2013). In search of vigilance: the problem of iatrogenically created psychological phenomena. Am Psychol 68:97–109.
- Hancock PA. (2017). On the nature of vigilance. Hum Factors 59:35–43.