
Abstract
We report the development and optimisation of an assay for quantitating iron from iron oxide nanoparticles in biological matrices by using ferene-s, a chromogenic compound. The method is accurate, reliable and can be performed with basic equipment common to many laboratories making it convenient and inexpensive. The assay we have developed is suited for quantitation of iron in cell culture studies with iron oxide nanoparticles, which tend to manifest low levels of iron. The assay was validated with standard reference materials and with inductively coupled plasma-mass spectrometry (ICP-MS) to accurately measure iron concentrations ∼1 × 10⁻⁶ g in about 1 × 10⁶ cells (∼1 × 10⁻¹² g Fe per cell). The assay requires preparation and use of a working solution to which samples can be directly added without further processing. After overnight incubation, the absorbance can be measured with a standard UV/Vis spectrophotometer to provide iron concentration. Alternatively, for expedited processing, samples can be digested with concentrated nitric acid before addition to the working solution. Optimization studies demonstrated significant deviations accompany variable digestion times, highlighting the importance to ensure complete iron ion liberation from the nanoparticle or sample matrix to avoid underestimating iron concentration. When performed correctly, this method yields reliable iron ion concentration measurements to ∼2 × 10⁻⁶ M (1 × 10⁻⁷ g/ml sample).
Introduction
Iron oxide nanoparticles have established themselves as a useful tool for biomedical applications ranging from subcellular manipulation to whole body imaging, and treatment of anaemia and cancer [Citation1–12]. The importance of cell or tissue iron quantification to assess both efficacy and toxicity is readily apparent; however, the most reliable assays, for example inductively coupled plasma-mass spectrometry (ICP-MS), require specialised and costly equipment [Citation13–15]. Existing less costly and simple chemical assay methods have not been optimised or validated to quantify low levels of iron (<1 μg) that are typically recovered from tissue or cell culture systems mixed with iron oxide nanoparticles [Citation16]. Studies of cancer targeting [Citation17–22], magnetic hyperthermia [Citation17,Citation18,Citation23,Citation24], imaging [Citation8,Citation25], toxicology [Citation26], cell separation [Citation27] and stem cell tracking [Citation28,Citation29] would benefit significantly with development of a more accessible method to quantify iron from biological matrices that provides accuracy and precision comparable to ICP-MS, the current gold standard. Such an assay would enhance research progress and toxicity assessments, by enabling quantitative comparisons of cell-nanoparticle association that can be related to specific nanoparticle constructs or properties.
ICP-MS is often considered as the gold standard to measure iron primarily because of high sensitivity – detection limits to parts per trillion (nanogram per litre) are possible. This is a lower detection threshold than achievable with other spectroscopic techniques such as ICP-atomic emission spectroscopy (ICP-AES), graphite furnace-atomic absorption spectroscopy (GF-AAS) or flame atomic absorption spectroscopy (AAS) [Citation13,Citation15]. In addition to its high sensitivity, ICP-MS provides flexibility to detect multiple elements for simultaneous interrogation. To be fair, the detection limits possible with ICP-MS for iron quantification require specialised instrument configurations having octopole reaction cell/mass filter(s) to discriminate Fe from among the many possible polyatomic interferences; and, pristine sample preparation to avoid contamination with ubiquitous environmental Fe [Citation30]. Thus, ICP-MS and other sensitive mass spectrometry technologies, although superior in many ways, demand significant financial investment to acquire and maintain the instrumentation, and to develop and maintain dedicated facility infrastructure.
Colorimetric methods based upon absorption of light by a sample, that is ultraviolet/visible (UV/Vis) spectrophotometry, to quantify intracellular iron have long existed [Citation31–33]. Refinement continues to improve their sensitivity and accuracy [Citation34–36]. When bound to free iron ions, chelators such as the triazines absorb very strongly in the UV/Vis range, with molar absorptivity of ∼104 M−1 cm−1. Many chromogenic substrates such as bathophenanthroline sulfonate, ferrozine or ferene have been utilised for iron quantification in human serum or environmental samples [Citation31–33]. The colorimetric assay developed by Riemer et al. [Citation34] incorporates potassium permanganate-mediated digestion/oxidation and iron detection by ferrozine and is one of the most commonly employed methods for detecting cellular iron.
We report on the development of an optimised triazine-based colorimetric assay with ferene-s, a more sensitive chromogenic compound for iron detection. We introduce a simplified digestion procedure to ensure accuracy among varying experimental configurations, and validation of results with ICP-MS using reference standard materials. The assay presented is a simple, sensitive, robust and highly adaptable method of iron quantitation for a wide variety of cellular applications of iron oxide nanoparticles. It is capable to provide accurate iron ion concentration measurements to ∼2 × 10⁻⁶ M (1 × 10⁻⁷ g/ml sample).
Materials and methods
Iron standards and nanoparticles
All iron standards were prepared from a stock certified standard reference material (FeCl3, Iron Standard for ICP, 1000 ± 2 mg/l Fe in 2% nitric acid, Sigma-Aldrich, St. Louis, MO). Iron oxide nanoparticle formulations used in this study generally comprised iron oxide with a polysaccharide (dextran or starch) polymer as either coating material (core–shell nanoparticles) or as matrix (iron oxide crystallites in polymer matrix). Specifically, particles used were: 80 and 100 nm plain BNF-Starch and 100 nm plain BNF-Dextran particles (Bionized NanoFerrite, Micromod Partikeltechnologie GmbH, Rostock, Germany), 20 nm plain nanomag®-D-spio particles and 500 nm nanomag®-D-plain (dextran iron oxide composite particles, Micromod Partikeltechnologie GmbH, Rostock, Germany) and conjugated or unconjugated magnetic microbeads (Anti ErbB2 or Basic MicroBeads, Miltenyi Biotec Inc., Auburn, CA). BNF particles are core–shell particles with an iron oxide core (∼45 nm) comprising multiple iron oxide crystallites having parallelepiped shapes with long dimension of 15–20 nm [Citation20,Citation23,Citation37,Citation38] and a shell of starch or dextran. In contrast 20 nm nanomag®-D-spio particles comprise iron oxide crystals with diameters of 7–10 nm embedded in dextran matrix [Citation38,Citation39]. The nanoparticles were used as provided by manufacturers.
Nanoparticle loading into cells
Human prostate carcinoma DU145 cells (ATCC, Manassas, VA) were maintained and propagated according to the ATCC protocol. Cells were cultured at 37 °C and 5% CO2 in T-75 tissue culture flasks containing RPMI 1640 medium and 10% foetal bovine serum (Life Technologies, Carlsbad, CA). Exponentially growing cells were treated by adding iron oxide nanoparticles (50–150 μg/ml Fe) and sterile poly-L-lysine (PLL, 0.5–2.0 μg/ml; Sigma-Aldrich, St. Louis, MO) to the culture media. After 24 h, the flask was rinsed three times with Dulbecco’s phosphate buffered saline (PBS) to remove extracellular nanoparticles. Cells were detached by brief exposure to 0.25% trypsin-EDTA followed by resuspension in culture media. After centrifugation and two more washes with PBS the fully suspended cells were counted. Aliquots with equal number of cells were transferred to 1.5 ml microfuge tubes and frozen to −80 °C as cell pellets. To obtain cells with low, medium and high iron content, the concentration of 80 nm BNF-Starch particles was kept constant at 150 μg/ml while varying the concentrations of PLL (1, 1.5 and 2 μg/ml respectively).
Ferene-s assay
Ferrozine (3-(2-pyridyl)-5,6-diphenyl-1,2,4-triazine-4′,4″-disulfonic acid sodium salt) and ferene-s (3-(2-pyridyl)-5,6-di(2-furyl)-1,2,4-triazine-5′,5″-disulfonic acid disodium salt) were purchased (Sigma-Aldrich, St. Louis, MO). A detailed protocol with lists of materials and equipment for this assay is included in the Supplementary Materials and Methods. Briefly, the sample to be measured was directly added to a 1× working solution (5 mM ferene-s, 0.2 M L-ascorbic acid in 0.4 M ammonium acetate buffer, pH ∼4.3) in a total volume of 1 ml. The mixture was incubated at room temperature in the dark for ≥20 h. The absorbance was measured at 595 nm in a flat bottom standard 96-well plate (300 μl per well in triplicates) using SpectraMax-M5 plate reader (Molecular Devices Corporation, Sunnyvale, CA). FeCl3 iron standards were always included (0–4 μg/ml). Alternatively, the samples were digested first with concentrated nitric acid (100 μl) for 2 h at 70 °C. The digested samples were allowed to cool to room temperature before neutralisation with 10 N NaOH (160 μl). The 1× working solution (900 μl) was added to the neutralised sample (100 μl). After 30 min at room temperature the absorbance was measured at 595 nm in a flat bottom standard 96-well plate (300 μl per well in triplicates).
For comparison to the ferrozine assay, the 1× working solution was prepared with 5 mM ferrozine instead of ferene-s and the absorbance was measured at 560 nm.
Kinetics of iron oxide nanoparticles in working solution of the ferene-s assay
Samples were added directly to 1× working solution (total volume of 1 ml). The absorbance was measured at 595 nm in a flat bottom standard 96-well plate (300 μl per well in triplicates) at 30 min intervals for up to 24 h. Absorbance readings for DU145 cells containing medium and high BNF-Starch concentrations were adjusted to reflect equivalent number of cells to that of cells with low Fe content.
Inductively coupled plasma-mass spectrometry (ICP-MS)
Frozen cell-nanoparticle samples were thawed at room temperature, and then prepared for ICP-MS using methods previously described [Citation25,Citation40]. Briefly, thawed samples were thermally digested in 50% nitric acid using a two stage ramp-to-temperature microwave method (MARS5 Xpress microwave, CEM Corporation, Matthews, NC). Digested samples were diluted for mass spectrometric evaluation and the total iron content of the samples was determined using an Agilent 7500ce ICP-MS (Agilent Technologies, Santa Clara, CA). An eight-point calibration curve was performed prior to sample analysis. At least three samples were analysed by ICP-MS for each cell preparation. The total iron content per cell was calculated, accounting for the number of cells provided as well as dilution factors, as the mean value for these samples.
Ferrozine assay (Riemer)
The assay was performed essentially as reported by Riemer et al. [Citation34]. Briefly, cell pellets were lysed with 300 μl of 50 mM NaOH for 2 h at room temperature with constant mixing using a rotary shaker. An equivalent volume (300 μl) of 10 mM HCl was then added followed by the addition of 300 μl of freshly prepared solution containing 2.25% KMnO4 and 0.7 M HCl. The samples were then transferred to a heat block and heated at 60 °C for 2 h. The heated samples were allowed to cool to room temperature before addition of 90 μl of freshly prepared iron detection solution (6.5 mM ferrozine in 1 M L-ascorbic acid and 2.5 M ammonium acetate). After 30 min, 280 μl aliquots of the samples were transferred to a well of a 96-well plate in triplicates and the absorbance at 550 nm was recorded. Iron oxide nanoparticles and FeCl3, iron standards (0–4 μg) were prepared similarly.
Modified protocol to correct for path length for 96-well plate readers
A fixed volume of 300 μl is used for each well, triplicate per sample, and a standard curve is included in each experiment. Readings of 96-well plates are dependent on both the concentration and the volume of the sample, thus each absorbance reading is converted to the total absorbance for the entire sample (by multiplying with the ratio of the total volume/volume of sample in the well). The total absorbance therefore depends only on the total amount of iron in the sample and not on the concentration. As shown in Supplementary Table S4 and the average slope of total net absorbance for Fe standards is about 1.7 absorbance units per μg of iron with 4.4% coefficient of variation. The total amount of iron in an unknown sample could therefore be determined by dividing the total absorbance units of the unknown by this slope.
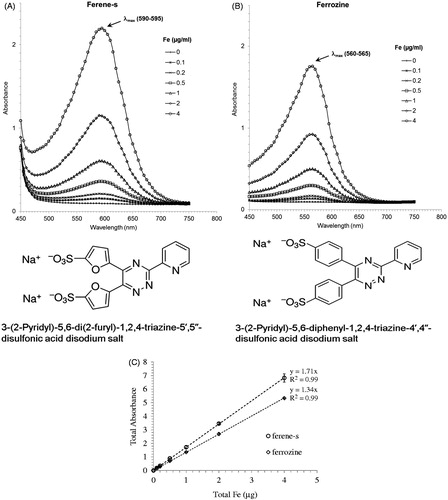
Figure 1. Comparison of the spectra of the iron standards (0–2 μg Fe+3) in working solution. Ferene-s (A), ferrozine (B), and the corresponding standard curves (0.1–4 μg Fe+3) measured at the peak absorbance for each compound (560 nm for ferrozine and 595 nm for ferene-s), (C).
Results
Comparison of ferene-s to ferrozine using Fe standards
We compared the most commonly used chromogenic iron-chelator ferrozine to ferene-s. Ferene-s is structurally similar to ferrozine () and it has been reported to have a higher molar absorptivity [Citation32,Citation41]. shows UV/Vis spectra of ferrozine (A) and ferene-s (B) for FeCl3 standards ranging from 0 to 2 μg in a final volume of 1 ml. shows the standard curves for both compounds measured at the peak absorbance for each compound (560 nm for ferrozine and 595 nm for ferene-s). The assay developed uses a 96-well plate format to measure optical density based on volumes of 300 μl per well. To obtain accurate estimates of the molar absorptivity of the two compounds we measured the absorbance using a standard 1 ml cuvette (see Supplementary Table S1). The calculated mean molar absorptivity ± SD obtained was 27 626 ± 523 M−1 cm−1 for ferrozine and 35 194 ± 831 M−1 cm−1 for ferene-s. These values are similar to the reported reference values [Citation41–44]. The molar absorptivity of ferene-s is about 28% higher than that of ferrozine. Therefore, ferene-s was chosen as the iron chelator for the assay development.
Comparison of ferene-s assay to ICP-MS
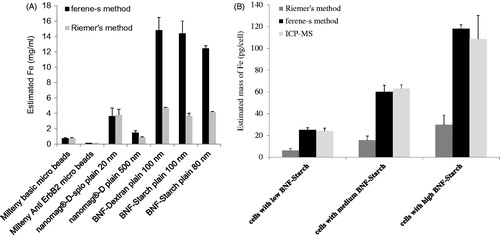
To validate results obtained from the ferene-s assay, we compared with results obtained from ICP-MS for several commercially available iron oxide nanoparticles. The measured iron contents of the four different formulations of nanoparticles are shown in . The values obtained by ferene-s assay are similar to those obtained by ICP-MS. We also compared the intracellular iron concentration for one of these nanoparticles (BNF-Starch) that were determined with both methods. The mean ± SD of iron in BNF-Starch loaded DU145 cells was (44.3 ± 5.0) × 10−12 g/cell with ferene-s assay and (45.5 ± 14.6) × 10−12 g/cell for ICP-MS ().
Table 1. Iron concentrations obtained from various iron oxide nanoparticles.
Kinetics of iron oxide nanoparticles in working solution of the ferene-s assay
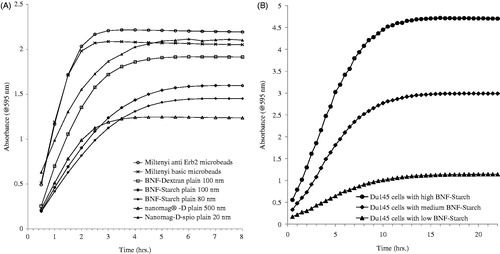
The formation of iron ferene-s complex (Fe2+: ferene-s) in the working solution is rapid for FeCl3 standards (<30 min at room temperature, Supplementary Figure S1). Once formed, the complex is stable (at least 1 week, Supplementary Table S6). We note, however, that with other sample matrices the formation of iron ferene-s complex can be slow depending on the formulation of nanoparticles or their intracellular location. The kinetics of complex formation obtained for several different nanoparticles is shown in . The saturation time for the absorbance readings differed among the formulations; however, by about 8 h they had all achieved a constant value. The kinetics of complex formation for intracellular BNF-Starch was still slower as shown in reaching a constant value at ∼20 h.
Figure 2. Time course of absorbance at 595 nm for ferene-s assay in working solution. Iron oxide nanoparticles with various formulations (A) and intracellular BNF-Starch iron oxide nanoparticles (B), DU145 cells with low, medium and high Fe content). Absorbance readings are adjusted to reflect equivalent number of cells.
Digestion with acid
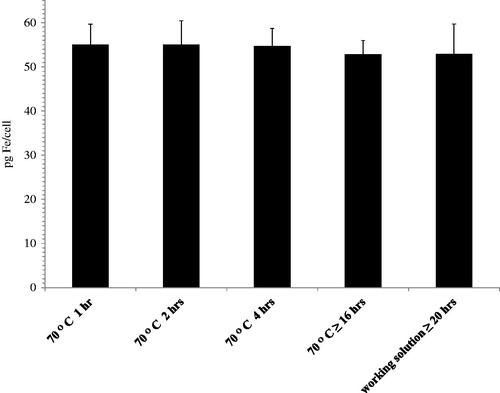
Intracellular iron can be released more rapidly by digestion with concentrated nitric acid. shows the results obtained from DU145 cells loaded with medium BNF-Starch concentration after digestion with concentrated nitric acid for varying times at 70 °C. As shown in , a 1-h digestion was sufficient to yield constant values of measured iron, implying that liberation of the intracellular iron with longer digestion times of up to and over 16 h did not yield additional significant differences of measured iron concentrations.
Figure 3. Digestion with concentrated nitric acid. Intracellular BNF-Starch iron oxide nanoparticles digested at various times at 70 °C prior to addition to the working solution.
Comparison to Riemer’s method
We next compared results obtained from the ferene-s assay of nanoparticle iron quantification to results obtained using the method presented by Riemer et al. [Citation34], one of the most common methods used for these measurements. Measured iron content obtained using Riemer’s method is significantly lower than the iron concentrations measured by the ferene-s method for all formulations comprising core–shell particles (). Interestingly, dextran matrix formulations – Miltenyi beads and nanomag®-D-spio particles – yielded similar measured iron values between the two methods. When comparing iron concentration measured from cells that internalised BNF-Starch nanoparticles, we find again the intracellular iron measurements obtained using Riemer’s method are significantly lower than those obtained using ferene-s or ICP-MS (). Between them, ICP-MS and ferene-s yielded consistent results.
Figure 4. Comparison with Riemer’s method. Iron oxide nanoparticles with various formulations (A) and intracellular BNF-Starch iron oxide nanoparticles (B). Identical samples for each formulation of nanoparticles or DU145 cells loaded with BNF-Starch were prepared in duplicates.
Modified protocol to correct for path length for 96-well plate readers
Results of comparing iron concentration measurements obtained from 96-well plate reader are shown in Supplementary Table S4 and . The average slope of total net absorbance for Fe standards is about 1.7 absorbance units per μg of iron with 4.4% coefficient of variation. The total amount of iron in an unknown sample could be determined by dividing the total absorbance units of the unknown by this slope. The slope of Fe standard curves is highly reproducible and reliable when performed in this manner. Supplementary Table S7 shows the results from five experiments performed on different days with the mean ± SD of 1.71 ± 0.06 (3.3% CV).
Discussion
Applications of iron oxide nanoparticles include many examples in biology and medicine. Characterization of their effects on biological processes, including toxicity, in cell culture model systems requires accurate determination of nanoparticle, that is iron ion concentration to evaluate concentration-dependent effects. For imaging and hyperthermia, accurate iron quantification in the cell or biological sample material is required to correctly interpret the translational implications of dose–response effects. Many methods are available to characterise iron concentrations, however the most reliable and accurate methods require expensive equipment and elaborate sample preparation protocols. Thus, accurate and reliable iron concentration measurements are inaccessible to researchers who lack the necessary infrastructure and equipment. In this report we described the development of a simple, rapid, low-cost and reliable method to quantify iron ion concentration in samples containing iron oxide nanoparticles. We have optimised the assay for use with various formulations of iron oxide nanoparticles as well as their intracellular concentration. Furthermore, the assay is validated by comparison with standard reference materials and ICP-MS.
Colorimetric methods utilising chromogenic compounds such as ferrozine or ferene to assay iron concentrations are among the most widely used and are commercially available. They are generally optimised for use in either clinical or environmental applications [Citation26,Citation33,Citation36,Citation41–45]. A common feature of nearly all spectrophotometer-based methods of iron mass quantitation is an initial iron ion liberation (“digestion”) process that separates individual iron ions from the biological or environmental sample matrices. A reducing agent is then used to convert the ferric (Fe3+) iron in the sample to ferrous, Fe2+, iron. The measured concentration of iron in the sample will be inaccurate and typically underestimated if any iron in the sample remains bound to the matrix material, or remains in the trivalent state (typically the result of vigorous digestion of sample with corrosive agents).
Spectrometric techniques, such as ICP-MS or ICP-AES, are typically sensitive and require no reduction of the iron ions after their liberation. On the other hand, sample preparation and instrument configuration can negate the high sensitivity by failing to resolve differences with sample components or other contaminants. Furthermore, equipment costs and infrastructure demands make acquisition and maintenance of ICP-MS equipment prohibitive thus limiting access for many research laboratories.
With the simplified method reported here, which requires reagents and a UV/Vis spectrophotometer, we describe the preparation of a working solution to which samples can be directly added; and, after thorough mixing the solution is incubated at room temperature overnight. The working solution comprises a 0.2 M acetate buffer at ∼pH 4.3 and 0.2 M ascorbic acid acting as the reducing agent. Given adequate time this acidic solution is sufficient to liberate iron ions from the nanoparticles and the sample matrix. Complete liberation of iron ions depends upon the nanoparticle formulation, nanoparticle coating(s), and other sample details. It is worth noting that selection of nanoparticles for the present study was limited to a subset of commercially available nanoparticle constructs comprising iron oxide and dextran or starch coatings or matrices for development of methodology and validation. Such constructs have demonstrated widespread utility in biomedical research and clinical applications. All possible and available nanoparticles having similar composition; however, were not tested but methods described can be used. Iron oxide nanoparticles comprising inorganic coatings or matrices, for example SiO2, Au, Zn, etc., were not tested in the present study. Such particle constructs may require modified digestion reagents and time. In such cases; however, the methods described herein for measurement of liberated iron ion concentrations following appropriate digestion may still be used.
For the described samples containing cell matrices, the time needed to achieve complete iron ion liberation also depends upon location of nanoparticles outside or within intracellular compartments or organelles of the cell. Absorbance readings measured from the Miltenyi microbeads became constant within ∼3 h after addition to the working solution. This was approximately half the time needed for BNF-Starch particles (). We may consider that such differences of digestion time may be due to the aggregated (BNF) vs. dispersed iron oxide crystallite (Miltenyi beads) configurations of the nanoparticle constructs. Further investigation, however is needed to determine the cause of the difference in digestion times. When associated with cellular material, however the BNF-Starch particles required >12 h to achieve constant values (). FeCl3 used as standard reached saturation in fewer than 30 min (Supplementary Figure S1) suggesting that reduction of Fe3+ to Fe2+ by ascorbic acid is not the limiting factor. Instead, liberation of iron ions from within the nanoparticle or sample matrix appears to vary significantly. For faster processing, the samples can be digested with concentrated nitric acid prior to addition to the working solution. As shown in , a 1-h digestion with acid at ∼70 °C was sufficient for complete release of iron from intracellular BNF-Starch nanoparticles. When using nitric acid to effect sample digestions, it is important to neutralise the digested sample solution with base, for example NaOH, in order to maintain pH = 3–6 before adding to the working solution [Citation32].
The method described by Riemer et al. [Citation34] utilises a potassium permanganate and HCl mixture to effect sample digestion (2 h incubation at 60 °C). Comparison of results obtained by the ferene-s and Riemer methods in demonstrates that the latter method may significantly underestimate the iron concentration depending upon the nanoparticle construct under study. Thus, caution should be exercised when interpreting results obtained by Riemer’s method for iron oxide nanoparticles. When compared against ICP-MS (see ), the consistency between the ferene-s and ICP-MS values implies that the lower iron concentration obtained using Riemer’s method may be due to incomplete iron ion liberation. With this method, longer digestion times or digestion by a concentrated acid may be necessary to avoid underestimating iron content in the sample. Further, absent a validation with an orthogonal and sensitive methodology, that is ICP-MS, it is recommended to evaluate concentration measurements using Riemer’s method following an analysis of results obtained from a time- and concentration-dependent study matrix to identify the optimal digestion and sample preparation procedure(s). On the other hand, the ferene-s procedure described above demonstrates consistent iron ion concentration measurements as validated by comparison with ICP-MS for several different iron oxide nanoparticles and cell-internalised BNF-Starch nanoparticles (see ).
To develop our assay, the chromogenic compound ferene-s was chosen because its higher molar absorptivity compared to ferrozine (, Supplementary Table S1). The molar absorptivity was calculated from the Beer–Lambert law: A=ɛlc; where A is the absorbance, ɛ is the molar absorptivity, l is the path length and c is the concentration of the sample. When using a standard UV/Vis cuvette (usually with a fixed path length of 1 cm) the light passes through the sample horizontally and is therefore independent of the sample volume. The ferene-s assay protocol reported here uses a 96-well plate format for absorbance readings to facilitate high throughput processing. It is important to note however that microplate readers use a vertical light path and the distance for light to travel through the sample depends on the sample volume. To compare the absorbance readings between standard 1-ml UV/Vis cuvettes and 96-well plates we performed four independent experiments with iron standards ranging in concentration from 0 to 4.0 μg Fe/ml. In each experiment the same sample was used for both readings. The results are shown in Supplementary Tables S3 and S4. Absorbance readings were about 20% lower when measured with 96-well plates. This is expected because the approximate height of the 300 μl solution in each well is ∼0.88 cm. When adjusted to a height of 1 cm the readings remained about 8–9% lower than when measured with 1-ml cuvettes. The plate reader used for our absorbance measurements incorporates a path-check option in its software which automatically adjusts the absorbance readings to match the readings from a 1-ml cuvette. When using this option the absorbance readings from the 96-well plates were similar to those obtained using a 1-ml cuvette (compare Supplementary Tables S3 and S5).
If available, the use of this option in the UV/Vis spectrophotometer enables more consistent results. This option however may be unavailable with some models of plate readers therefore a modified method is needed to obtain consistency among experimental values. We described a procedure to account for variations of path length that employs use of the slope of absorbance calibration curve obtained from the reference standard solutions, to yield reproducible and reliable measurements.
Conclusion
We present a detailed protocol for iron concentration determination using a ferene-s assay. The results were obtained from several iron oxide nanoparticle constructs used for biomedical applications. We also present results of iron concentration measurements obtained from cell culture comparing three methods to demonstrate that, depending upon method chosen, sample digestion may yield unreliable results. The ferene-s method developed was validated against ICP-MS demonstrating reproducible measurements of Fe concentrations to ∼2 × 10⁻⁶ M (1 × 10⁻⁷ g/ml sample). The reliability and convenience of the ferene-s protocol demonstrated can facilitate rapid and accurate iron oxide nanoparticle concentration measurements for a range of biological and toxicological experiments utilising cell culture models.
Supplemental File
Download PDF (474.4 KB)Disclosure statement
Dr. Cordula Gruettner is an employee of micromod Partikeltechnologie, GmbH, manufacturer of BNF and nanomag®-D-spio particles used in the studies. Dr. Robert Ivkov is an inventor on several issued and pending patents. All patents are assigned to Johns Hopkins University or Aduro Biotech, Inc. All other authors declare no competing interests.
Additional information
Funding
Related Research Data
References
- Gupta AK, Gupta M. (2005). Synthesis and surface engineering of iron oxide nanoparticles for biomedical applications. Biomaterials 26:3995–4021.
- Johannsen M, Gneveckow U, Eckelt L, et al. (2005). Clinical hyperthermia of prostate cancer using magnetic nanoparticles: presentation of a new interstitial technique. Int J Hyperther 21:637–47.
- Lee H-Y, Li Z, Chen K, et al. (2008). PET/MRI dual-modality tumor imaging using arginine-glycine-aspartic (RGD)–conjugated radiolabeled iron oxide nanoparticles. J Nucl Med 49:1371–9.
- Huang H, Delikanli S, Zen H, et al. (2010). Remote control of ion channels and neurons through magnetic-field heating of nanoparticles. Nat Nanotechnol 5:602–6.
- Maier-Hauff K, Ulrich F, Nestler D, et al. (2011). Efficacy and safety of intratumoral thermotherapy using magnetic iron-oxide nanoparticles combined with external beam radiotherapy on patients with recurrent glioblastoma multiforme. J Neurooncol 103:317–24.
- McCormack PL. (2012). Ferumoxytol: in iron deficiency anaemia in adults with chronic kidney disease. Drugs 72:2013–22.
- Kirschbaum K, Sonner JK, Zeller MW, et al. (2016). In vivo nanoparticle imaging of innate immune cells can serve as a marker of disease severity in a model of multiple sclerosis. Proc Nat Acad Sci 113:13227–32.
- Liu Y, Yang Y, Zhang C. (2013). A concise review of magnetic resonance molecular imaging of tumor angiogenesis by targeting integrin αvβ3 with magnetic probes. Int J Nanomed 8:1083–93.
- Xu C, Sun S. (2013). New forms of superparamagnetic nanoparticles for biomedical applications. Adv Drug Deliv Rev 65:732–43.
- Bullivant JP, Zhao S, Willenberg BJ, et al. (2013). Materials characterization of Feraheme/Ferumoxytol and preliminary evaluation of its potential for magnetic fluid hyperthermia. Int J Mol Sci 14:17501–10.
- Marchal S, El Hor A, Millard M, et al. (2015). Anticancer drug delivery: an update on clinically applied nanotherapeutics. Drugs 75:1601–11.
- Bashir MR, Bhatti L, Marin D, Nelson RC. (2015). Emerging applications for ferumoxytol as a contrast agent in MRI. J Magn Reson Imaging 41:884–98.
- Jenner GA, Longerich HP, Jackson SE, Fryer BJ. (1990). ICP-MS—a powerful tool for high-precision trace-element analysis in earth sciences: evidence from analysis of selected USGS reference samples. Chem Geol 83:133–48.
- Elsaesser A, Taylor A, de Yanés, et al. (2010). Quantification of nanoparticle uptake by cells using microscopical and analytical techniques. Nanomedicine 5:1447–57.
- Patil US, Adireddy S, Jaiswal A, et al. (2015). In vitro/in vivo toxicity evaluation and quantification of iron oxide nanoparticles. Int J Mol Sci 16:24417–50.
- Rimkus G, Bremer-Streck S, Grüttner C, et al. (2011). Can we accurately quantify nanoparticle associated proteins when constructing high-affinity MRI molecular imaging probes? Contrast Media Mol Imaging 6:119–25.
- DeNardo SJ, DeNardo GL, Miers LA, et al. (2005). Development of tumor targeting bioprobes (111In-Chimeric L6 monoclonal antibody nanoparticles) for alternating magnetic field cancer therapy. Clin Cancer Res 11:7087s–92s.
- DeNardo SJ, DeNardo GL, Natarajan A, et al. (2007). Thermal dosimetry predictive of efficacy of 111In-ChL6 nanoparticle AMF-induced thermoablative therapy for human breast cancer in mice. J Nucl Med 48:437–444.
- Natarajan A, Gruettner C, Ivkov R, et al. (2008). NanoFerrite particle based radioimmunonanoparticles: binding affinity and in vivo pharmacokinetics. Bioconjugate Chem 19:1211–18.
- Grüttner C, Müller K, Teller J, et al. (2007). Synthesis and antibody conjugation of magnetic nanoparticles with improved specific power absorption rates for alternating magnetic field cancer therapy. J Magn Mag Mat 311:181–6.
- Baiu DC, Artz NS, McElreath MR, et al. (2015). High specificity targeting and detection of human neuroblastoma using multifunctional anti-GD2 iron-oxide nanoparticles. Nanomedicine (Lond) 10:2973–88.
- Behnam Azad B, Banerjee SR, Pullambhatha M, et al. (2015). Evaluation of a PSMA-targeted BNF nanoparticle construct. Nanoscale 7:4432–42.
- Dennis CL, Jackson AJ, Borchers JA, et al. (2009). Nearly complete regression of tumors via collective behavior of magnetic nanoparticles in hyperthermia. Nanotechnology 20:395103.
- Laurent S, Dutz S, Häfeli UO, Mahmoudi M. (2011). Magnetic fluid hyperthermia: focus on superparamagnetic iron oxide nanoparticles. Adv Colloid Interface Sci 166:8–23.
- Wabler M, Zhu W, Hedayati M, et al. (2014). Magnetic resonance imaging contrast of iron oxide nanoparticles developed for hyperthermia is dominated by iron content. Int J Hyperthermia 30:192–200.
- Hussain SM, Hess KL, Gearhart JM, et al. (2005). In vitro toxicity of nanoparticles in BRL 3A rat liver cells. Toxicol In Vitro 19:975–83.
- Xu H, Aguilar ZP, Yang L, et al. (2011). Antibody conjugated magnetic iron oxide nanoparticles for cancer cell separation in fresh whole blood. Biomaterials 32:9758–65.
- Kasten A, Grüttner C, Kühn J-P, et al. (2014). Comparative in vitro study on magnetic iron oxide nanoparticles for MRI tracking of adipose tissue-derived progenitor cells. PLoS One 9:e108055.
- Kilian T, Fidler F, Kasten A, et al. (2016). Stem cell labeling with iron oxide nanoparticles: impact of 3D culture on cell labeling maintenance. Nanomedicine (Lond.) 11:1957–70.
- Pröfrock D, Prange A. (2012). Inductively coupled plasma-mass spectrometry (ICP-MS) for quantitative analysis in environmental and life sciences: a review of challenges, solutions, and trends. Appl Spectrosc 66:843–68.
- Stookey LL. (1970). Ferrozine—a new spectrophotometric reagent for iron. Anal Chem 42:779–81.
- Hennessy DJ, Reid GR, Smith FE, Thompson SL. (1984). Ferene – a new spectrophotometric reagent for iron. Can J Chem 62:721–4.
- Fish WW. (1988). Rapid colorimetric micromethod for the quantitation of complexed iron in biological samples. Methods Enzymol 158:357–64.
- Riemer J, Hoepken HH, Czerwinska H, et al. (2004). Colorimetric ferrozine-based assay for the quantitation of iron in cultured cells. Anal Biochem 331:370–5.
- Rad AM, Janic B, Iskander ASM, et al. (2007). Measurement of quantity of iron in magnetically labeled cells: comparison among different UV/VIS spectrometric methods. Biotechniques 43:627–35.
- Dadashzadeh ER, Hobson M, Bryant LH, et al. (2013). Rapid spectrophotometric technique for quantifying iron in cells labeled with superparamagnetic iron oxide nanoparticles: potential translation to the clinic. Contrast Media Mol Imaging 8:50–6.
- Bordelon DE, Cornejo C, Gruttner C, et al. (2011). Magnetic nanoparticle heating efficiency reveals magneto-structural differences when characterized with wide ranging and high amplitude alternating magnetic fields. J Appl Phys 109:124904.
- Dennis CL, Krycka KL, Borchers JA, et al. (2015). Internal magnetic structure of nanoparticles dominates time‐dependent relaxation processes in a magnetic field. Adv Funct Mater 25:4300–11.
- Grüttner C, Teller J, Schütt W, et al. (1997). Preparation and characterization of magnetic nanospheres for in vivo application. In: Hafeli UO, Schütt W, Teller J, Zborowski M, eds. Scientific and clinical application of magnetic carriers. New York: Plenum Press, 53–68.
- Hedayati M, Thomas O, Abubaker-Sharif B, et al. (2013). The effect of cell cluster size on intracellular nanoparticle-mediated hyperthermia: is it possible to treat microscopic tumors? Nanomedicine 8:29–41.
- Derman DP, Green A, Bothwell TH, et al. (1989). A systematic evaluation of bathophenanthroline, ferrozine and ferene in an ICSH-based method for the measurement of serum iron. Ann Clin Biochem 26:144–7.
- Carter P. (1971). Spectrophotometric determination of serum iron at the submicrogram level with a new reagent (ferrozine). Anal Biochem 40:450–8.
- Gibbs CR. (1976). Characterization and application of ferrozine iron reagent as a ferrous iron indicator. Anal Chem 48:1197–201.
- Artiss JD, Vinogradov S, Zak B. (1981). Spectrophotometric study of several sensitive reagents for serum iron. Clin Biochem 14:311–15.
- Pieroni L, Khalil L, Charlotte F, et al. (2001). Comparison of bathophenanthroline sulfonate and ferene as chromogens in colorimetric measurement of low hepatic iron concentration. Clin Chem 47:2059–61.