
Abstract
Purpose: To evaluate, characterise and compare the extent of tissue shrinkage induced from three different commercial microwave ablation devices, and to elucidate the mechanism behind the distinctive performances obtained.
Materials and methods: Microwave ablation (N = 152) was conducted with three different commercial devices on cubes of ex vivo liver (10–40 ± 2 mm/side) embedded in agar phantoms. 50–60 W was applied for 1–10 min duration. Pre- and post-ablation dimensions of the samples, as well as the extent of carbonisation and coagulation were measured and correlated. ANOVA was performed to evaluate statistical significance.
Results: For all devices, logarithmic correlations with time were observed for both tissue shrinkage (R2 = 0.84–1.00) and induced carbonisation (R2 = 0.73–0.99) radially to the antenna axis. Along the longitudinal axis of the antenna, for two of the devices shrinkage did not appreciably change with time (p > 0.05), yet carbonisation increased linearly (R2 = 0.57–0.94). For the third fully internally-cooled device, both carbonisation and shrinkage showed logarithmic trends (R2 = 0.85–0.98 and R2 = 0.78–0.94, respectively) based upon delayed carbonisation appearing only 5 min into ablation and onward. For all devices, non-uniform shrinkage was noted within the coagulated area increasing from the boundary of the ablated area (14%) to the limit of carbonisation (39%) in a linear fashion (R2 = 0.88)
Conclusions: Microwave ablation device construction can alter the extent of post-ablation coagulation and tissue shrinkage. Given that tissue shrinkage in the coagulated area shows non-uniform behaviour, observed differences can be attributed in part to the applicator cooling system that alters the ablation temperature profile.
Introduction
Microwave Thermal Ablation (MTA) is a minimally invasive technique used to destroy cancerous cells by inducing a cytotoxic temperature increase in a well-defined area. In MTA, the temperature increase is produced by the absorption of electromagnetic energy at microwave (MW) frequencies of 915 MHz or 2.45 GHz [Citation1]. This technique results in safe and effective clinical treatments of solid tumours [Citation2,Citation3]. Nonetheless, further study is needed to improve procedure control and outcomes, and to improve the understanding of physical and biological modifications that occurs in the treated tissue [Citation4–7].
MTA can induce temperature increases up to 120 °C in the treated tissue [Citation8]. In the thermally ablated area, at least two different regions can be identified [Citation9]: a “carbonised” region, close to the antenna axis, where the temperature rises above 100 °C and the tissue appears charred, highly desiccated, and black; and a more peripheral region of complete thermal denaturation of proteins known as “white coagulation”, in which the temperature rises above approximately 60 °C but without exceeding 100 °C [Citation8]. The high temperatures induced by a MTA procedure and the corresponding denaturation processes in the target cells induce changes in the electromagnetic, thermal, as well as mechanical properties of the biological tissue [Citation8,Citation10–18]. In particular, shrinkage occurring in the thermally ablated tissue may be significant, up to about 30% [Citation13,Citation18], and hence clinically relevant [Citation19]. Specifically, not accounting for the shrinkage during the treatment planning, or when evaluating post-procedural images, can lead to errors in the estimation of the truly ablated area, thus affecting both the success and safety of the treatment. Therefore, the shrinkage phenomenon needs to be investigated, modelled and characterised in order to have complete control over the interventional procedure and correctly predict and assess MTA outcomes.
Several prior studies have been conducted to evaluate ablation-induced tissue shrinkage as a function of the temperature increase for both radiofrequency ablation (RFA) [Citation13–14] and MTA procedures [Citation15–18]. These have noted that the shrinkage increases with the temperature [Citation14] and is directly linked to the deployed energy [Citation16]. In particular, Amabile et al. [Citation18] proposed an ex vivo predictive model to link the dimensions of the thermally ablated area with the actual dimensions of the treated tissue, taking into account different shrinkage kinetics for carbonised and for coagulated tissue based on only one type of commercially available microwave applicator. In the present work, a comparative study of the shrinkage obtained in ex vivo bovine liver tissue thermally ablated with three commercially available MTA systems was performed quantifying the shrinkage on a device-by-device basis based upon a well-defined experimental setup [Citation17] to determine the impact of different commercial strategies on tissue shrinkage.
Materials and methods
MTA devices
Three commercially available apparatuses for microwave ablation (AcculisTM MTA System AngioDynamics; AmicaTM system HS Hospital Service SpA; and EmprintTM Covidien), all operating at 2.45 GHz, were used to heat cubic specimens of ex vivo bovine liver.
The AcculisTM MTA 2.45 GHz system (MS) uses a generator able to supply up to 140 W for one or two applicators. Water-cooled antennas with a diameter of 1.8 mm (approximately 15-gauge) are used for percutaneous insertion (Accu2i pMTA Applicator). An internal temperature monitoring system is provided [Citation20]. The system monitors the net power supplied by the generator, but it is acknowledged that the power that effectively reaches the input port of the antenna is about 50% lower, due to the losses of the coaxial cable connecting the generator to the antenna.
The AMICATM 2.45 GHz system (HS) consists of a solid-state programmable MW generator (HS Amica GEN) able to supply up to 140 W, and antennas water-cooled via a fully automated peristaltic pump. The adopted antenna was a 14-gauge antenna with an active tip of 30 mm (HS Amica probe 14 G). The temperature at the antenna handle as well as the energy supplied are constantly monitored. Both forward and reflected powers are continuously measured and displayed which permits calculating the losses of the connecting cable and thus enables this system to report as the set power the power effectively delivered to the antenna [Citation21]. In the Amica applicators as well as in the Acculis ones, the cooling system is present only up to the choke section, i.e. about 20 mm behind the antenna tip. However, the actual “active tip” portion of the antennae is not cooled.
The EmprintTM 2.45 GHz system (CV) comprises a generator able to supply up to 100 W, and 13-gauge antennas made of a flexible fibreglass body completely water-cooled applicator, including the active tip. Unlike the other two applicators, the Emprint cooling system covers the entire antenna up to its tip. As for the Acculis system, the coaxial cable connecting the generator to the antenna lowers the power effectively radiated into the tissue of about 40–50%. Moreover, as reported by the manufacturer, during the procedure the Emprint system continuously monitors and adapts electromagnetic field, tissue temperature, and wavelength to optimise the energy distribution into the tissue and provide a more spherical ablated region, and reduce tissue charring [Citation22,Citation23].
In all experiments, the MW power was set to result in an average power value of 50–60 W supplied at the antenna itself. Thus, the HS system was set to operate at 60 W, the MS system at about 120 W, and the CV system at 100 W (maximum output power available). Five different ablation times were tested from 1 min to 10 min. All the devices were used according to the manufacturer recommendations. Distilled water at 10–16 °C was used to cool the applicators.
Tissue samples
Ex vivo bovine liver was obtained in large blocks of tissue (up to 10 kg) from a local slaughterhouse and stored in freezer at −40 °C. The day prior to the experiments, the ex vivo tissue was allowed to defrost. The day of the experiments, cubic samples of the size required for the trials were cut from the larger blocks (side: 10, 15, 20, 30 and 40 mm ± 2 mm). Baseline tissue temperatures were constantly within the range of 18–24 °C.
Experimental setup
The MTA applicator was inserted into the centre of the cuboid sample in order to ensure that the radiating portion of the antenna was surrounded by the tissue. Then, the cube of tissue was inserted into an agar phantom (9%) to maintain electromagnetic and thermal continuity at the tissue boundaries. The dielectric phantom was prepared on a combined hot-plate magnetic stirrer device, mixing distilled water (400 ml), agar powder (36 g, i.e. 9% of the water weight), sucrose (1.5 g) and sodium chloride (1.5 g). A glass beaker (500 ml, inner diameter 10 cm) was used to contain the phantom, with a central cavity precisely cut in the agar to insert the sample of tissue. This setup was then covered with additional agar diluted in saline solution to a height of 10–20 mm to ensure uniform field conditions [Citation17].
shows the different experiments conducted reporting the set combinations of MW power and time of irradiation, samples sizes and number of repetitions performed for each set of parameters. Giving demonstration of equivalence, 15 mm side cubes replaced the 10 mm side cubes for the MS trials. For the CV system, only 20–40 mm cubes were used (N = 42) as it was not possible to perform experiments reliably with cubes smaller than 20 mm side due to the bigger diameter of the antenna and its limited adhesion to the tissue.
Table 1. Experimental parameters of the experiments conducted.
Data analysis
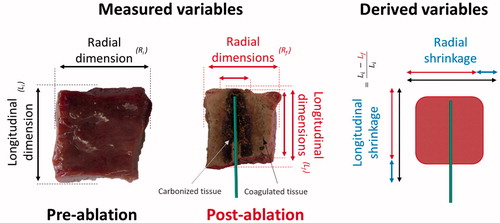
Specimen dimensions before and after heating, including the extension of the carbonised and coagulated regions, were measured with a ruler with an accuracy of 1 mm. To evaluate the post-ablation dimensions, the tissue samples were cut along the antenna axis. The radial dimensions (radius and/or diameter) were measured at the antenna feed perpendicular to the antenna axis, whereas the longitudinal dimensions were measured at the centre, along the observed antenna tract. Absolute and percentage shrinkage were calculated comparing pre- and post-ablation dimensions, and correlated with ablation times and cube sizes. A representative sketch of the measured and derived variables is reported in . The use of cubes of different sizes allowed direct measurement of the tissue shrinkage at different distances from the MW antenna, considering different amounts of tissue undergoing carbonisation and/or coagulation processes [Citation17]. Linear and higher order regression analysis and ANOVA statistical independence tests were performed. As noted in , for two parameter sets, a not statistically significant number of repetitions (i.e. < 3) was performed (based upon technical limitations). Accordingly, the obtained data, although reported for the sake of completeness, were not included in the statistical analysis.
Figure 1. Schematic of the measured end points, i.e. cube’s dimensions and/or extent of the ablated and carbonised regions, as well as the derived dimensions, i.e. the resulting shrinkage.
Results
Device comparison
Shrinkage: In the radial direction, i.e. orthogonal to the antenna axis, tissue shrinkage displayed a logarithmic trend as a function of time of ablation for all devices and cube sizes ( left), increasing up to 41 ± 7%, 37 ± 4%, 32 ± 5% and 25 ± 4% for 10/15 (only MS and HS results), 20, 30 and 40 mm cubes respectively, after 10 min of ablation. For all the devices, the overall contraction was greater for smaller cubes both in terms of absolute measurement and percentage of shrinkage. At 10 min, 20 mm side cubes shrank about 37 ± 4%, whereas 40 side cubes shrank about 25 ± 4% (p < 0.0001). In the longitudinal direction, i.e. along the antenna axis, the amount of shrinkage was independent of increasing time for tissue samples treated with the MS and HS devices (p > 0.05, right). By contrast, the CV system produced a logarithmic correlation of shrinkage as a function of increasing time also in the longitudinal direction, with a maximum shrinkage of about 30% after 10 min that did not change based upon the size of the initial tissue sample (). In , the radial and longitudinal shrinkage vs. time trends observed are detailed.
Figure 2. Percent tissue shrinkage obtained from microwave ablation as a function of time for different cubes’ size and devices: mean, maximum, and minimum values are reported. From top to bottom: Acculis™ MTA System AngioDynamics (MS), Amica™ system HS Hospital Service SpA (HS), and Emprint™ Covidien (CV). Left: radial; right: longitudinal.
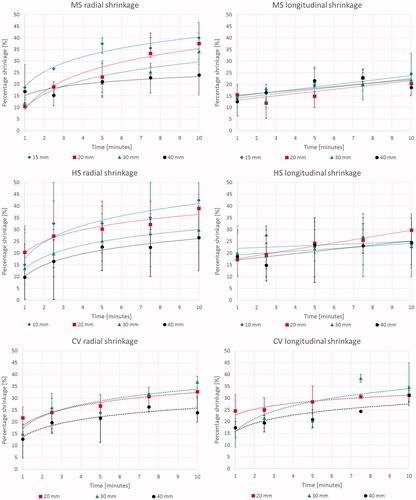
Table 2. Correlation of tissue shrinkage as a function of time for various cubes and devices. Correlations are presented as average values with standard deviation and statistical significance reported.
Carbonization: Analysis of the diameter of carbonisation in the radial direction at the conclusion of the ablation also showed a logarithmic trend as a function of ablation duration ( left) for all the considered systems (MS: y = 3.8 ln x + 3.6, R2 = 0.95; HS: y = 4.2 ln x + 3.4, R2 = 0.97; CV: y = 5.6 ln x − 1.4, R2 = 0.92). In particular, beyond 5 min of ablation, the 10 mm as well as the 15 mm cubes were completely carbonised. In the longitudinal direction ( right), for cubes >20 mm side ablated with the MS and HS devices, a linear increasing trend was observed, while the smaller cubes were completely carbonised by the first minute. By contrast, for the fully internally-cooled CV device, there was a substantial, 5 min delay in carbonisation formation, and thus a delayed logarithmic trend was observed in both the radial and longitudinal directions (). In , the radial and longitudinal carbonisation vs. time trends observed are detailed.
Figure 3. Absolute dimensions of carbonised tissue at the end of the ablation procedure as a function of time for different cubes’ size and device: mean, maximum, and minimum values are reported. From top to bottom: Acculis™ MTA System AngioDynamics (MS), Amica™ system HS Hospital Service SpA (HS), and Emprint™ Covidien (CV). Left: radial; right: longitudinal.
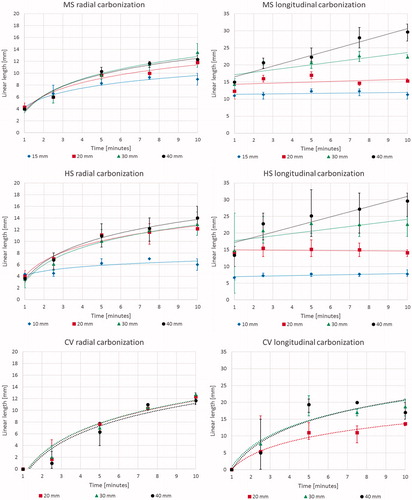
Table 3. Correlation of central tissue carbonisation extension as a function of time for different cubes and devices. Correlations are presented as average values with standard deviation and statistical significance reported.
Results based upon sample size: Detailed comparison of shrinkage as well as extension of the carbonisation and of the ablated area (including carbonisation) obtained for the different samples ablated for 5 and 10 min with the three different devices are reported in . Looking at the results produced for the 30 mm side cubes (), tissue ablated with the MS and HS devices showed similar logarithmic trend as a function of time for shrinkage in the radial direction (y = 8.8 ln x + 9.1, R2 = 0.84 for MS; y = 7.2 ln x + 13.3, R2 > 0.99 for HS). For carbonisation, a similar logarithmic trend for diameter (y = 4.1 ln x + 3.3, R2 = 0.96 for MS; y = 4.2 ln x + 3.0, R2 = 0.98 for HS) in the radial direction, and a similar linear trend (y = 0.7 x + 16.5, R2 = 0.60 for MS; y = 0.7 x + 17.0, R2 = 0.57 for HS) along the antenna axis were observed for the two systems. By contrast, the CV device produced shrinkage with a logarithmic trend in both the radial and longitudinal directions (y = 7.1 ln x + 17.3, R2 = 0.89 radially; y = 7.9 ln x + 15.8, R2 = 0.78 longitudinally); carbonisation resulted in a logarithmic trend in both the directions, too (y = 5.7 ln x − 1.3, R2 = 0.94 radially; y = 8.6 ln x + 0.7, R2 = 0.90 longitudinally).
Figure 4. Percent shrinkage (left) and absolute dimensions (right) of the carbonised area as a function of the time for 30 mm side cubes with direct comparison of the different devices: mean, maximum, and minimum values are reported. Top: radial; bottom: longitudinal.
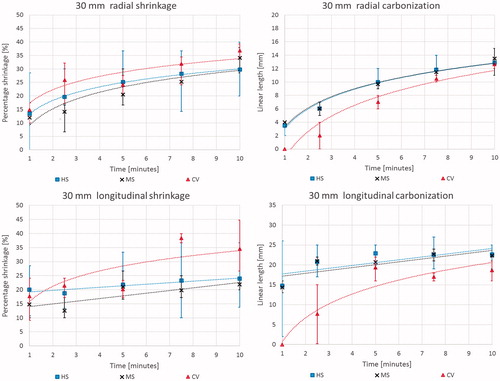
Table 4. Quantitative data of tissue shrinkage, carbonisation, and extension of the ablated area. These are reported as absolute and as percentage of the ablated area for samples treated for 5 and 10 min.
Dynamics of coagulated tissue shrinkage
The resultant shrinkage in the carbonised tissue was consistent and independent from the time of exposure. Once complete carbonisation of the entire tissue sample was achieved (i.e. in the cubes smaller than 20 mm side after 5 min of ablation; ), shrinkage in the range of 37 ± 7% was observed without any further correlation with increasing time ().
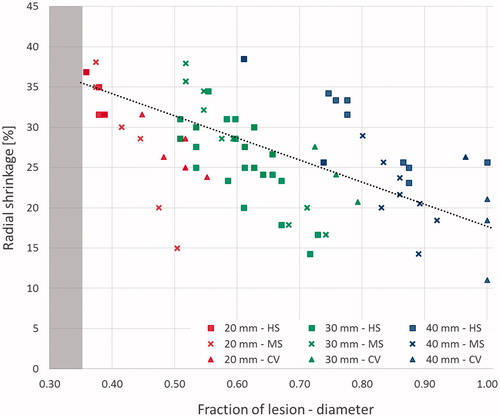
The dynamics of shrinkage of the coagulated tissue in the presence of carbonisation was investigated in cubes ablated for at least 5 min for all three devices (), i.e. in the cases where a substantial radial carbonisation was obtained (> 5 mm). Independent of the initial sample dimension and from the device used, non-uniform shrinkage was observed orthogonally to the antenna axis for increasing distances from the applicator (radius considered). A linear relationship between the shrinkage and the radial distance from the edge of the carbonised region (y = −27.5 x + 45.2, R2 = 0.88) was noted, from a maximum shrinkage of 39 ± 3% at the margin of the carbonised region to a minimum of 16 ± 5% reached at the periphery of the ablated area ().
Figure 5. Percent shrinkage in the presence of carbonisation. Results are presented as a function of the radial distance from the antenna axis normalised to the ablated area. Different cube sizes (20, 30, and 40 mm) and ablation times (5, 7.5 and 10 min) are considered. The different devices are indicated by various shaped markers (Amica™ system – HS: squares; Acculis™ system – MS: crosses; Emprint™ system – CV: triangles). The grey edge denotes the maximum carbonisation obtained from all the considered experiments (i.e. 20 mm at 10 min).
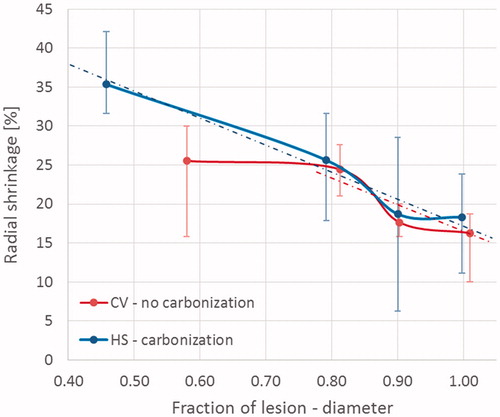
The shrinkage dynamics of the coagulated tissue in the presence of carbonisation was then compared with that observed in the absence of carbonisation by analysing the percentage shrinkage as a function of the increasing radial distance (radius considered) from the antenna for less than 5 min (). A difference in the shrinkage of the tissue was observed close to the antenna axis between the two devices that have reproducible outcomes, i.e. CV that induces no carbonisation, and HS which shows carbonisation. In presence of >10% carbonisation of the whole ablated area extension (i.e. the HS case), tissues close to the carbonised region shrank 35 ± 4% with shrinkage decreasing linearly as a function of the increasing distance from the antenna axis up to a 20% shrinkage in the periphery of the ablated zone (y = –34.7 x + 51.8, R2 = 0.57). On the contrary, in absence of carbonisation (i.e. the CV case <5 min), a plateau of 25 ± 5% shrinkage was measured for most (80%) of the tissue in radial direction (radius considered).
Figure 6. Percent shrinkage in the presence (Amica™ system – HS: blue) or absence (Emprint™ system – CV: red) of carbonisation. Results are presented as a function of the radial distance from the antenna axis normalised to the ablated area. Samples were ablated for 1 and 2.5 min.
Discussion
In a prior report [Citation17], direct and precise determination of the pre- and post-ablation specimen dimensions were performed to characterise the tissue contraction occurring during a MTA procedure for one specific commercial device (i.e. the Amica system). Using cubes of ex vivo tissue treated with different time-power combinations, that study demonstrated substantial tissue shrinkage (52–74% in volume), dependent on the time of exposure which was significantly higher in smaller pieces of tissue. Greater shrinkage was reported in the carbonised tissue (43% when measured radially to the antenna axis). Given heterogeneities observed in shrinkage with MTA (up to 43% [Citation17]) and RFA (about 12–22% [Citation14]), it is reasonable to expect potential differences in shrinkage among different devices: varying the frequency, or the microwave antenna design, the electromagnetic field distribution into the tissue changes can possibly lead to different temperature patterns and affecting the extent of tissue shrinkage [Citation7,Citation24–29]. Moreover, the tissue temperature increase can be potentially affected by the antenna cooling system [Citation6,Citation30]. Accordingly, in this work, further investigation regarding shrinkage characterisation was conducted in order to account for different commercially available MTA systems, involving different antenna cooling designs.
Experiments were conducted adopting the setup proposed in Ref. [Citation17] investigating similarities and differences between different MTA devices (). In the radial direction, similar trends in shrinkage were observed at the margin of the thermally ablated area, whereas in the longitudinal direction, the CV device induced different shrinkage kinetics with respect to the other two systems. Moreover, the carbonisation of the tissue occurred later on during the procedure in the ablated region treated with the CV system (). The delayed appearance of carbonisation influences the longitudinal shrinkage kinetics, although it does not affect the resulting total shrinkage with respect to the other two devices ().
Looking at the dynamics of the shrinkage phenomenon, it is possible to note that the presence of carbonisation influences the shrinkage profile occurring through the tissue. The shrinkage, dependent upon physical phenomenon occurring in the tissue during ablation was correlated with the radial distance from the radiating microwave source. In the tissue closer to the antenna where the heating is directly caused by the electromagnetic energy deposition and very high temperatures are reached, the shrinkage observed is higher with respect to the more external region (). As previously noted [Citation17,Citation18], in the carbonised tissue i.e. in the tissue heated above 100 °C, a constant shrinkage of about 35–40% occurs. As it is possible to observe from the completely carbonised smaller cubes (1 and 1.5 cm side) of and , once carbonisation – the ultimate level of tissue desiccation – is achieved, shrinkage does not increase with the time of ablation. Beyond the carbonisation margin, in the coagulated-but-not-carbonised tissue, the shrinkage consistently decreases () with the tissue temperature to reach a minimum at the edge of the thermally ablated region where the tissue is exposed to temperature of approximately 55–60 °C [Citation8]. Such results confirm those presented by Rossmann et al. [Citation14] pointing out that different amounts of tissue shrinkage are measurable in correspondence to different tissue temperatures, with higher shrinkage for higher temperature values. Accordingly, the shrinkage occurring in the tissue strictly correlates to the physical status of the tissue and its temperature. In the carbonised tissue, i.e. above 100 °C, the shrinkage appears as a static phenomenon [Citation18]; whereas in the coagulated tissue, i.e. where the tissue temperature is higher than 55–60 °C but lower than 100 °C, the shrinkage manifests as a dynamic process from the maximum observed in the charred tissue to the minimum observed at the edge between the coagulated region and untreated tissue.
We note that when carbonisation is present no device dependence is noted for the shrinkage in the coagulated-but-not-carbonised tissue (). Yet, in absence of carbonisation, the shrinkage in this coagulated-but-not-carbonised tissue zone shows a different behaviour due to the different used devices (). In the samples treated with the HS system, carbonisation is present and the obtained shrinkage decreases from a maximum value corresponding to the carbonisation margin to a minimum value at the necrosis edge. In the samples treated with the CV device without inducing carbonisation, i.e. for ablation times up to 5 min, constant shrinkage in the tissue close to the antenna is found (about 25%), although this is lower than the maximum observed in HS (35%). Nonetheless, farther from the CV antenna, decreasing amounts of shrinkage converging on the HS trend were observed; so that, very close values are obtained for the two devices considering the whole thermally ablated area. The lack of carbonisation during the first minutes of heating (below 5 min) is likely linked to the different cooling system implemented in the CV applicators that allows the cooling liquid to reach the antenna tip, thus preventing the early overheating of the tissue close to the antenna axis and its carbonisation. It follows that different technologies can influence the appearance of carbonisation, and consequently the profile of the induced tissue shrinkage. In particular, it can be evidenced that the performance of the cooling system plays a dominant role.
It is important to account here for potential limitations of our experimental setup, since the use of relatively small tissue cubes, although enabling the determination of the spatial evolution of the thermally ablated area and thus the shrinkage dynamics, could influence the ablated zone changing the boundary conditions between the target tissue and the surrounding materials [Citation31]. Yet, for samples bigger than 10 mm side (), carbonisation trends as a function of time of ablation resulted independent from the cube size, and no significant difference was pointed out comparing the different cube sizes (see for the radial direction). On the other hand, in the smaller cubes (≤ 20 mm side) a possible influence of the restricted dimension of the samples on the data collected longitudinally was noted.
Conclusion
The results obtained investigating the shrinkage induced in ex vivo bovine liver tissue from three different MTA commercial devices show that the device design influences the ablation outcome. In particular, internal cooling can prevent the formation of carbonisation for short ablation times. Absence of carbonisation leads to a different shrinkage profile in the tissue, although not altering the total shrinkage observed at the boundary of the ablated area. The extent of shrinkage is in part dependent on the tissue status. Carbonization, the culmination and final, maximal point of the shrinkage process as the tissue is totally desiccated and dehydrated, plays a crucial role in the evolution of tissue shrinkage in MTA. In the tissue belonging to the thermally coagulated zone, the shrinkage appears as a dynamic process linearly increasing with the tissue temperature.
Acknowledgements
The authors acknowledge AngioDynamics, HS Hospital Service, and Covidien for having made available the MW antennas and the power generators. The authors alone are responsible for the content and writing of the paper.
Disclosure statement
Prof. Goldberg is both a consultant to and receives research support from Cosman Instruments and AngioDynamics.
References
- Ahmed M, Brace CL, Lee FT Jr, Goldberg SN. (2011). Principles of and advances in percutaneous ablation. Radiology 258:351–69.
- Swan RZ, Sindram D, Martinie JB, Iannitti DA. (2013). Operative microwave ablation for hepatocellular carcinoma: complications, recurrence, and long-term outcomes. J Gastrointest Surg 17:719.
- Meloni MF, Galimberti S, Dietrich CF, et al. (2016). Microwave ablation of hepatic tumors with a third generation system: loco-regional efficacy in a prospective cohort study with intermediate term follow-up. Z Gastroenterol 54:541–7.
- Sebek J, Albin N, Bortel R, et al. (2016). Sensitivity of microwave ablation models to tissue biophysical properties: a first step toward probabilistic modeling and treatment planning. Med Phys 43:2649–61.
- Saito K, Ito K. (2017). Preliminary investigation of numerical estimation of coagulated region generated by interstitial microwave antenna. Int J Hyperthermia 33:69–73.
- Cavagnaro M, Pinto R, Lopresto V. (2015). Numerical models to evaluate the temperature increase induced by ex vivo microwave thermal ablation. Phys Med Biol 60:3287–311.
- Lopresto V, Pinto R, Farina L, Cavagnaro M. (2017). Treatment planning in microwave thermal ablation: clinical gaps and recent research advances. Int J Hyperthermia 33:83–100.
- Lopresto V, Pinto R, Cavagnaro M. (2014). Experimental characterisation of the thermal lesion induced by microwave ablation. Int J Hyperthermia 30:110–8.
- Ahmed M, Solbiati L, Brace CL, et al. (2014). Image-guided tumor ablation: standardization of terminology and reporting criteria-a 10-year update. J Vasc Interv Radiol 25:1691–705.
- Yang D, Converse MC, Mahvi DM, Webster JG. (2007). Measurement and analysis of tissue temperature during microwave liver ablation. IEEE Trans Biomed Eng 54:150.
- Lopresto V, Pinto R, Lovisolo GA, Cavagnaro M. (2012). Changes in the dielectric properties of ex vivo bovine liver during microwave thermal ablation at 2.45 GHz. Phys Med Biol 57:2309–27.
- Ji Z, Brace CL. (2011). Expanded modelling of temperature-dependent dielectric properties for microwave thermal ablation. Phys Med Biol 56:5249–64.
- Brace CL, Diaz TA, Hinshaw JL, Lee FT Jr. (2010). Tissue contraction caused by radiofrequency and microwave ablation: a laboratory study in liver and lung. J Vasc Interv Radiol 21:1280–6.
- Rossmann C, Garrett-Mayer E, Rattay F, Haemmerich D. (2014). Dynamics of tissue shrinkage during ablative temperature exposures. Physiol Meas 35:55–67.
- Liu D, Brace CL. (2014). CT imaging during microwave ablation: analysis of spatial and temporal tissue contraction. Med Phys 41:113303-1–9.
- Sommer CM, Sommer SA, Mokry T, et al. (2013). Quantification of tissue shrinkage and dehydration caused by microwave ablation: experimental study in kidneys for the estimation of effective coagulation volume. J Vasc Interv Radiol 24:1241–8.
- Farina L, Weiss N, Nissenbaum Y, et al. (2014). Characterisation of tissue shrinkage during microwave thermal ablation. Int J Hyperthermia 30:419–28.
- Amabile C, Farina L, Lopresto V, et al. (2017). Tissue shrinkage in microwave ablation of liver: an ex vivo predictive model. Int J Hyperthermia 33:101–9.
- Ganguli S, Brennan DD, Faintuch S, et al. (2008). Immediate renal tumor involution after radiofrequency thermal ablation. J Vasc Interv Radiol 19:412–18.
- Acculis MTA System – brochures and products’ specifications. Available from: http://www.angiodynamics.com/products/Acculis [accessed February 2016].
- AMICATM – brochures and products’ specifications. Available from: http://www.hshospitalservice.com [accessed February 2016].
- Ierardi AM, Mangano A, Floridi C, et al. (2015). A new system of microwave ablation at 2450 MHz: preliminary experience. Updates Surg 67:39–45.
- EmprintTM – brochures and products’ specifications. Available from: http://www.medtronic.com/covidien/products/ablation-systems/emprint-ablation-system [accessed February 2016].
- Lopresto V, Pinto R, Lodato R, et al. (2012). Design and realisation of tissue-equivalent dielectric simulators for dosimetric studies on microwave antennas for interstitial ablation. Phys Med 28:245–53.
- Sun Y, Cheng Z, Dong L, et al. (2012). Comparison of temperature curve and ablation zone between 915- and 2450-MHz cooled-shaft microwave antenna: results in ex vivo porcine livers. Eur J Radiol 81:553–7.
- Curto S, Taj-Eldin M, Fairchild D, Prakash P. (2015). Microwave ablation at 915 MHz vs 2.45 GHz: a theoretical and experimental investigation. Med Phys 42:6152–61.
- Biffi Gentili G, Ignesti C. (2015). Dual applicator thermal ablation at 2.45 GHz: a numerical comparison and experiments on synchronous versus asynchronous and switched-mode feeding. Int J Hyperthermia 31:528–37.
- Sawicki JF, Shea JD, Behdad N, Hagness SC. (2017). The impact of frequency on the performance of microwave ablation. Int J Hyperthermia 33:61–8.
- Ryan TP, Brace CL. (2017). Interstitial microwave treatment for cancer: historical basis and current techniques in antenna design and performance. Int J Hyperthermia 33:3. l4.
- He N, Wang W, Ji Z, et al. (2010). Microwave ablation: an experimental comparative study on internally cooled antenna versus non-internally cooled antenna in liver models. Acad Radiol 17:894–9.
- Cavagnaro M, Amabile C, Cassarino S, et al. (2015). Influence of the target tissue size on the shape of ex vivo microwave ablation zones. Int J Hyperthermia 31:48–57.