
Sir,
In his letter, Prof. Borasi questions (1) whether an exponentially linear decrease of survival as a function of heating time has been proven for hyperthermia (HT) cell survival curves, or whether the linear quadratic (LQ) model [Citation1] would be sufficient to describe such curves, and (2) whether survival data should be weighted by the uncertainty of the data points prior to fitting.
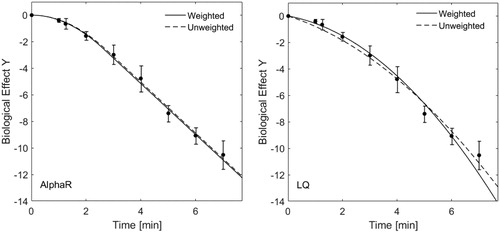
We are convinced that weighting clonogenic survival data by the relevant uncertainty in data points is the correct way of fitting. Each data point has its own uncertainty which may be seen as the “quality” of that point. Knowing that there are differences in data quality, these should be accounted for during fitting. Weighting factors should be normalised to the relevant data point in order to account for differences in absolute values. Since our fit was based on a nonlinear least squares fit, weighting factors were also squared. This leads to an overall factor of std(S)2/mean(S)2 (S is the surviving fraction). Uncertainty weighting should not influence the overall shape of the fit if the model used describes the data well, and uncertainties lie within a normal range (i.e. there are no obvious outliers). shows a comparison of weighted vs. unweighted fitting to data from of [Citation2] fitted using the LQ-, and the AlphaR models. Here, we show that, for the data set used, the AlphaR model fit is more robust than that of the LQ-model. Although uncertainty weighting may influence the shape of the LQ fit, this is in its favour since points that are less accurately defined will draw the fit in a direction that does not reflect the underlying individual data points in their totality.
Figure 1. Uncertainty weighted and unweighted fits using the AlphaR (left) and LQ-model (right) of HCT116 cell survival data at 48 °C as a function of heating time. Whereas there is no big difference between the two fits for the AlphaR model fit, the curves of the LQ model show a more obvious influence of the weighting. The respective coefficients of determination are very similar: R2AlphaR Weighted = 0.997, R2AlphaR Unweighted=0.996, R2LQ Weighted = 0.991, R2LQ Unweighted = 0.988.
In our article [Citation2], we did not conclude that the HT survival data have an exponential asymptote, but presented a model that can describe such behaviour. This is an important difference. Whether the HT survival data allow us to discriminate clearly between a truly exponentially linear model for high thermal doses, or the LQ-model, cannot be answered with certainty. Naturally, models can only be falsified by data, but never be proven. In order to reject a model, such as the LQ-model, a threshold goodness of fit must be defined. Parameters, such as coefficients of determination, will only allow comparison with fits carried out under the same conditions, but it is difficult to decide at which numerical values a fit should be considered inadequate. The AlphaR model is capable of describing both LQ and LQ linear cell survival behaviours, and fits are therefore always equivalent to or superior to the LQ-model fits, while using the same number of free parameters for the HT curves (LQ: α and β, AlphaR: α0 and β). If a LQ fit described the data better, the respective fit with the AlphaR model would be LQ and the parameter α0 would be undeterminable.
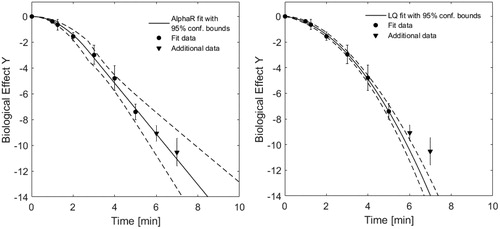
In our opinion, there are a number of arguments in favour of using the AlphaR model to fit HT survival curves: (1) Traditionally, HT cell survival data has been described using the Arrhenius model [Citation3–6]. This assumes a purely exponentially linear decrease of survival as a function of heating time. The AlphaR model is able to describe such an exponentially linear asymptote. (2) In and our article, we have demonstrated that a fit by the AlphaR model may be more robust and will be of equal to, or better quality than, a LQ-model fit. (3) An extrapolation of an AlphaR model fit beyond the range of experimental data used for fitting is possible. This is more difficult to achieve with the LQ-model fit. An example for this is shown in . Here we use the methods described in [Citation7] for radiotherapy application: The lowest survival data points were excluded from the fit, but considered for the calculation of the coefficients of determination. This provides some insight into how well the fit extrapolates beyond the fitted data range. The coefficients of determination obtained were = 0.892, and
= 0.995 – which clearly favours the fit by the AlphaR model.
Figure 2. Uncertainty weighted fits using the AlphaR (left) and LQ-model (right) of HCT116 cell survival data at 48 °C as a function of heating time. The fit curves obtained with 95% confidence bounds (dashed lines) when fitting the data up to heating times of 5 min (round points) are shown. Fit curves were then extrapolated to longer heating times, and compared to additional experimental data (triangles) at 6 and 7 min. Whereas both models provide a good fit within the range of data included for fitting, the exponentially linear arm of the AlphaR model also provides a good fit in the extrapolated region (R2AlphaRAllData=0.995), whereas the continuously bent LQ-model would underestimate survival at higher heating times (R2LQAllData = 0.892).
Our study included 12 HT survival curves from three cell lines, reaching to surviving fractions as low as 10−5. We agree with Prof. Borasi that more experimental data at lower survival ranges would be useful for further validation and comparison of the models. However, such data may be very difficult, or even impossible, to obtain with current standard clonogenic assay techniques. Survival data in the range of 10−7 require the treatment and plating of a minimum of 108 cells per point, which is practically unachievable for a standard clonogenic assay. We are therefore sceptical as to whether more experimental data derived from clonogenic assays, e.g. from more cell lines, would provide evidence that would lead to a change in the conclusions drawn above.
In summary, while we agree that there are limitations to the range of experimental data available, we feel that the proposed AlphaR model provides flexibility in modelling survival curves from different treatment modalities. It overcomes some of the limitations of the LQ-model and that is why it was our model of choice for describing HT cell survival curves. These findings are independent of the underlying weighting of the data used for fitting. We will be happy to address this issue again when more extended high quality experimental data becomes available.
Disclosure statement
No potential conflict of interest was reported by the authors.
Additional information
Funding
References
- Fowler JF. (1989). The linear-quadratic formula and progress in fractionated radiotherapy. Br J Radiol 62:679–94.
- Brüningk SC, Ijaz J, Rivens I, et al. (2017). A comprehensive model for heat-induced radio-sensitization. Int J Hyperthermia. [Epub ahead of print]. doi:10.1080/02656736.2017.1341059
- Dewey WC. (2009). Arrhenius relationships from the molecule and cell to the clinic. Int J Hyperthermia 25:3–20.
- Sapareto SA, Hopwood LE, Dewey WC, et al. (1978). Effects of hyperthermia on survival and progression of Chinese Hamster ovary cells. Cancer Res 38:393–400.
- Rozin-Towle L, Pirro J. (1991). The response of human and rodent cells to hyperthermia. Int J Radiat Oncol Biol Phys 20:751–6.
- Henle KJ, Dethlefsen LA. (1980). Time-temperature relationships for heat-induced killing of mammalian cells. Ann N Y Acad Sci 335:234–53.
- Park C, Papiez L, Zhang S, et al. (2008). Universal survival curve and single fraction equivalent dose: useful tools in understanding potency of ablative radiotherapy. Int J Radiat Oncol Biol Phys 70:847–52.