
Abstract
Purpose: The aim of this study was to examine the feasibility of using nanoparticle-enhanced transmission ultrasound (NETUS) as an image-based monitoring modality for microwave hyperthermia treatment.
Methods: A dedicated transmission ultrasound imaging system was used to obtain acoustic projections and ultrasound computed tomography images. Initially, speed-of-sound based images were used to non-invasively monitor temperature changes in in vitro and ex vivo specimens, induced by a microwave needle-type applicator. Next, the hyperthermia acceleration ability of two ultrasound nanoparticles based contrast agents (iron oxide and copper oxide) was examined and visualised. Finally, a two-step image guided microwave therapeutic procedure using NETUS was investigated in a realistic breast mimicking phantom. First, the pathology simulating region borders were detected. Then, a microwave-induced temperature elevation was non-invasively monitored.
Results: The transmission ultrasound scanning system was able to detect temperature changes with a resolution of less than 0.5 °C, both in vitro and ex vivo. In accordance with previous studies, it was visually demonstrated that iron oxide nanoparticles expedite the heating process (p < 0.05). Copper oxide nanoparticles, however, did not alter the hyperthermia profile significantly. In the breast mimicking phantom, NETUS yielded accurate detection of the target region as well as thermal monitoring of the microwave heating procedure.
Conclusions: NETUS can combine enhanced target visualisation with non-invasive thermometry and accelerated heating effect. Quantitative feedback, however, requires a tissue-specific calibration-curve. A proof of concept for microwave hyperthermia treatment monitoring using NETUS was established. The suggested methodology may potentially provide a non-invasive cost-effective means for monitoring thermal treatment of the breast.
Introduction
Thermal treatment procedures in breast cancer include complete tumour ablation [Citation1] as well as local hyperthermia combined with radiotherapy [Citation2] or chemotherapy [Citation3]. The added value of tumour temperature elevation can be drastic. For example, in the relatively common clinical case of locoregional recurrence in breast cancer, a surge in complete treatment response may be achieved [Citation4]. A common hyperthermia inducing modality used in the aforementioned case is microwave (MW) [Citation5,Citation6].
A crucial element for MW hyperthermia treatment is temperature monitoring, aimed to verify that healthy tissues are not compromised and that a sufficient thermal dose is applied to the target tumour. Although invasive thermocouples may provide accurate temperature measurement, they offer poor or no spatial resolution. Image-based thermal monitoring, on the other hand, holds a great advantage in its non-invasiveness and its spatial resolution. Magnetic resonance imaging (MRI) thermometry can provide noninvasively a temperature map, which may be depicted atop the anatomical image as a coloured graphic overlay. This method is quantitative, covers a wide temperature range and offers good temporal resolution [Citation7]. Nevertheless, MRI is costly, its accessibility is limited, and it requires the utilisation of MRI compatible ferromagnetic-free microwave applicators [Citation8]. X-ray computed tomography (CT)-based thermal treatment monitoring provides high spatial and temporal resolution. However, it is characterised by a relatively low temperature resolution [Citation9], and may expose the patient to substantial ionising radiation [Citation10].
Ultrasound is widely available in the clinic, relatively inexpensive and provides real-time imaging capabilities. Consequently, various research efforts were taken to harness it for thermal therapy monitoring [Citation11–13]. Investigated methods include B-mode [Citation14], local harmonic motion [Citation15], shear wave thermometry [Citation16], thermal strain imaging [Citation17] and Nakagami [Citation18]. Additional information can be found in the recently published review outlined in reference [Citation9].
Another hyperthermia relevant ultrasound imaging methodology, previously investigated for high intensity focussed ultrasound (HIFU) treatment monitoring, is transmission ultrasound [Citation19]. Utilising this approach, an ultrasonic pulse is transmitted from a transducer on one side of the scanned object (commonly the breast) and received by another transducer located on the other side. The acquired data allow the reconstruction of speed-of-sound (SOS) and acoustic attenuation proportional images. Moreover, using automated computerised scanning of the breast from different directions, a cross-sectional tomographic image can be obtained, yielding a complete SOS or attenuation coefficient map of the scanned region [Citation20–23]. Thermometry can be obtained using this methodology by relating to the strong dependence of the SOS on temperature, which was characterised and quantified for various tissues [Citation24]. The advantage of transmission ultrasound over other ultrasound-based methods is the direct manifestation of the SOS in the received signals (as compared to the B-mode, for example), and the ability to provide non-user-dependent 2D or 3D images.
As the relation between the SOS and temperature is tissue-dependent, implementing the above-described approach to breast thermometry requires prior classification of the tissues in the image (fatty, non-fatty and tumour tissue). This may be accomplished using the difference in their SOS [Citation25]. Of these three tissue types, detection of the tumour region immediately before and during the thermal treatment is of paramount importance. It is, thus, essential for both locating the area into which the microwave applicator will be positioned as well as for precise temperature estimation (by using the correct SOS–temperature relation curve). Obviously, it is also highly desirable to increase tumour detectability in the image.
Nanoparticles (NPs) have been extensively studied as tumour detecting contrast agents for various imaging modalities [Citation26,Citation27]. Recently, copper oxide (CuO) and iron oxide (IO) NPs were used as transmission ultrasound contrast enhancing agents [Citation28,Citation29], improving the visibility of target regions. Their extremely small size (around 10 nm) may allow increased accumulation in the tumour, hence, provide improved and selective target detection [Citation30]. Moreover, IO NPs were recently demonstrated as being capable of increasing MW heating efficiency, even though the effect was demonstrated on relatively high concentrations of the material [Citation31,Citation32].
The purpose of this study was to investigate the utilisation of nanoparticle-enhanced transmission ultrasound (NETUS) as a non-invasive “one-stop shop” for MW hyperthermia treatment, providing triple-impact benefits. Namely, it was postulated that the combined system will yield an improved border detection of pathologic regions, accelerate the temperature rise and also provide image-based non-invasive thermal monitoring. Specifically, the following goals were pursued:
Studying the capability of transmission ultrasound to monitor MW thermal treatment.
Evaluating the ability of IO and CuO NPs to enhance the efficiency of MW heating in a clinically relevant concentration range.
Performing a proof of concept for a two-step therapeutic procedure, incorporating both target detection and thermal treatment monitoring using NETUS.
Since SOS dependence on temperature in non-fatty tissues is parabolic in nature [Citation33] and its sensitivity is reduced at high temperatures, the experiments were focussed on the hyperthermia treatment temperature range, broadly defined as 39–45 °C [Citation34].
Materials and methods
Transmission ultrasound scanning system
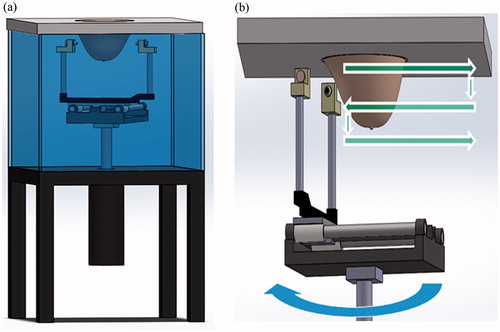
A custom made, computer controlled transmission ultrasound system was built in our lab (), as described in [Citation29,Citation35]. Briefly, the system is comprised of two ultrasonic transducers facing each other (Panametrics, TX), connected to a computer controlled motorised unit capable of performing 3D motion. Ultrasonic pulses were transmitted with 50 or 100 µJ energy, from one transducer to the other using a pulser–reciever (5800 PR; Panametrics, MA). The received signals were band-pass filtered between 300 KHz and 35 MHz and amplified. Analog-to-digital sampling was then performed at 125 MHz (PicoScope 5000, Pico Technology, Cambridgeshire, UK). The envelope of the raw (RF) A-lines was extracted using the Hilbert transform and used for calculation of the pulses time-of-flight (TOF) and amplitude. SOS or acoustic attenuation-based images were reconstructed using a special software written in Matlab (MathWorks, MA). Remaining high frequency noises were removed using a 2D median filter. Two scanning modes were performed () [Citation29]:
Figure 1. The breast scanning transmission ultrasonic system. (a) A general outline of the system, comprising of a water tank, a motorised unit connected to two ultrasonic transducers and a top cover into which the breast is inserted through a hole. (b) Data acquisition modes used in this study. The straight horizontal and vertical arrows (green) describe the transducers motion during the acoustic projection raster imaging acquisition. The round (blue) arrow describes the rotation of the transducers axis, applied during the UCT mode.
Acoustic projection imaging: the transducers scanned the object along horizontal lines (raster trajectory), yielding a TOF per-pixel projection image, which corresponds to the integrated reciprocal value of the SOS along the beam direction. Field of view (FOV) and scan resolution varied according to the imaged object, as detailed in the following.
Ultrasonic computed tomography (UCT): cross-sectional attenuation based images were generated by recording 61 projections, each of 170 mm in length around the imaged object (0–180° with a 3° increment). Images were reconstructed at a 0.3 mm × 0.3 mm resolution using the filtered back projection algorithm. The background water region was masked out.
MW heating system and gold-standard thermometry reference
All heating experiments were performed using a needle type MW applicator of 2.45 GHz (Leanfa, Italy), capable of transmitting at powers of 0–140 W. The needle outer diameter in its widest part was 3.4 mm. As a gold-standard reference temperature measurement, a microwave immune fibre optic temperature sensor (Neoptix, Canada) was used, providing temperature readings every 1 s, with a resolution of 0.1 °C.
Experimental procedure
The experimental part comprised three main steps: evaluation of thermometry capabilities by transmission ultrasound without NPs, NPs thermal enhancement evaluation and breast phantom thermal treatment monitoring using NETUS study.
Evaluation of the transmission ultrasound system thermometry capabilities
To examine the feasibility of performing MW heating thermometry using transmission ultrasound, two imaging objects were studied: in vitro water filled test tubes and ex vivo poultry breast specimen.
Thermal imaging of water in vitro: Two polypropylene test tubes of 27 mm inner diameter and 1 mm width were filled with 45 ml of water and placed in the ultrasonic scanner. A MW antenna applicator and a fibre optic temperature sensor were inserted into each tube. A baseline acoustic projection raster scan was then performed, with horizontal resolution of 0.25 mm and vertical resolution of 2 mm. The FOV was set to 95 × 30 mm and scan time was 105 s. To explore small temperature changes, six additional scans were performed, while applying 5 W MW heating in the right tube only (the left tube served as a control). Next, the MW was turned off until the water cooled to the baseline temperature. The imaging and heating process were then repeated using a power of 60 W, to explore the entire temperature range of 24–45 °C. Finally, all images were subtracted from the baseline image, to visualise the temperature related changes as manifested by the change in TOF.
Ex vivo poultry breast hyperthermia imaging: To further evaluate the feasibility of providing MW thermometry using transmission ultrasound, a hyperthermia procedure in ex vivo tissue was monitored. A fresh poultry breast was purchased at the local butchery and a slice of approximately 30 mm × 30 mm × 30 mm was cut. The MW antenna and the temperature sensor were jointly inserted into the tissue so that the heating layer was approximately 10 mm from the upper surface of the tissue. The FOV was set to 60 mm × 26 mm, with a resolution of 0.25 mm × 1 mm. After acquiring a baseline scan, MW heating was applied by gradually increasing the power from 5 to 130 W.
Nano-sized transmission ultrasound contrast agents hyperthermia enhancement evaluation
Two NPs-based contrast agents were investigated for obtaining a MW hyperthermia enhancement effect: CuO and IO.
CuO: CuO NPs may serve as transmission ultrasound contrast agents, in view of the fact that their presence induces an increase in the acoustic attenuation coefficient [Citation28]. CuO NPs capped by poly-ethylene-glycol (PEG) were used in the present study. The CuO NPs were synthesised according to a previously described protocol [Citation36] and the NPs surface was then coated by a PEG polymer. Briefly, an aliquot of 5 ml of synthesised CuO NPs aqueous dispersion (Cu concentration of 4.180 mg/ml) was added to 30 ml of 0.5% w/w solution of methoxy-polyethylene glycol acetic acid (MeO–PEG–COOH, Mw = 5000, Sigma-Aldrich, Rehovot, Israel) and stirred by orbital shaker (160 rpm) for 48 h at room temperature. Then, the mixture was centrifuged (12 000 rpm, 22 °C, 30 min), washed twice with water to remove excess of organic ligands, and finally re-dispersed in 5 ml of water. Cu concentration of the colloidal sample was determined to be 2.860 mg/ml by optical emission spectrometer (ICP, Varian 720-ES, Palo Alto, CA). The size and morphology of the NPs were examined in an FEI T12 G2 transmission electron microscopy (TEM), operated at 120 kV. The images were analysed using a Gatan US1000 high-resolution cooled CCD camera and were processed with Digital Micrograph version 3.3.1 software (Gatan, Pleasanton, CA). Dynamic light scattering (DLS) and zeta potential measurements were carried out with a ZetaSizer Nano ZS (Malvern, Worcestershire, UK). Fourier transforms infra-red (FTIR) spectra were recorded over the spectral range of 520–4000 cm−1 with a resolution of 4 cm−1 using a Thermo Scientific – Nicolete iS50 FTIR (Thermo Electron Scientific Instruments LLC, Madison, WI), equipped with a smart iTR diamond ATR.
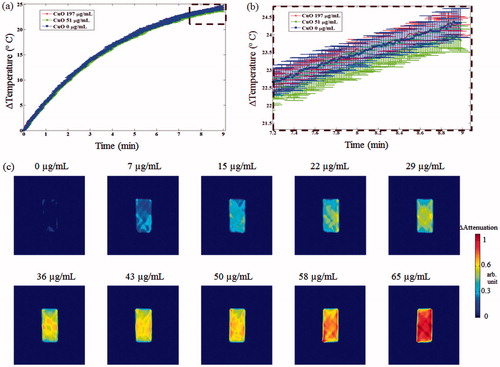
Initially, the influence of the CuO NPs on the MW-induced heating rate was examined using an in vitro setup (). A container of 51.3 mm length × 27.5 mm width × 77 mm height was filed with 58.3 ml of distilled water. A temperature sensor, the MW antenna and a stirrer were inserted through dedicated holes at the top lid. The container was inserted into the water tank of the ultrasonic scanner. MW heating of 100 W energy was then applied for 9 min, while recording the temperature. Upon completion of the heating stage the container was left to cool to the baseline room temperature (24.7 °C) and the process was repeated twice for injected CuO concentrations of 51 and 197 µg/ml, respectively. The experiment was repeated three times and the mean and standard deviation for each case were calculated. To demonstrate the benefit of using the CuO NPs for target detection, the same setup was scanned using the UCT mode for various concentrations of CuO (without MW irradiation). The imaged property was acoustic attenuation as it is more dominantly affected by CuO [Citation28].
Figure 2. The setup used for the NPs hyperthermia acceleration experiments. (a) Experimental setup used for CuO NPs setup, evaluating temperature changes as well as UCT enhancement. A stirrer was used to insure solution homogeneity, which contained consecutively increased concentration of CuO in water. A MW antenna applicator was activated while a temperature sensor provided reference measurements. (b) Two polypropylene tubes were filled with 5 ml of distilled water (left) and 5 ml of 404 µg/ml IO NPs (right). A MW antenna applicator was located 10.85 mm equidistance from each tube centre, in which a temperature sensor was fixed. The dashed rectangle marks the FOV for the acoustic projection images, acquired while heating.
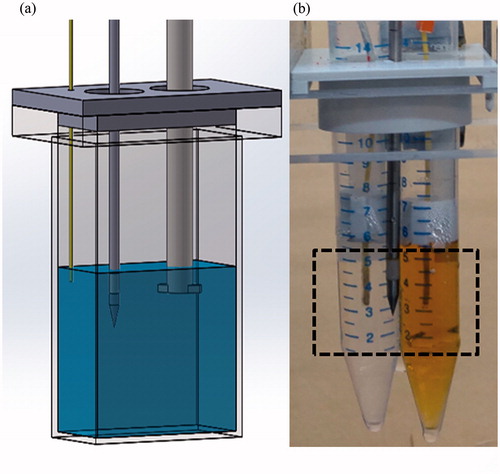
IO: IO NPs are commercially available and FDA approved for MRI [Citation37]. Recently, it was shown that IO NPs can serve as transmission ultrasound contrast enhancing agents, since they induce a linear increase in the SOS with their concentration [Citation29]. Magnetite IO NPs (Fe3O4) of 10 nm size in water were purchased (Sigma-Aldrich, Saint Louis, MO). Initially, the particles ability to accelerate the MW-induced temperature rise-time was examined, using an in vitro setup (). Two polypropylene tubes (14 mm inner diameter, 1.3 mm width) were filled with 5 ml of distilled water. A custom-built holder was used to attach the tubes to the MW antenna applicator, so that the needle was located 10.85 mm equidistance from each tube centre. A temperature sensor was positioned and fixed at the centre of each test tube. The described setup was then inserted into a water filled container, positioned atop a magnetic stirrer. MW heating of 100 W was applied for 5 min while recording the temperature in each tube. The process was repeated two additional times, with one tube containing only water and the other contained rising concentrations of IO NPs (200 and 400 µg/ml). The time-related temperature rise curve of the reference water tube was subtracted from that of the tube containing IO NPs for all time points. The experiment was repeated three times and the mean and standard deviation for each case were calculated.
To verify that the observed heating enhancement ability of the IO NPs can be detected using transmission ultrasound, acoustic projection imaging of the setup was also performed, while heated at a power of 100 W inside the ultrasonic container. The two tubes were initially imaged while heated, as both contained 5 ml of water. Next, the process was repeated after IO NPs were injected to the right tube (yielding a concentration of 404 µg/ml), and additional water of the same volume were injected to the left tube as a control. Scanning resolution was 0.25 mm × 2 mm, and the FOV was 38 × 29 mm (see the dashed rectangular marking in ). A total of six TOF images per case were obtained (a baseline image and five additional images during heating). To visually evaluate the heating speed difference between the two tubes, the baseline TOF in the left, water-only containing tube was calculated using a region of interest (ROI) of 348 pixels. All images were subtracted from the resulting value, yielding ΔTOF images.
Figure 3. Heterogeneous ex vivo breast imaging phantom, composed of poultry fat, poultry skin, agar and two 8 mm polyolefin embedded targets, containing water and NPs.
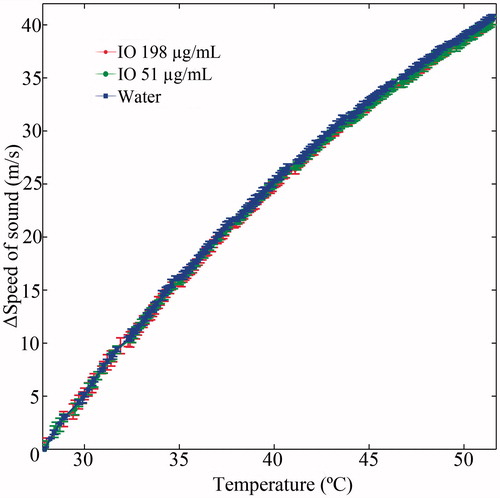
As mentioned above, increased concentration of IO NPs increases the SOS [Citation29]; therefore, to obtain accurate and quantitative temperature information, a modified SOS to temperature calibration is required. To demonstrate the acquisition of such a calibration curve in the presence of NPs, a one-dimensional ultrasound acquisition experiment was performed. The setup depicted in (water filled container, with a temperature sensor, a MW applicator and a stirrer) was positioned inside the ultrasonic container, between the two fixed transducers. Ultrasonic pulses were repeatedly transmitted from one side to the other (16A-line bursts with 1 KHz pulse repetition frequency, every 1 s). By averaging each burst and measuring the travel time, an estimation of the SOS in the container, for every 1 s of the experiment was obtained. MW heating of 100 W energy was simultaneously applied for 9 min, while recording the temperature. Upon completion of the heating stage, the container was left to cool to the baseline room temperature, and the process was repeated twice for injected IO concentrations of 51 and 198 µg/ml, respectively. The experiment was repeated three times and the mean and standard deviation in ΔSOS (with respect to the SOS prior to heating) for each case were calculated.
Breast phantom thermal treatment and monitoring procedure using NETUS
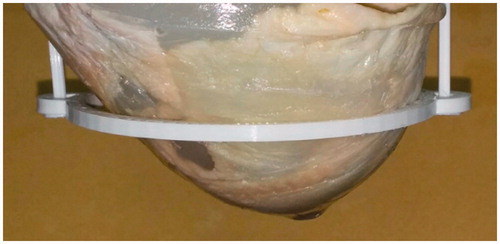
At the last part of the study, an entire two-step therapeutic procedure was studied, using the NETUS system. On the first step, NPs were injected, allowing increased target visualisation and marking of the area required for hyperthermia treatment. On the second step, the MW antenna was inserted into the target region, and the temperature increase was monitored using the transmission ultrasound scanner. A temperature sensor was inserted into the target area for later comparison. Since the target organ for NETUS is the breast, a heterogeneous breast tissue mimicking phantom was assembled, similarly to previous studies [Citation29,Citation38]. It contained agar (Difco, Sparks, MD), fresh poultry skin, subcutaneous fat and a fat target purchased at the local butchery (). Two polyolefin sleeve targets, each 8 mm in diameter (RSFR-H, Woer, Shenzhen, China) were also inserted into the phantom and filled with 4 ml of distilled water. The geometry of the phantom was shaped similarly to that of a human breast by using a mould of a commercially available breast phantom (BB-1; ATS laboratories, Bridgeport, CT). The experiment was performed twice, to demonstrate the utilisation of the two NPs-based examined compounds and the two imaging modes.
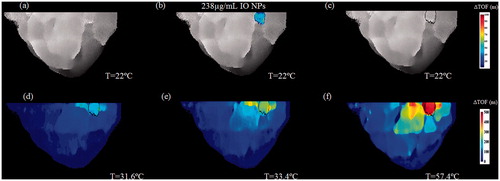
IO NPs injection and acoustic projection imaging: Initially, a baseline TOF-based acoustic projection image was acquired. The resolution was set to 0.25 mm × 0.5 mm, and the FOV was 140 mm × 40 mm. Next, IO NPs were injected to the right polyolefin target (yielding a concentration of 238 μg/ml). The same volume of water was injected to the left (control) target, followed by another scan. The IO containing target borders were detected using a Sobel edge detector. The MW antenna was then inserted into the detected target. The insertion was followed by a new baseline scan, which aimed to serve as a reference for the heating phase. Finally, MW heating was initiated and the power was gradually increased from 5 to 60 W. Simultaneously, three additional scans were performed. The changes in TOF were obtained by subtracting the acquired images from the relevant baseline and then presented as a coloured graphic overlay atop it.
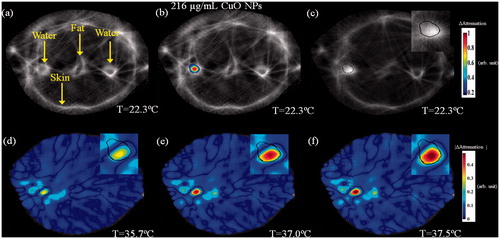
CuO NPs injection and UCT: The above-described process was repeated; however, this time the right polyolefin target contained water, whereas CuO NPs were injected to the left target, yielding a concentration of 216 μg/ml. During the heating phase, MW irradiation of 5 W was performed. The imaging mode was set to UCT, yielding acoustic attenuation-based cross-sectional images, and coloured graphic overlay depicting the attenuation changes, stemming from either NPs injection or temperature rise.
Results
Thermal imaging using transmission ultrasound
In vitro water thermal imaging
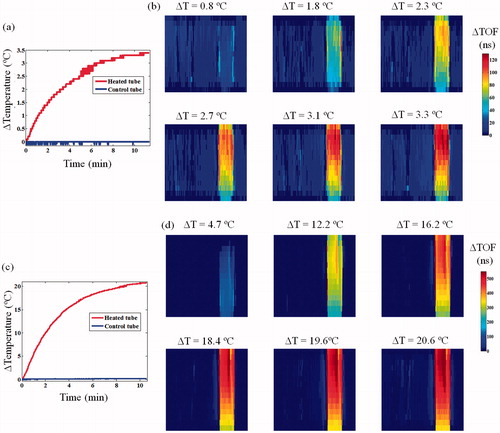
The heating curve, resulting from a 5 W MW irradiation in a 45 ml tube is displayed in . The respective acoustic projection images () allowed visual detection of the temperature change, stemming from the change in SOS (manifested in the ΔTOF value). Temperature changes smaller than 0.5 °C were well visualised. As expected, the control (left) tube did not present any TOF change. The TOF temperature-dependent effect was also well evident at the 60 W irradiation experiment (), in which the temperature reached 44.4 °C ().
Figure 4. Thermometric transmission ultrasound imaging of an in vitro setup composed of two test tubes, each containing a temperature sensor and a MW antenna in water. (a) The measured temperature change at the two tubes during the 5 W heating of the right tube. (b) Corresponding six ΔTOF images obtained during the heating. The numbers above each sub-image represent the temperature difference with respect to the baseline at the middle of the scan. Notice the consistent TOF shortening trend. (c) The measured temperature change at the two tubes during the 60 W heating of the right tube. (d) Corresponding six ΔTOF images obtained during the heating. Note the larger scaling on the colour-bar compared to (b), depiction of the much more pronounced ΔTOF, as expected.
Ex vivo poultry breast hyperthermia imaging
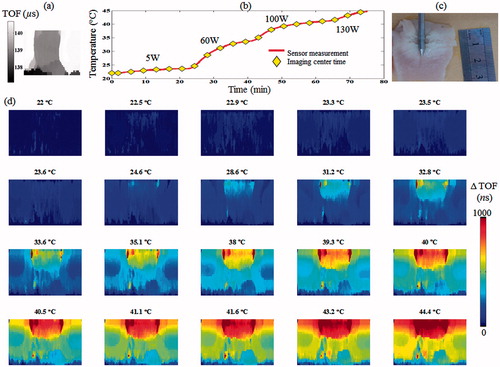
The baseline, TOF-based acoustic projection images of the specimen can be seen in . The MW gradually increased power resulted in a temperature rise from 21.9 to 44.7 °C (). The thermal dose administered throughout this experiment was calculated as 26 cumulative equivalent minutes at 43 °C (CEM43) [Citation39]. The acoustic projection images, acquired throughout the experiment, demonstrated a gradual increase in the ΔTOF, in accordance with the temperature rise in the heated region ().
Figure 5. Ex vivo poultry breast hyperthermia experiment. (a) Baseline acoustic projection image of the specimen prior to MW irradiation. (b) The measured temperature during the experiment. The MW energy was increased from 0 to 130 W using four levels. (c) A gross pathology section of the specimen following the experiment, note the white region at the top, corresponding to the heated zone. (d) ΔTOF acoustic projection images depicting the temperature change throughout the experiment. Note the gradual increase in the ΔTOF, corresponding to the temperature rise in the heated region.
Hyperthermia enhancement effect of the nano-sized contrast agents
IO NPs
The heating rate obtained in the presence of IO NPs was faster than that of water which served as a control, as shown in . Moreover, the heating enhancement effect was concentration dependent. In both the 200 and 400 μg/ml cases, the temperature rise obtained after 5 min of 100 W irradiation was significantly higher than that of the control water (t-test, p < 0.05). When the experiment was repeated inside the ultrasonic scanner, the trend repeated itself. Namely, the heating rate in the IO containing tube was faster than that of the water containing tubes (). The simultaneous imaging performed as both tubes were water filled, yielded a symmetrical heating profile, as expected (). After the IO NPs were injected to the right test tube, the SOS in this tube increased, allowing visual detection of the NPs (). During the 100 W heating phase (), the right (IO) tube yielded higher changes in the TOF than the left tube (control water), in agreement with sensor temperature measurements. The calibration curves of ΔSOS against temperature, obtained in the presence of IO NPs, are depicted in . As can be observed, the trend obtained for the two IO NPs concentrations highly resembles the trend obtained for the control water, indicating that the NPs have a minor effect in that sense.
Figure 6. IO NPs hyperthermia acceleration phenomenon. The test tubes setup depicted in was heated using 100 W power. The right tube contained rising concentrations of IO NPs, whereas the left tube contained water, and served as a control. Each of the three presented Δheat-rate curves represents the subtraction of the temperature vs. time curve of the control tube from the temperature vs. time curve of the IO respective tube (repeated three times for statistics). Notice the improved Δheat-rate, when the IO concentration is increased.
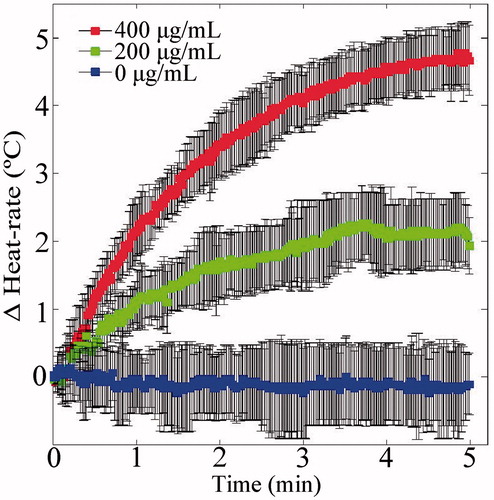
Figure 7. Transmission ultrasound imaging of the IO NPs hyperthermia augmentation phenomenon. (a) The temperature rise measured at the sensors during the heating-imaging experiment. The dash-dot (blue) and dotted (cyan) curves represent the temperature rise at the left and right test tubes as both contained water. The dashed (grey) and solid (orange) curves represent the temperature rise as the left and right test tubes were injected with the same volume of water and IO NPs, respectively. (b)–(g) Acoustic projection ΔTOF images obtained when the tubes contained water only. (h)–(m). Repeating the process after system cooling and injection of IO NPs to the right test tube (yielding a 404 µg/ml concentration), and the same volume of water to the left tube as a control. Notice the IO enhanced visualisation, due to its influence on the SOS in the baseline image (h). As MW irradiation occurred, the IO containing tube heated faster, manifested as ΔTOF increase.
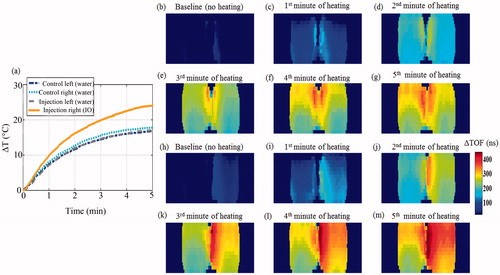
Figure 8. A calibration curve depicting the relation between the change in speed of sound ΔSOS stemming from temperature elevation of water and two IO-NPs aqueous solutions (with concentrations of 51 µg/ml and 198 µg/ml). As can be observed, the IO NPs curves are almost identical to that of water.
CuO NPs
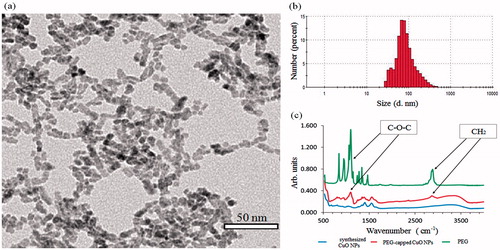
Preparation of CuO NPs was achieved by a facile process resulting in NPs with crystallite size of ∼7 nm, as estimated by TEM. The image showed a semi-organised assembly of particles in a chains-like array with constant spaces between the particles caused by steric hindrance of polymeric capping (). DLS analysis resulted in a 170 nm hydrodynamic diameter of the NPs (Z-average value) with a polydispersity index (PDI) of 0.215 (). The NPs exhibited a zeta-potential value of +17.8 mV at pH=6. The conjugation of PEG chains to CuO NPs surface was confirmed by FTIR spectroscopy. The spectrum exhibited characteristic stretching bands at 1100 and 2860 cm−1 of ether (C–O–C) and methylene (CH2) groups, respectively (). The spectra also presented carboxylate (COO–) asymmetric and symmetric stretching bands at 1550 and 1400 cm−1, respectively.
Figure 9. Characterizations of PEG-capped CuO NPs. (a) TEM image. (b) Size distribution measured by DLS (number mode). (c) FTIR spectra.
The MW irradiation in the water filled rectangular container yielded a temperature rise from 24.7 to 49.0 °C in 9 min (). The heating curve was highly similar for all examined cases and CuO concentrations, with no significant differences at MW power termination (). The UCT imaging of increasing CuO concentrations injected to the container (without heating) demonstrated a consistent contrast improvement, stemming from increased acoustic attenuation ().
Figure 10. CuO effect on MW heating rate and transmission ultrasound contrast. (a) Heating rate curves of CuO containing aqueous solutions. Notice the similarity between the three heating curves, as no distinct trend was apparent. (b) Zoom-in view on the dashed rectangular area of the graphs depicted in (a). (c) UCT acoustic attenuation images of increasing CuO concentrations, injected to the cuboid container. No MW irradiation was performed during these scans. Notice the concentration-dependent contrast improvement.
Breast phantom thermal treatment and monitoring using NETUS
The results of injecting IO NPs to the heterogeneous breast phantom and the subsequent thermal monitoring are displayed in . The IO NPs yielded unequivocal target detection, based on the SOS change. Conversely, the control water injected target did not yield any contrast change (). The detected target borders can be seen in . When MW irradiation was performed, the respective images demonstrated a gradual ΔTOF increase, stemming from the increase in SOS ().
Figure 11. A two-step image guided therapeutic procedure in a heterogeneous breast phantom, using IO-based NETUS. (a) Time-of-flight based baseline projection image of the phantom. (b) A colour overlay depicting the TOF-related changes atop the baseline image, stemming from IO NPs injection (238 µg/ml concentration). The same volume of water was injected to the second target as a control, which did not alter the image as expected. (c) Another baseline image, scanned after inserting the MW antenna to the detected target borders. A Sobel edge detector was used to mark the target outline using the detected NPs location (black line). (d–f) Temperature monitoring using TOF-based changes with respect to baseline image in (c). The displayed temperatures were measured at the target zone using a sensor at the beginning of each scan.
The UCT, attenuation-based cross-section images of the same breast phantom can be seen in . The baseline image is displayed in . Note the various embedded elements and tissue types. After injection of CuO NPs to the left target, it was easily detected and discerned from other targets (). The detected target borders can be seen in . When MW irradiation was performed, the temperature rise yielded a consistent attenuation decrease at the target zone (). Since the attenuation relation and trend with temperature are tissue dependent, an absolute attenuation value scale-bar was used.
Figure 12. A two-step image guided therapeutic procedure in a heterogeneous breast phantom, using CuO-based NETUS. (a) Acoustic attenuation based, UCT cross-section baseline image of the phantom. Note the various tissues and targets embedded. (b) A colour overlay depicting the attenuation related changes atop the baseline image, stemming from CuO NPs injection to the left water-in-polyolefin target. (c) Another baseline image, scanned after inserting the MW antenna to the detected target borders. A Sobel edge detector was used to mark the target outline, using the detected CuO NPs location (black line). (d–f). Temperature monitoring using attenuation-based changes with respect to the baseline image in (c). The displayed temperatures were measured at the target zone using a sensor, at the middle of each scan. The insets in images (c–f) are a zoom-in on the CuO injected, MW antenna inserted target area.
Discussion
In this study, the feasibility of using the combination of transmission ultrasound with NPs as an image-based monitoring modality for microwave hyperthermia treatment was established. In particular, the triple-benefit in MW thermal treatment was demonstrated. This includes: target detection, stemming from the induced effect of NPs on transmission ultrasound; accelerated heating effect, stemming from the interaction between the MW and the IO NPs and non-invasive thermal monitoring provided by the transmission ultrasonic imaging. Conclusively, NETUS potentially provides a new research path and may lead to the development of new clinical tools for treating tumours.
In the first part of the experiments, the ultrasonic system thermometry capability was confirmed. MW irradiation yielded a SOS rise, manifested as a ΔTOF increase effect in the acoustic projection images. This monotonic trend is typical to water and the tissues used, at the mild-hyperthermia range examined (less than 45 °C). At higher temperatures the trend may be altered due to tissue ablation as well as due to the inherent nonlinear SOS–temperature relations. Although exact thermometry in this case may be more challenging, a SOS derivative-based analysis may allow ablation onset detection, as previously suggested in reference [Citation19].
In the second part of the experiments, IO and CuO NPs were investigated as accelerated heating effect agents. In agreement with a recent study [Citation32], IO particles were found to be suitable to serve as MW heat sensitisers. In other words, the NPs accelerated the temperature rise in the target region, relative to the rise produced without them. It should be noted that the NPs concentration range used in this work is several times lower and more clinically relevant than that examined in earlier work [Citation31,Citation32]. Hence, future feasibility of using the particles in an in vivo setup is deemed reasonable [Citation40]. CuO NPs, on the other hand, did not yield any significant change in the heating rate when exposed to MW radiation.
The contrast enhancing ability of IO NPs in transmission ultrasound imaging was also demonstrated (), and was in agreement with a recently published work [Citation29]. The effect stems from the SOS increase in the region containing the NPs. Although CuO NPs may affect the SOS property as well, their main effect in this context is acoustic attenuation increase, as demonstrated in the UCT cross-sectional images (). This quality may potentially be beneficial when considering acoustic heating such as HIFU instead of MW.
To obtain accurate and quantitative thermometry while using NPs, a relevant SOS against temperature calibration curve must be used. Although the injection of IO NPs increases the SOS, it was demonstrated () that the ΔSOS curve with respect to temperature remains unaltered. In other words, NPs administration results in a fixed offset to every SOS point of in the calibration curve. This offset can be corrected by evaluating the SOS increment immediately post injection (prior to heating) and later subtracting the constant shift from each new SOS value obtained during the heating phase. It should be noted that the demonstrated calibration curve () was obtained in an aqueous solution. For in vivo studies, various relevant tissue calibration curves should be prepared, as was previously performed for non-NPs-injected tissues [Citation24].
Several additional challenges may occur in the clinical setting. These include heat rate reduction due to blood flow in nearby vessels [Citation41] (it should be recalled, that this also occurs without the presence of the NPs), insufficient NPs distribution in the target region, and biocompatibility related issues. Potential solutions include attaching a targeting agent to the NPs, to increase delivery efficiency to the tumour and utilising cloaking materials (such as polymers and liposomes), which may mitigate potential toxicity. In that context, it should be noted that various evaluations of the safety in using IO NPs were previously performed (e.g. in [Citation42]), resulting in clinical usage approval for MRI. CuO NPs, on the other hand, must be well investigated for potential toxicity issues, and mechanisms for ensuring their rapid accumulation in the tumour without compromising healthy tissues are yet to be pursued.
In the last part of the experiments, a therapeutic procedure was demonstrated on a breast mimicking phantom. First, target detection by the NPs and transmission ultrasound scans were confirmed by injecting the NPs into the target region (for both IO and CuO). This may be crucial in a clinical setup, in which tumour localisation has to be validated for precise MW antenna insertion. The unique benefit of NPs over conventional contrast agents is their inherent increased tumour accumulation property, known as the enhanced permeability and retention effect (EPR) [Citation43]. In addition, the geometrical boundaries of the area to be treated have to be well defined. These boundaries were overlaid atop the images obtained in the following scans, which monitored the temperature changes during MW irradiation ( and ). Using such visualisation, the clinician may obtain a continuous visual feedback on the therapeutic procedure progress and can verify that the entire tumour was heated, as can be done by the much more expensive MRI [Citation44]. Also, the procedure has to be sufficiently accurate to verify that the temperature threshold at the healthy tissues was not exceeded. For example, in the CuO-injected MW experiment, the highest heated region did not fill the entire contour of the detected target (). In such case, the clinician may decide to slightly move the MW applicator or increase the deployed heating energy. As also demonstrated, the highest temperature rise indeed occurred within the target region. Nevertheless, the heat dissipated continuously in a large area around the target (). This stresses the necessity of using an image guided method to monitor the hyperthermia effect, in contrast to using a single or multiple invasive temperature sensors.
The heating effect at the target region of the breast phantom was evident by both SOS related imaging and by acoustic attenuation based imaging. It should be noted that the target region was mainly composed of NP-containing aqueous solution. In water, the acoustic attenuation trend is monotonously decreasing in the 37–45 °C range [Citation45]. In tissues, however, the trend of attenuation dependence on temperature at the hyperthermia range may be mild [Citation46]. Thus, SOS-based imaging may provide a more sensitive approach for monitoring thermal therapy in the hyperthermia range.
The transmission ultrasound setup used in this work () has inherent similarities to the setup used in some clinically performed microwave breast heating procedures [Citation1]. In both cases, the patient lies prone, with the breast inserted through a hole in the bad. The experimental setup may include compression plates at two sides of the breast and an acoustic window for ultrasound imaging [Citation47]. Therefore, acoustic projection imaging could be easily integrated in such a setup. To perform UCT at the presence of compression plates, the acoustic window has to be widened to include the entire breast perimeter, with the height dimension of the target tumour and some safety margins.
The UCT acquisition mode provides the investigated acoustical property per pixel (SOS or attenuation coefficient) and is not dependent on the target dimension. Conversely, the values in the acoustic projection image are inherently dependent on the target size. Namely, to extract the exact temperature from the ΔTOF or the ΔAttenuation value, one has to obtain the target length along the transmission line direction. This can be obtained from a baseline UCT scan, mapping the object tissues and dimensions prior to starting the therapeutic procedure.
The experiment performed here demonstrated a minimal spatial resolution of 0.3 mm × 0.3 mm using the UCT mode, and 0.25 × 0.5 mm resolution using the acoustic projection mode. The minimal temperature resolution demonstrated for detection was less than 0.5 °C (without the presence of NPs). Previous reports indicated that the temperature dependence of SOS on tissue temperature will yield transmission ultrasound resolution of around 0.3 °C, which is at the same range of the results obtained here [Citation48], and is suitable for clinical hyperthermia monitoring [Citation49].
The temporal resolution of the custom-made ultrasonic system used for this study was too low for clinical application, as each scan took more than a minute (and was FOV dependent). However, other commercially available UCT systems were reported to have much faster acquisition times, for example, 0.1 s per image [Citation50].
As can be inferred from the experiments conducted here, IO NPs provide an added value with their hyperthermia accelerating effect, when MW heating is concerned. This may reduce treatment time and improve patient comfort. Additional advantage of IO NPs is their FDA approval (for MRI purposes), rendering it easier to advance the NETUS IO-based methodology to preclinical examinations and later to clinical trials.
Although CuO NPs did not exhibit a hyperthermia accelerating effect when heated by MW, it was previously shown that CuO NPs can yield anti-cancer therapeutic effects. They can induce cell death in human breast cancer cells, and reduce Dalton lymphoma tumour size in mice [Citation51]. This chemical effect may be complementary to hyperthermia, and possibly augment the complete treatment response.
Although MRI is considered as the most mature modality for thermal therapy guidance, the NETUS methodology described in this work may provide a significantly more cost-effective alternative. It shall be noted that an FDA-approved UCT system is commercially available [Citation52] and so are the IO NPs.
Future work should also include MW antenna detection and insertion guidance using the transmission ultrasound system. Although the needle yields an increase in attenuation, it may be more easily be detected using the pulse–echo (B-scan) mode, which maps the tissue backscatter property. There is no technical obstacle that may prevent the simultaneous acquisition of both transmitted and echo signals. Hence, the commonly used B-scan imaging can be incorporated in the NETUS system as well.
Conclusions
The feasibility of using the NETUS system for non-invasive MW hyperthermia monitoring was demonstrated, yielding a clearly visible temperature-dependent image alteration effect. The NPs presence combined with transmission ultrasound provided a means for having a comprehensive therapeutic procedure, comprising target detection, accelerated heating rate and non-invasive thermometry.
Acknowledgements
The authors wish to thank Aharon Alfasi, Hod Gilad, Roana Schiopu, Amichai Geva and Alex Borodetsky for their technical assistance. Additional thanks to Shem-Tov Halevy for his support in the mechanical design and manufacturing of several mechanical parts in the research system.
Disclosure statement
The authors report no conflicts of interest. The authors alone are responsible for the content and writing of the paper.
Additional information
Funding
Related Research Data
References
- Bitton RR, Daniel BL, Pauly KB. (2013). Breast ablation: breast carcinoma, fibroadenomas. Interventional radiology techniques in ablation. London: Springer, 73–95.
- Maluta S, Kolff MW. (2015). Role of hyperthermia in breast cancer locoregional recurrence: a review. Breast Care 10:408–12.
- Zagar TM, Vujaskovic Z, Formenti S, et al. (2014). Two phase I dose-escalation/pharmacokinetics studies of low temperature liposomal doxorubicin (LTLD) and mild local hyperthermia in heavily pretreated patients with local regionally recurrent breast cancer. Int J Hyperthermia 30:285–94.
- Datta NR, Puric E, Klingbiel D, et al. (2016). Hyperthermia and radiation therapy in locoregional recurrent breast cancers: a systematic review and meta-analysis. Int J Radiat Oncol Biol Phys 94:1073–87.
- van der Zee J, van der Holt B, Rietveld P, et al. (1999). Reirradiation combined with hyperthermia in recurrent breast cancer results in a worthwhile local palliation. Br J Cancer 79:483.
- Linthorst M, Baaijens M, Wiggenraad R, et al. (2015). Local control rate after the combination of re-irradiation and hyperthermia for irresectable recurrent breast cancer: results in 248 patients. Radiother Oncol 117:217–22.
- Rieke V, Butts Pauly K. (2008). MR thermometry. J Magn Reson Imaging 27:376–90.
- Vitkin I, Moriarty J, Peters R, et al. (1997). Magnetic resonance imaging of temperature changes during interstitial microwave heating: a phantom study. Med Phys 24:269–77.
- Lewis MA, Staruch RM, Chopra R. (2015). Thermometry and ablation monitoring with ultrasound. Int J Hyperthermia 31:163–81.
- Weiss N, Sosna J, Goldberg SN, Azhari H. (2014). Non-invasive temperature monitoring and hyperthermic injury onset detection using X-ray CT during HIFU thermal treatment in ex vivo fatty tissue. Int J Hyperthermia 30:119–25.
- Wang CY, Geng X, Yeh TS, et al. (2013). Monitoring radiofrequency ablation with ultrasound Nakagami imaging. Med Phys 40:072901-1–12.
- Subramanian S, Rudich SM, Alqadah A, et al. (2014). In vivo thermal ablation monitoring using ultrasound echo decorrelation imaging. Ultrasound Med Biol 40:102–14.
- Gudur MSR, Kumon RE, Zhou Y, Deng CX. (2012). High-frequency rapid B-mode ultrasound imaging for real-time monitoring of lesion formation and gas body activity during high-intensity focused ultrasound ablation. IEEE Trans Ultrason Ferroelect Freq Control 59:1687–99.
- Pouch AM, Cary TW, Schultz SM, Sehgal CM. (2010). In vivo noninvasive temperature measurement by B‐mode ultrasound imaging. J Ultrasound Med 29:1595–606.
- Curiel L, Chopra R, Hynynen K. (2009). In vivo monitoring of focused ultrasound surgery using local harmonic motion. Ultrasound Med Biol 35:65–78.
- Arnal B, Pernot M, Tanter M. (2011). Monitoring of thermal therapy based on shear modulus changes: I. shear wave thermometry. IEEE Trans Ultrason Ferroelect Freq Control 58:369–78.
- Foiret J, Ferrara KW. (2015). Spatial and temporal control of hyperthermia using real time ultrasonic thermal strain imaging with motion compensation, phantom study. PLoS One 10:e0134938.
- Zhang S, Zhou F, Wan M, et al. (2012). Feasibility of using Nakagami distribution in evaluating the formation of ultrasound-induced thermal lesions. J Acoust Soc Am 131:4836–44.
- Azhari H. (2012). Feasibility study of ultrasonic computed tomography–guided high-intensity focused ultrasound. Ultrasound Med Biol 38:619–25.
- Ruiter NV, Zapf M, Hopp T, et al. (2012). 3D ultrasound computer tomography of the breast: a new era? Eur J Radiol 81:S133–S4.
- Li C, Duric N, Littrup P, Huang L. (2009). In vivo breast sound-speed imaging with ultrasound tomography. Ultrasound Med Biol 35:1615–28.
- Duric N, Littrup P, Babkin A, et al. (2005). Development of ultrasound tomography for breast imaging: technical assessment. Med Phys 32:1375–86.
- Azhari H, Sazbon D. (1999). Volumetric imaging with ultrasonic spiral CT 1. Radiology 212:270–5.
- Bamber JC, Hill C. (1979). Ultrasonic attenuation and propagation speed in mammalian tissues as a function of temperature. Ultrasound Med Biol 5:149–57.
- Hopp T, Ruiter NV, Duric N. (2012). Breast tissue characterization by sound speed: correlation with mammograms using a 2d/3d image registration. IEEE International Ultrasonics Symposium (IUS), 2012. IEEE; 1–4
- Hahn MA, Singh AK, Sharma P, et al. (2011). Nanoparticles as contrast agents for in-vivo bioimaging: current status and future perspectives. Anal Bioanal Chem 399:3–27.
- Qiao R, Yang C, Gao M. (2009). Superparamagnetic iron oxide nanoparticles: from preparations to in vivo MRI applications. J Mater Chem 19:6274–93.
- Perlman O, Weitz IS, Azhari H. (2015). Copper oxide nanoparticles as contrast agents for MRI and ultrasound dual-modality imaging. Phys Med Biol 60:5767.
- Perlman O, Azhari H. (2017). Ultrasonic computed tomography imaging of iron oxide nanoparticles. Phys Med Biol 62:825.
- Iyer AK, Khaled G, Fang J, Maeda H. (2006). Exploiting the enhanced permeability and retention effect for tumor targeting. Drug Discov Today 11:812–18.
- García-Jimeno S, Ortega-Palacios R, Cepeda-Rubio MFJ, et al. (2012). Improved thermal ablation efficacy using magnetic nanoparticles: a study in tumor phantoms. Prog Electromagn Res 128:229–48.
- Kim K, Seo T, Sim K, Kwon Y. (2016). Magnetic nanoparticle-assisted microwave hyperthermia using an active integrated heat applicator. IEEE Trans Microw Theory Techn 64:2184–97.
- Miller NR, Bamber JC, Meaney PM. (2002). Fundamental limitations of noninvasive temperature imaging by means of ultrasound echo strain estimation. Ultrasound Med Biol 28:1319–33.
- Datta N, Ordóñez SG, Gaipl U, et al. (2015). Local hyperthermia combined with radiotherapy and-/or chemotherapy: recent advances and promises for the future. Cancer Treat Rev 41:742–53.
- Rothstein T, Gaitini D, Gallimidi Z, Azhari H. (2010). Investigation of acoustic changes resulting from contrast enhancement in through-transmission ultrasonic imaging. Ultrasound Med Biol 36:1395–404.
- Weitz IS, Maoz M, Panitz D, et al. (2015). Combination of CuO nanoparticles and fluconazole: preparation, characterization, and antifungal activity against Candida albicans. J Nanopart Res 17:342.
- Zhu L, Zhou Z, Mao H, Yang L. (2017). Magnetic nanoparticles for precision oncology: theranostic magnetic iron oxide nanoparticles for image-guided and targeted cancer therapy. Nanomedicine 12:73–87.
- Sandhu GYS, Li C, Roy O, et al. (2016). Frequency-domain ultrasound waveform tomography breast attenuation imaging. Proc SPIE 9790:97900C1–12.
- Sapareto SA, Dewey WC. (1984). Thermal dose determination in cancer therapy. Int J Radiat Oncol Biol Phys 10:787–800.
- Crowe L, Tobalem F, Gramoun A, et al. (2012). Improved dynamic response assessment for intra-articular injected iron oxide nanoparticles. Magn Reson Med 68:1544–52.
- Park WKC, Maxwell AWP, Frank VE, et al. (2017). The in vivo performance of a novel thermal accelerant agent used for augmentation of microwave energy delivery within biologic tissues during image-guided thermal ablation: a porcine study. Int J Hyperthermia [Epub ahead of print]. doi: 10.1080/02656736.2017.1317367
- Kehagias DT, Gouliamos AD, Smyrniotis V, Vlahos LJ. (2001). Diagnostic efficacy and safety of MRI of the liver with superparamagnetic iron oxide particles (SH U 555 A). J Magn Reson Imaging 14:595–601.
- Brigger I, Dubernet C, Couvreur P. (2002). Nanoparticles in cancer therapy and diagnosis. Adv Drug Deliv Rev 54:631–51.
- van den Bosch M, Daniel B, Rieke V, et al. (2008). MRI‐guided radiofrequency ablation of breast cancer: preliminary clinical experience. J Magn Reson Imaging 27:204–8.
- Pinkerton J. (1949). The absorption of ultrasonic waves in liquids and its relation to molecular constitution. Proc Phys Soc Sect B 62:129.
- Arthur R, Straube W, Trobaugh J, Moros E. (2005). Non-invasive estimation of hyperthermia temperatures with ultrasound. Int J Hyperthermia 21:589–600.
- Gardner RA, Vargas HI, Block JB, et al. (2002). Focused microwave phased array thermotherapy for primary breast cancer. Ann Surg Oncol 9:326–32.
- Cetas TC. (1984). Will thermometric tomography become practical for hyperthermia treatment monitoring? Cancer Res 44:4805s–8s.
- Chu W, Staruch RM, Pichardo S, et al. (2016). Magnetic resonance–guided high-intensity focused ultrasound hyperthermia for recurrent rectal cancer: MR thermometry evaluation and preclinical validation. Int J Radiat Oncol Biol Phys 95:1259–67.
- Duric N, Littrup P, Poulo L, et al. (2007). Detection of breast cancer with ultrasound tomography: first results with the omputed Ultrasound Risk Evaluation (CURE) prototype. Med Phys 34:773–85.
- Laha D, Pramanik A, Chattopadhyay S, et al. (2015). Folic acid modified copper oxide nanoparticles for targeted delivery in in vitro and in vivo systems. RSC Adv 5:68169–78.
- Duric N, Littrup P, Schmidt S, et al. (2013). Breast imaging with the SoftVue imaging system: first results. Proc SPIE 8675:86750K. doi: 10.1117/12.2002513