
Abstract
Purpose: The cardiovascular (CV) system plays a vital role in thermoregulation. To date, the response of core vasculature to increasing core temperature has not been adequately studied in vivo. Our objective was to non-invasively quantify the arterial response in murine models due to increases in body temperature, with a focus on core vessels of the torso and investigate whether responses were dependent on sex or age.
Methods: Male and female, adult and aged mice were anaesthetised and underwent magnetic resonance imaging (MRI). Data were acquired from the circle of Willis (CoW), heart, infrarenal aorta and peripheral arteries at core temperatures of 35, 36, 37 and 38 °C (±0.2 °C).
Results: Vessels in the CoW did not change. Ejection fraction decreased and cardiac output (CO) increased with increasing temperature in adult female mice. Cross-sectional area of the aorta increased significantly and linearly with temperature for all groups, but at a diminished rate for aged animals (p < 0.01; male and female: adult, 0.019 and 0.024 mm2/°C; aged, 0.017 and 0.011 mm2/°C). Aged male mice had a diminished response in the periphery (% increase in femoral artery area from 35 to 38 °C, male and female: adult, 67 and 65%; aged, 0.1 and 57%).
Conclusion: Previously unidentified increases in aortic area due to increasing core temperature are biologically important because they may affect conductive and convective heat transfer. Leveraging non-invasive methodology to quantify sex and age dependent vascular responses due to increasing core temperature could be combined with bioheat modelling in order to improve understanding of thermoregulation.
Introduction
Core temperature impacts human health and performance [Citation1–5]. Humans maintain core temperature via the process of thermoregulation [Citation6]. The body utilises two pathways to achieve this homeostasis. The passive system includes heat conduction through tissues and convective heat transfer via the cardiovascular (CV) system (forced) and from the skin’s surface to the environment (natural). The active system includes changes in cardiac output (CO), vasodilation or constriction, sweating, and shivering [Citation7]. The CV system plays an essential role in both systems. However, it remains unclear how the allocation of blood in various compartments (e.g. core, fat, muscle and skin) changes with temperature [Citation8,Citation9]. Early work suggested skin was the primary compartment in which increases in blood flow occurred when core temperature was increased [Citation10], but it has also been demonstrated that there are increases to the muscle with increased temperature [Citation11–15]. Sex and age not only influence the body’s ability to perceive and respond to changes in temperature [Citation5,Citation16–20], they also affect the function of the CV system [Citation21–24]. Therefore, to fully understand the CV system’s role in the complex process of thermoregulation, blood distribution (influenced by CO, vessel size, blood flow velocity and pressure) must be quantified, ideally across sex and age.
Because it is easily accessible, changes in the skin due to temperature have been quantified using numerous methods [Citation25–27]. It is more difficult to quantify changes in the other compartments, with the core perhaps being the most challenging to investigate due to the impact of invasive methods on core tissues. Observed CV changes in the core due to increasing core temperature include: regional increases and decreases in cerebral blood flow depending on the temperature range [Citation28–30], increased CO [Citation31,Citation32], and decreased total peripheral resistance [Citation31,Citation33]. Noticeably absent from this body of knowledge is data regarding if there are geometric and functional changes in the core vessels of the torso, the primary large-caliber supply system that transports blood at higher temperatures to the small-caliber distribution system located throughout the body. Mathematical modelling has been used as an alternative approach. However, barriers remain to this methodology reaching its full potential. Even Pennes pivotal bioheat equation has limitations [Citation34], including overlooking contributions from large blood vessels, and there is a lack of empirical values describing geometric or hemodynamic characteristics of core vasculature which could assist in model parameterisation and validation [Citation34,Citation35]. Consequently, there remains an inability to quantify or model the coalescing vascular changes in the CV system due to changes in core temperature.
Magnetic resonance imaging (MRI) can be used to non-invasively study core vasculature due to high spatial resolution and few limitations on tissue penetration depth. Temporal resolution can be leveraged to study processes that change across the cardiac cycle. Rodent models are often used to study thermoregulation because of the potential to manipulate relevant genes and to vary core temperature and/or environment while making the necessary measurements [Citation36]. Previous in vitro studies do not include the influence of surrounding structures which affect vascular biomechanical forces and subsequent health of the CV system and which are important in modelling [Citation37]. Surrounding structures and blood also act as heat sources/sinks [Citation38], and thus, it is important that whole-body thermoregulation studies be conducted in vivo.
Using murine models and MRI, we noninvasively quantified cardiac indices of left ventricular function and changes in the cerebral, infrarenal and peripheral arteries at four target core temperatures. The effects of sex and age on the CV response to increasing temperature from minimally hypothermic to minimally hyperthermic were measured. We hypothesised that as core temperature was increased from 35 to 38 °C: (1) cerebral vasculature and the aorta would not change; (2) CO would increase; (3) peripheral vasculature would dilate; and (4) responses would differ based on sex and age. To our knowledge, these data are the first to empirically quantify the spatially and temporally resolved response of core vasculature to changes in core temperature in vivo from head-to-toe. This geometric and functional data could be used to couple bioheat modelling and computational fluid dynamics (CFD) in order to improve understanding of thermoregulation.
Methods
All experiments were approved by the local Institutional Animal Care and Use Committee. Animals were housed in a room with temperature (22 °C ± 2 °C) and humidity (∼27%) control and an alternate 12 h light/dark cycle.
Healthy adult (10–22 weeks-old, ∼20–30 human years) and aged (50–60 weeks-old, ∼45–50 human years [Citation39]), male and female, C57BL/6 mice were studied (n = 5 each, total = 20). Mice were anaesthetised with 1.25–2% isoflurane in 1 L/min of oxygen [Citation40]. Animals were placed in the supine position and imaged at 7 T (Agilent Technologies, Santa Clara, CA) using a 40 mm inner diameter transmit-receive volume coil (Morris Instruments, Ontario, Canada). Core temperatures were increased from being minimally hypothermic (35 °C) to minimally hyperthermic (38 °C), while avoiding pathological changes [Citation41,Citation42]. The target core temperature was controlled via forced convection within ±0.2 °C using a custom-built proportional-integral-derivative (PID) controller (Labview, National Instruments, Austin, TX) interfaced with a commercially available system which includes a heater blowing warm air through the bore of the magnet and over the animal and a rectal temperature probe. PID controllers are used to efficiently approach a desired setpoint, while managing overshoot and oscillations. Respiration and heart rate were monitored (SA Instruments, Stony Brook, NY).
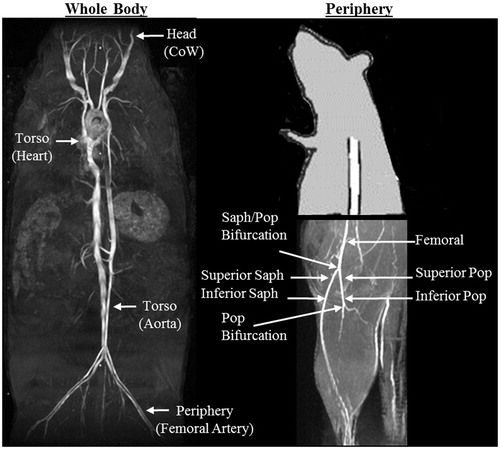
Two MRI techniques [time-of-flight (TOF) MR angiography and CINE imaging] were used to investigate three anatomical regions of interest: the head, torso and periphery (). To acquire all locations for a given animal, with four core temperatures tested at each location, three imaging sessions (head, torso and periphery) were required. The total imaging time for each session was approximately 2 h. Each region was completed for all animal groups within two weeks before acquiring data from the next region; therefore, ages ranged 1–2 weeks within a region and 2–8 weeks between regions.
Figure 1. (A) Coronal maximum intensity projection (MIP) illustrates where data were acquired and quantified from four anatomical locations along the body of adult and aged, male and female murine models. (B) Sagittal partial MIP illustrates where data were acquired and quantified in the periphery. CoW = circle of Willis, Saph = saphenous, Pop = popliteal.
Head: Circle of Willis (area)
Sagittal 2 D gradient echo images were used to plan 3 D TOF angiograms [repetition time/echo time (TR/TE) 50/3 ms, field of view (FOV) (20 mm)3, flip angle (α) 60°, matrix 1283 zero-filled to 2563, slab thickness 20 mm, number of excitations (NEX) 2, resolution (78 µm)3, ∼13 min]. The axial and sagittal 2 D slices derived from the 3 D TOF data were used to quantify the cross-sectional area of anterior cerebral arteries (ACA) and middle cerebral arteries (MCA), respectively, using a threshold value (Analyse, Analyse Direct, Stilwell, KS). Data acquired at 38 °C were used to establish a separate threshold value for each mouse that defined the area of the vessel based on user judgement. This threshold value was then used to analyse data for the other three temperatures. The location examined for both the ACA and MCA was 0.39 mm (5 slices) distal from the CoW ring ().
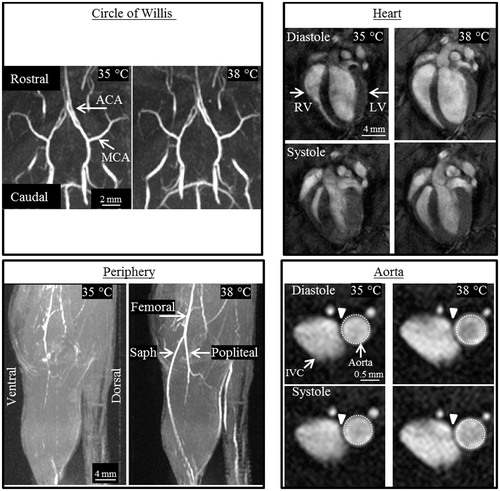
Figure 2. Representative images from the four anatomical locations of an adult male mouse, acquired at 35 and 38 °C. Circle of Willis (CoW): Coronal (top) and sagittal (bottom) maximum intensity projections (MIPs) showing no qualitative difference in the CoW. Area of the middle (MCA) and anterior (ACA) cerebral artery remained constant as temperature increased. Heart: Long axis view of the heart at end-diastole and end-systole shows an increase in the volume of the right (RV) and left ventricle (LV) for both cardiac phases at higher core temperature. Periphery: Sagittal partial MIPs of hindlimb. The conspicuity of the femoral, saphenous (saph), and popliteal arteries increases with increased temperature due to an increase in vessel area and potentially blood velocity. Aorta: Cross-sectional view of the infrarenal aorta and inferior vena cava (IVC) with the same-sized region of interest around the aorta at diastole and systole. Average cross-sectional area of the aorta increased significantly and linearly with increasing temperature.
Torso: Heart (heart rate, stroke volume, ejection fraction and cardiac output)
Heart rate was measured from a 2-lead ECG placed along axis II. Coronal 2 D images were used to plan slices perpendicular to the long axis of the left ventricle (LV). Five to six 2 D contiguous slices were planned through the LV, depending on the size of the organ. For each slice, a cardiac-gated and respiratory compensated 2 D CINE acquisition with 12 frames was used to acquire data across the cardiac cycle [TR/TE 180/2 ms, FOV (30 mm)2, α 30°, matrix 1282 zero-filled to 2562, slice thickness 1 mm, NEX 4, resolution (117 µm)2, ∼20 min]. The endocardial area of each frame was defined manually (Analyze, AnalyzeDirect, Stilwell, KS). For each slice, the end-diastolic and end-systolic areas were determined by selecting the maximum and minimum areas, respectively. The end-diastolic volume (EDV) and end-systolic volume (ESV) were calculated:
(1)
Stroke volume (SV = EDV–ESV), ejection fraction (SV/EDV*100%), and CO (SV*heart rate) were calculated from these values.
Torso: Infrarenal aorta (area, circumferential cyclic strain)
Coronal maximum intensity projections (MIPs) from axial 3 D acquisitions were used to plan slices perpendicular to the aorta. A cardiac-gated and velocity compensated 2 D CINE acquisition with 12 frames was used to acquire data across the cardiac cycle [TR/TE ∼120/4 ms depending on heart rate, FOV (20 mm)2, α 60°, matrix 2562 zero-filled to 5122, slice thickness 1 mm, NEX 6, resolution (39 µm)2, ∼18 voxels across the vessel, ∼5 min]. The CINE images were analysed for area and circumferential cyclic strain using an in-house semi-automated process. An automatic boundary of the vessel was defined by using a threshold value of 50% of the maximum signal intensity in a user-defined region selected across the 12 frames. This boundary could be modified by the user, if needed. Vessel area was calculated using polar integration. Green-Lagrange circumferential cyclic strain, to quantify vessel stiffness [Citation43], was calculated using the following equation:
(2)
where Pi is the perimeter at a given time frame and Pdias is the perimeter of the vessel at end diastole. This definition assumes uniform strain around the circumference and the in vivo diastolic perimeter is representative of the vessel’s unloaded state. Green-Lagrange circumferential strain can reflect changes in area, provided the vessel's expansion preserves its shape. In this case, a strain value of 50% corresponds to a doubling of cross-sectional area during the cardiac cycle.
Periphery: Femoral, popliteal and saphenous arteries (area, tracking length)
Coronal and axial 2 D gradient echo images were used to plan 3 D TOF angiograms [TR/TE 15/2 ms, FOV 25 × 35 × 35 mm3, α 20°, matrix 1283 zero-filled to 2563, slab thickness 30 mm, NEX 2, resolution 98 × 137 × 137 µm3, ∼13, 9 and 5 voxels across femoral, popliteal, and saphenous arteries, ∼8 min]. Similar to the CoW, 2 D slices from the 3 D TOF acquisitions were used to quantify the cross-sectional area of the peripheral arteries using a threshold value defined from data acquired at 38 °C. Three locations of the peripheral arteries were examined (): femoral 0.68 mm (five slices) proximal to the saphenous-popliteal bifurcation, popliteal and saphenous 0.68 mm distal to the saphenous-popliteal bifurcation (superior) and popliteal and saphenous 0.68 mm proximal to popliteal bifurcation (inferior). The tracking length over which the saphenous artery could be visualised in the 3 D acquisitions was determined by using the same threshold value as the area calculations and calculating the number of slices between the saphenous-popliteal bifurcation and the last slice for which the saphenous vessel could be seen.
Vessel conspicuity in 3 D TOF angiograms is dependent on blood flow velocity as well as vessel size. While 2 D acquisitions still rely on the movement of blood for contrast relative to stationary tissue, they are nearly independent of blood flow velocity. Therefore, to evaluate the contribution of blood flow velocity to visualisation of peripheral vessels, a second group of adult male mice (14–15 weeks-old, n = 5) were imaged using 2 D slices perpendicular to the femoral artery and the popliteal and saphenous arteries at the superior location. The 2 D TOF sequence was qualitatively optimised to maximise the contrast between vessel and surrounding stationary tissue and achieve a minimum of ∼10 voxels across each vessel at 38 °C [femoral: TR/TE 50/5 ms, FOV (25.6 mm)2, α 60°, matrix 2562 zero-filled to 5122, slice thickness 1 mm, NEX 8, resolution (50 µm)2, ∼3 min; popliteal and saphenous locations: TR/TE 20/3.4 ms, FOV (25.6 mm)2, α 60°, matrix 2562 zero-filled to 5122, slice thickness 1 mm, NEX 4, resolution (50 µm)2, ∼1 min]. To null the signal from veins, a 5 mm thick saturation band was placed distal to the imaging slice. Locations were similar to those described above. Data acquired at 38 °C were used to establish a threshold value that defined the size of the vessel based on user judgement and that was used for data at 35 °C.
Statistical analysis
Data are plotted as mean ± standard error (SEM) with individual data points. To test whether temperature had an effect on a given metric within a group of animals, repeated measures one-way ANOVA and Tukey’s post hoc test to account for multiple comparisons was used, with temperature treated as categorical. Two methods were used to evaluate differences between groups. First, to compare relative changes within a given one degree temperature interval (i.e. 35–36, 36–37 or 37–38 °C), the percent change per one degree increase in temperature (%/°C) was calculated for each metric to account for potential differences in the size of anatomical structures between groups. For example, percent change in vessel area in adult male mice for the interval 35–36 °C = (area36 − area35)/(area35)*100; and, similarly, for the other temperature intervals and each group. Using the %/°C values, the effects of sex and age were assessed via two-way ANOVA and Tukey’s post hoc test. Second, to compare absolute changes over the four degree temperature interval, linear regression was applied to each metric of interest. For example for area, regression resulted in a fitted line with units of mm2/°C. Slopes were assessed for linearity (R2) and tested for being non-zero and different between groups. Significance was set at p < 0.05.
Results
Representative images from the four anatomical locations, acquired at 35 and 38 °C, are shown in . summarises the results presented below as well as non-significant findings. Non-significant group comparisons of percent change per degree show adjusted means, for sex and age, averaged across the three temperature intervals. As a reference for area measurements, based on image resolution at each anatomical location: CoW, 10 voxels = 0.06 mm2; infrarenal aorta, 10 voxels = 0.015 mm2; peripheral vasculature, 10 voxels = 0.13 mm2 and 5 voxels = 0.067 mm2.
Table 1. Summary of results. Data presented as mean ± SEM, or for group comparisons slopes and percent change per degree. Non-significant group comparisons of (%/°C) show adjusted means, for sex and age, averaged across the three temperature intervals. Temperature-interval specific data are listed for the femoral artery, the only location where relative changes within a given one degree interval differed by sex or age.
Cerebral vasculature has minimal response to increases in core temperature
The ACA and MCA were readily visible at all temperatures, unlike superficial vessels of the periphery (). Cerebral vasculature did not change with increasing core temperature. ACA and MCA vessel areas averaged across the four temperatures for each group were: adult males, 0.06 ± 0.005 and 0.05 ± 0.004 mm2; adult females, 0.05 ± 0.005 and 0.04 ± 0.003 mm2; aged males, 0.05 ± 0.005 and 0.05 ± 0.005 mm2; aged females, 0.04 ± 0.004 and 0.05 ± 0.006 mm2.
Ejection fraction decreased, cardiac output increased with temperature in adult females
Qualitatively, there is a discernable increase in both end-diastolic and end-systolic LV volume with increasing temperature (). Heart rate, stroke volume, ejection fraction and CO are presented in Supplemental Figure S1. Except for adult males, temperature had an influence on heart rate for the other three groups (p = 0.04–0.006). Heart rate linearly increased with temperature (slopes >0, p = 0.03–0.04, R2 = 0.92–0.94), with no difference between slopes. In adult females, temperature had an influence on ejection fraction (p = 0.008; with a statistically significant difference between means for 35 and 38 °C, 73.6% vs. 68.7%, p = 0.03) and CO (p = 0.049).
Aortic area increased with temperature, but at a diminished rate for aged animals
Qualitatively, there is a discernable increase in both diastolic and systolic area of the infrarenal aorta with increasing temperature (). shows cross-sectional area of the infrarenal aorta across the cardiac cycle for all groups (error bars are omitted for clarity). Supplemental Figure S2 shows cyclic strain of the infrarenal aorta across the cardiac cycle for all groups. In , average area and maximum cyclic strain are plotted to highlight their relationship.
Figure 3. Cross-sectional area of the infrarenal aorta across the cardiac cycle for male and female, adult and aged mice (n = 20, 5 per group) at core temperatures of 35, 36, 37 and 38 °C. Average area increased with increasing temperature. Aged animals span a smaller range of values from 35 to 38 °C compared to adult animals, corresponding to a reduction in the rate of area increase. Fraction of cardiac cycle: systolic peak ∼0.4, diastolic peak ∼1. Images are acquired for just over one complete cardiac cycle to insure MRI data accurately captures systole and diastole. Error bars omitted for clarity.
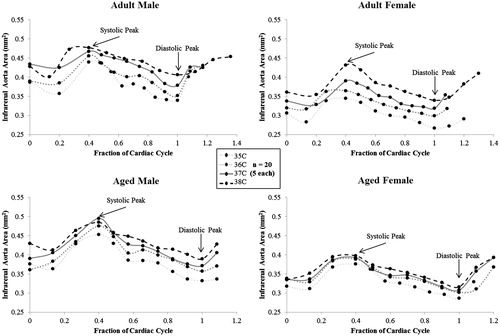
Figure 4. Average cross-sectional area (left y-axis) and maximum circumferential cyclic strain (right y-axis) of the infrarenal aorta for male and female, adult and aged mice (n = 20, 5 per group) at core temperatures of 35, 36, 37 and 38 °C. Linear regression lines shown for area and strain. As the average area of the vessel increases, the cyclic strain decreases. Significance set at p < 0.05; for temperature effect overall (†), pairwise comparisons between temperatures within a group (#) and non-zero slope (*).
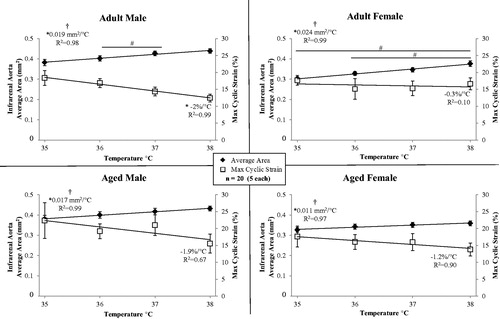
Temperature had an influence on average vessel area for all groups (, , p = 0.02–0.003). There were statistically significant differences between means within a group for: adult male, 36/37 °C (p = 0.01); and, adult female, 35/38 °C (p = 0.01) and 36/38 °C (p = 0.02). Area linearly increased with temperature (slopes >0, p = 0.02–0.003, R2 = 0.97–0.99), and slopes were different between groups (p < 0.001; adjusted means: male vs. female, 0.018 and 0.018 mm2/°C; adult vs. aged, 0.022 and 0.014 mm2/°C). For adult males, cyclic strain linearly decreased with temperature (slope <0, p = 0.004, R2 = 0.99).
Peripheral vessel areas and tracking length increased with temperature, with minimal or no response in aged males
Although from the MIPs it appears there is no signal to quantify along large extents of the peripheral vasculature at 35 °C (), in the 2 D images from these 3 D acquisitions there is signal visible throughout most of the regions of interest. When considering 2 D vs. 3 D methods, there are several trade-offs to consider, including non-perpendicular slice orientation relative to vessels vs. data acquisition efficiency. 3 D acquisition allowed for the full leg to be imaged at four different temperatures in the least amount of time. Therefore, peripheral area data shown in are calculated from 2 D axial slices of 3 D acquisitions, with the caveat that the slices are only approximately perpendicular to the cross-sectional view of the artery (particularly for the femoral location). Although this may cause a slight increase in the measured area, relative changes between temperatures account for this and provide relevant comparisons.
Figure 5. Cross sectional area of the peripheral arteries from 3 D scans for male and female, adult and aged mice (n = 5 each) at core temperatures of 35, 36, 37 and 38 °C. The majority of arteries increased in size with increased temperature. Aged males had a diminished response to temperature. For the saphenous artery, number of animals for which signal was present is indicated by (number). Significance set at p < 0.05: for temperature effect overall (†), pairwise comparisons between temperatures within a group (#), relative changes to same age group but opposite sex ($), relative changes to same sex but different age group (@) and non-zero slope (*).
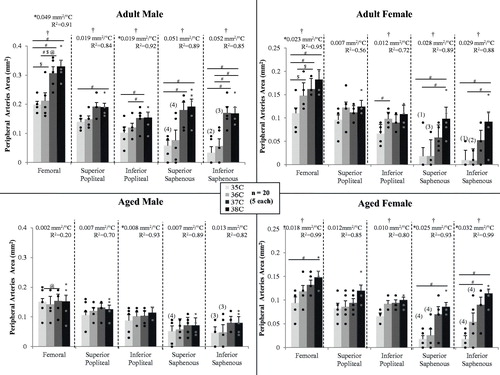
Except for aged males, temperature had an influence on femoral artery area (p = 0.01–0.003), with statistically significant differences between means within a group for: adult male between 35/37, 35/38 and 36/37 °C (p = 0.02–0.03); adult female between 35/36 and 35/38 °C (p = 0.02 and 0.003); and, aged female 35/38 °C (p = 0.01). Except for aged males, femoral artery area linearly increased with temperature (slopes >0, p = 0.04–0.007, R2 = 0.91–0.99), and slopes were different between groups (p < 0.01; adjusted means: male vs. female 0.026 and 0.021 mm2/°C; adult vs. aged 0.036 and 0.01 mm2/°C). Relative changes within a given one degree temperature interval were influenced by sex and age. For the 35–36 °C interval, the adult female’s response was over 7-fold larger than adult males (43.0 vs. 5.9%/°C, p = 0.04). For the 36–37 °C interval, adult males had a larger response than adult females by 3.9-fold (48.7 vs. 12.6%/°C, p = 0.05) and aged males by 4.7-fold (48.7 vs. 10.3%/°C, p = 0.03). The average percent increase per degree temperature (averaged across all three intervals 35–36, 36–37 and 37–38) was 21.1%/°C for adult males, 22.6%/°C for adult females, 0.6%/°C for aged males and 19.8%/°C for aged females.
For adult males, temperature had an influence on the popliteal artery at the superior location (p = 0.01), with a statistically significant difference between means for 35 and 38 °C (p = 0.04). Except for aged males, temperature had an influence on inferior popliteal vessel area for all other groups (p = 0.045–0.01), with statistically significant differences between means within a group for: adult male between 35/37 and 36/37 °C (p = 0.005 and 0.04); and, adult female between 35/37 °C (p = 0.01). Area linearly increased with temperature for both male groups (slopes >0, p = 0.04, R2 = 0.92–0.93).
For ten animals, the superior and/or inferior locations of the saphenous artery, both more superficial than the popliteal artery, did not have quantifiable signal at 35 and/or 36 °C based on the threshold value set from the 38 °C dataset. Therefore, values were recorded as zero, relative changes within a given one degree temperature interval could not be calculated and, instead, changes in area per degree were used in sex and age comparisons. Except for aged males, temperature had an influence on superior saphenous vessel area for all other groups (p = 0.01–0.004), with statistically significant differences between means within a group for: adult male between 35/37 and 35/38 °C (p = 0.03); adult female between 35/38 and 36/38 °C (p = 0.005 and 0.003); and, aged female between 35/38 °C (p = 0.04). Only aged females demonstrated a linear increase in area with temperature (slope >0, p = 0.03, R2 = 0.93). Except for aged males, temperature had an influence on inferior saphenous vessel area for all other groups (p = 0.008–0.0002), with statistically significant differences between means within a group for: adult male between 35/37, 35/38, 37/38 and 36/38 °C (p = 0.01, 0.02, 0.006 and 0.007); adult female between 35/38 and 36/38 °C (p = 0.04); and, aged female between 35/37 and 35/38 °C (p = 0.04 and 0.005). Like the superior location, only aged females demonstrated a linear increase in area with temperature (slope >0, p = 0.004, R2 = 0.99).
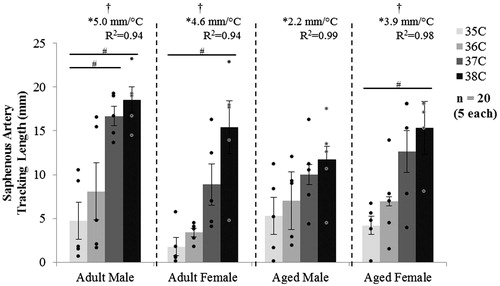
The tracking length of the saphenous artery is shown in . Except for aged males, temperature had an influence on saphenous tracking length for all other groups (p = 0.02–0.007). Tracking length linearly increased with temperature (slopes >0, p = 0.03–0.01, R2 = 0.94–0.99), with no difference between slopes.
Figure 6. MRI tracking length of the saphenous artery for male and female, adult and aged mice at core temperatures of 35, 36, 37 and 38 °C (n = 5 each). The tracking length increased with increased temperature. Significance set at p < 0.05 for temperature effect overall (†), pairwise comparisons between temperatures within a group (#) and non-zero slope (*).
Distal peripheral vessel area measurements differ between 2 D and 3 D acquisitions
2 D data was acquired in a second group of adult male mice to evaluate the contribution of blood flow velocity to visualisation of peripheral vessels. With the 2 D slices planned perpendicular to the vessel, as compared to the off-plane 3 D acquisitions, absolute values of area were different but percent changes can be compared. For the femoral location, the vessel areas from 2 D data acquired at 35 and 38 °C were 0.12 ± 0.02 and 0.19 ± 0.02 mm2 (comparative 3 D data shown in ), with increases of 59% (2 D) compared to 63% (3 D). For the superior popliteal location, the vessel areas were 0.07 ± 0.006 and 0.09 ± 0.01mm2 with percent increases of 34% (2 D) compared to 57% (3 D). For the superior saphenous location, the vessel areas were 0.03 ± 0.002 and 0.06 ± 0.01 mm2 with percent increase of 47% (2 D) compared to 235% (3 D).
Discussion
Direct, non-invasive measurements of murine vascular structure and function with increasing temperature from minimally hypothermic to minimally hyperthermic conditions
This study provides quantitative insight into CV responses resulting from changes in core temperature, while illustrating an innovative non-invasive approach. Our data show that the response in core vasculature depends on anatomical location; mimic human data in the head, heart and periphery; and, include the novel finding that the aorta enlarges markedly with increasing core temperature. We have quantified sex- and age-dependent differences in the CV responses [Citation44], harmonising with the National Institutes of Health’s recent communications regarding lack of sex diversity in preclinical experiments. The results presented here accentuate the need to closely control and report animal temperature in preclinical CV studies and provide foundational data (geometry of the vessels) to begin coupling empirical values of the body’s physiological response to temperature (based on anatomical location, sex and age) with bioheat and CFD modelling in order to better understand thermoregulation.
Infrarenal aorta: Potential impact of changes in core vasculature on heat transfer
Our primary endpoint for the aorta was measurements of area with a secondary outcome of cyclic strain, both of which are indicators of health and disease [Citation45–48]. Increases in area would be hypothesised to impact conductive and convective heat transfer, while decreases in strain reflect a reduction in how much a vessel can expand across the cardiac cycle and are a representation of increased vascular stiffness [Citation49].
The statistically significant temperature-induced enlargement we have quantified in the aorta, previously unknown and potentially underestimated, is biologically important because it may affect conductive and convective heat transfer. Heat conduction would be hypothesised to change due to an increase in surface area, closer proximity to surrounding tissue and vessels and potential changes in velocity. In images acquired at 38 °C, the aorta appears to be more closely juxtaposed to the infrarenal vena cava (, arrowhead). Heat transfer via convection would be hypothesised to change based on potential changes in bulk flow and/or velocity. The large changes in geometry clearly illustrated in this work provide the motivation to pursue direct measurements of blood flow velocity by MRI in order to simultaneously quantify geometric and hemodynamic changes which could help elucidate conductive and convective processes and improve understanding of thermoregulation, directly, or by incorporating empirical values into subject-specific bioheat models.
Infrarenal aorta: Age moderates the response of core vasculature to increases in temperature
Even within a non-pathological range of core temperatures, as tested in this work, increases in the cross-sectional area of the infrarenal aorta were significant for all groups. This was not what we initially hypothesised due to the depth of this core vessel and thus limited heat exchange to the environment. Although relative changes within a particular one degree temperature interval did not differ between groups, the rate of increase over the entirety of temperatures tested differed based on age (adult = 0.022 vs. aged = 0.014 mm2/°C). This can be visualised in , where area measurements across the cardiac cycle span a smaller range for aged animals, compared to adults, from 35 to 38 °C. The changes in area were linear for all groups (R2 = 0.97–0.99), which would make their incorporation into mathematical models simpler.
Although not reaching statistical significance within the current temperature range, the biological effect of increased core temperature was a decrease in strain (Supplemental Figure S2). The rate of decrease in maximum strain was similar between adult and aged animals (−1.2%/°C vs. −1.6%/°C, respectively, ) and implies, that with the enlargement of area due to increases in temperature, vessels are nearing their elastic limits. Favreau et al. saw a similar relationship between increased diastolic area and reduced strain in a murine model of arterial occlusive disease [Citation50]. Larger increases in area but similar decreases in strain suggest there may be remaining reserve in adult animals, but not their aged counterparts, if we were to challenge the CV system further, for example if we were to explore exercise-like conditions in conjunction with heat stress.
Interestingly, adult females had the largest increase in area over the temperature range investigated (0.024 mm2/°C), while having the smallest decrease in cyclic strain (−0.3%/°C, ). Large structural changes, while retaining the ability to expand over the cardiac cycle, may be a reflection of the sex-specific differences known to exist with respect to control of the baroreflex system [Citation51].
Periphery: The compromised response in aged male mice parallels human data
Although more cautious interpretation of data acquired in the periphery is warranted due to the greater influence of blood flow velocity on measurements (i.e. differences between percent changes in area for 3 D vs. 2 D data) and the smaller vessel size beginning to challenge the spatial resolution of our MRI system, the peripheral vasculature undoubtedly enlarged with increasing core temperature. This was as we hypothesised due to its more superficial location and its role in carrying blood to the extremities. While Pearson et al. [Citation12] found the human femoral artery diameter unchanged in a core temperature range of 37–39 °C, we quantified increases in the murine femoral artery area over the 35–38 °C range, with the largest increases between 36 and 37 °C [Citation12]. The saphenous artery changed the most, consistent with it being the most superficial and its function of supplying blood to the hindlimb digits, one of the primary locations for heat exchange with the environment [Citation52]. In aged male mice, the response was diminished, or in some locations absent entirely, and is consistent with data on the response of cutaneous vasculature of aged male humans [Citation21,Citation53]. Unlike aged male mice, aged females responded more similarly to adult animals of both sexes [Citation54].
Head and heart: Non-invasive quantification of cerebral and cardiac effects is consistent with previous results
Temperature did not have an effect on cross-sectional area of the murine cerebral vasculature, as we hypothesised. This is likely due to the CoW not being superficial and thus not a site for large heat exchange with the environment as well as temperature-induced changes in the central nervous system being balanced with autoregulatory mechanisms [Citation55]. Our results agree with previous work in humans showing cerebral blood flow was unchanged up to core temperatures of ∼38 °C and then began to decrease during more severe hyperthermia (core temperature ≥39.5 °C) [Citation29,Citation30,Citation56].
Similar to previous cardiac data, females had smaller CO and larger EF than males of the same age [Citation57] and contrary to previous findings [Citation58] aged animals had larger SV and CO than younger groups of the same sex. The latter may be due to our aged mice just bordering senescence without frank declines in cardiac function, which would be consistent with findings in humans suggesting that age-related vascular changes (as we saw in the aorta and periphery) precede declines in cardiac function [Citation59]. As we hypothesised based on the need to maintain blood pressure due to a large reduction in total vascular resistance [Citation31], supported by our peripheral data, the response to increased temperature was an increase in CO. Although increases were statistically significant only for the adult female group, the qualitative differences in changes in CO based on sex and age parallel human data. The adult female and both aged groups increased CO via increased HR, whereas the adult male group increased CO via increases in both heart rate and stroke volume. Minson et al. showed that during passive heating male subjects demonstrated age-dependent differences in CO due to younger subjects having an initial increase in SV before a subsequent decline for both groups [Citation24]. Also, SV and CO decreased in aged males between 37 and 38 °C (heat stress), but not in aged females, which is consistent with heat stress research in humans in this temperature range [Citation24,Citation58,Citation60].
Setpoints: Data support the idea of subject-specific core temperature setpoints
Looking broadly across all metrics, the temperature interval at which the largest response occurred differed based on sex and age. Excluding measurements taken in the head, we considered twelve measurements for each group of animals. Adult males were focussed around the 36–37 °C intervals with the largest response in eight metrics, with two metrics each at the 35–36 and 37–38 °C intervals. Adult females had the largest response in four and six metrics at the 35–36 and 36–37 °C intervals, respectively and two at 37–38 °C. Aged males had the largest response at the 35–36 and 36–37 °C intervals for five metrics each and 37–38 °C for two metrics. Aged females had the most distributed response with each of the three temperature intervals (35–36, 36–37 and 37–38 °C) having the largest response for four metrics. Physiologically, this could be an indicator of different animal core temperature setpoints as seen previously in C57BL6 mice [Citation61].
Limitations
Murine models have limitations. Mice only have sweat glands on their paws and studies often require anaesthesia. Anaesthesia has been shown to reduce the core temperature at which physiological responses such as vasoconstriction occur; however, the intensity of the vascular response is maintained [Citation62]. In addition, although isoflurane has vasodilatory effects which can be dose and step-size dependent [Citation63,Citation64], our attentive control and monitoring of our animals’ physiology allows us to minimise these effects by using low doses and making small adjustments throughout an imaging session. Studies also show a slight reduction in CO under anaesthesia, but heart rates are closer to those recorded in conscious mice using isoflurane [Citation40]. With temperature well-controlled under anaesthesia, we have begun to separate behavioural, metabolic and CV changes due to temperature. However, we did not measure skin or muscle temperature nor investigate neural or humoral responses. Future studies are required to determine the contribution of each of these factors to changes in core vasculature [Citation65]. We are also cognisant of the impact of circadian rhythm on core temperature and, therefore, animals were typically imaged in the morning, and always within their 12 h light-cycle.
Conclusions
Due to challenges associated with making measurements from core vasculature, there is a lack of empirical information regarding how it changes with changing core temperature and its role in thermoregulation. Researchers have begun to study this response in the leg [Citation12,Citation14], and we have expanded this to the whole body. With the non-invasive nature of MRI and our ability to tightly control our animals’ temperature, data presented here begin to fill this gap. To our knowledge, this is the first work to quantify and compare temperature-induced changes in core vessels of the head, torso and periphery of murine models. These data provide a broad view of physiological alterations of the murine CV system due to increases in core temperature, from head-to-toe. Our most important finding that the cross-sectional area of the infrarenal aorta increases significantly with increasing core temperature is biologically significant due to the potential impact these changes could have on conductive and convective processes involved in thermoregulation. This work provides further evidence of the effects of sex and age on CV responses and emphasises the necessity to properly control an animal’s temperature and report it in publications.
Authorship contributions
A. Colleen Crouch (ACC), Adam Manders (AM), Amos Cao (AC), Ulrich M Scheven (UMS), and Joan M Greve (JMG).
ACC and JMG conceived and designed the study; ACC and AM collected and analysed data; AC and UMS developed the in-house image analysis method for infrarenal aorta; ACC performed statistical analysis; ACC and JMG interpreted the data; ACC and JMG wrote the article; ACC and JMG critically revised the article; all authors gave final approval of the article.
Supplemental Material
Download TIFF Image (252.5 KB)Supplemental Material
Download TIFF Image (95 KB)Acknowledgements
Gratitude to Jose A. Diaz, Department of Surgery, Vascular surgery, University of Michigan, Ann Arbor, MI for expert review of the final manuscript.
Disclosure statement
No potential conflict of interest was reported by the authors.
Additional information
Funding
References
- van der Zee J. (2002). Heating the patient: a promising approach? Ann Oncol 13:1173–84.
- Tucker R, Rauch L, Harley YXR, Noakes TD. (2004). Exercise, temperature regulation impaired exercise performance in the heat is associated with an anticipatory reduction in skeletal muscle recruitment. Pflugers Arch Eur J Physiol 448:422–30.
- Stewart IB, Rojek AM, Hunt AP. (2011). Heat strain during explosive ordnance disposal. Mil Med 176:959–63.
- Polderman KH. (2004). Application of therapeutic hypothermia in the intensive care unit. Opportunities and pitfalls of a promising treatment modality-part 2: practical aspects and side effects. Intensive Care Med 30:757–69.
- Centers for Disease Control and Prevention U. (2006). Hypothermia-related deaths–United States, 1999–2002 and 2005. Morb Mortal Wkly Rep 55:282–4.
- Parsons KC. (1993). Human thermal environments: the effects of hot, moderate, and cold environments on human health, comfort, and performance. 3rd ed. Boca Raton (FL): CRC Press/Taylor & Francis.
- Fiala D, Havenith G. (2015). Modelling human heat transfer and temperature regulation. Cham, Switzerland: Springer International Publishing, 265–302.
- Rowell LB. (1974). Human cardiovascular adjustments to exercise and thermal stress. Physiol Rev 54:75–159.
- González-Alonso J. (2012). Human thermoregulation and the cardiovascular system. Exp Physiol 97:340–6.
- Dastre A, Morat J. (1884). Influence du sang asphyxique sur l’appareil nerveux de la circulation [Influence of asphyxial blood on the nervous system of circulation]. Arch Physiol Norm Pathol 3:1–45.
- Akyürekli D, Gerig LH, Raaphorst GP. (1997). Changes in muscle blood flow distribution during hyperthermia. Int J Hyperthermia13:481–96.
- Pearson J, Low DA, Stöhr E, et al. (2011). Hemodynamic responses to heat stress in the resting and exercising human leg: insight into the effect of temperature on skeletal muscle blood flow. Am J Physiol Regul Integr Comp Physiol 300:663–73.
- Binzoni T, Tchernin D, Richiardi J, et al. (2012). Haemodynamic responses to temperature changes of human skeletal muscle studied by laser-Doppler flowmetry. Physiol Meas 33:1181–97.
- Chiesa ST, Trangmar SJ, González-Alonso J. (2016). Temperature and blood flow distribution in the human leg during passive heat stress. J Appl Physiol 120:1047–58.
- González-Alonso J, Calbet JAL, Boushel R, et al. (2015). Blood temperature and perfusion to exercising and non-exercising human limbs. Exp Physiol 100:1118–31.
- Kaciuba-Uscilko H, Grucza R. (2001). Gender differences in thermoregulation. Curr Opin Clin Nutr Metab Care 4:533–6.
- Brody GM. (1994). Hyperthermia and hypothermia in the elderly. Clin Geriatr Med 10:213–29.
- Collins KJ, Exton-Smith AN. (1983). 1983 Henderson award lecture. Thermal homeostasis in old age. J Am Geriatr Soc 31:519–24.
- Noe RS, Jin JO, Wolkin AF. (2012). Exposure to natural cold and heat: hypothermia and hyperthermia medicare claims, United States, 2004–2005. Am. J Public Health 102:e11–18.
- McDonald RB, Day C, Carlson K, et al. (1989). Effect of age and gender on thermoregulation. Am J Physiol 257:R700–4.
- Van Someren EJW. (2011). Age-related changes in thermoreception and thermoregulation. In: Edward JM, Steven NA, eds. Handbook of the biology of aging. Amsterdam: Elsevier, 463–78.
- Chen CH, Nakayama M, Nevo E, et al. (1998). Coupled systolic-ventricular and vascular stiffening with age: implications for pressure regulation and cardiac reserve in the elderly. J Am Coll Cardiol 32:1221–7.
- O’Toole ML. (1989). Gender differences in the cardiovascular response to exercise. Cardiovasc Clin 19:17–33.
- Minson CT, Wladkowski SL, Cardell AF, et al. (1998). Age alters the cardiovascular response to direct passive heating. J Appl Physiol 84:1323–32.
- Johnson JM, Rowell LB, Brengelmann GL. (1974). Modification of the skin blood flow-body temperature relationship by upright exercise. J Appl Physiol 37:880–6.
- Savage MV, Brengelmann GL. (1996). Control of skin blood flow in the neutral zone of human body temperature regulation. J Appl Physiol 80:1249–57.
- Swain ID, Grant LJ. (1989). Methods of measuring skin blood flow. Phys Med Biol 34:151–75.
- Nybo L, Møller K, Volianitis S, et al. (2002). Effects of hyperthermia on cerebral blood flow and metabolism during prolonged exercise in humans. J Appl Physiol 93:58–64.
- Bain AR, Nybo L, Ainslie PN. (2015). Cerebral vascular control and metabolism in heat stress. Compr Physiol 5:1345–80.
- Qian S, Jiang Q, Liu K, et al. (2014). Effects of short-term environmental hyperthermia on patterns of cerebral blood flow. Physiol Behav 128:99–107.
- Crandall CG. (2008). Heat stress and baroreflex regulation of blood pressure. Med Sci Sports Exerc 40:2063–70.
- Siddiqui A. (2011). Effects of vasodilation and arterial resistance on cardiac output. J Clin Exp Cardiolog 2:170.
- Kuhn LA, Turner JK. (1959). Alterations in pulmonary and peripheral vascular resistance in immersion hypothermia. Circ Res 7:366–74.
- Wissler EH. (1998). Pennes’ 1948 paper revisited. J Appl Physiol 85:35–41.
- Bhowmik A, Singh R, Repaka R, et al. (2013). Conventional and newly developed bioheat transport models in vascularized tissues: a review. J Therm Biol 38:107–25.
- Leon LR. (2005). The use of gene knockout mice in thermoregulation studies. J Therm Biol 30:273–88.
- Cuomo F, Roccabianca S, Dillon-Murphy D, et al. (2017). Effects of age-associated regional changes in aortic stiffness on human hemodynamics revealed by computational modeling. PLoS One 12:e0173177.
- Ducharme MB, Tikuisis P. (1994). Role of blood as heat source or sink in human limbs during local cooling and heating. J Appl Physiol 76:2084–94.
- Flurkey K, Mcurrer J, Harrison D. (2007). Mouse models in aging research. In: Fox JG, Barthold SW, Davisson MT, Newcomer CE, Quimby FW, Smith AL, eds. Mouse in biomedical research. New York (NY): Elsevier 637–72.
- Constantinides C, Mean R, Janssen BJ. (2011). Effects of isoflurane anesthesia on the cardiovascular function of the C57BL/6 mouse. ILAR J 52:e21–31.
- Teng D, Hornberger TA. (2011). Optimal temperature for hypothermia intervention in mouse model of skeletal muscle ischemia reperfusion injury. Cell Mol Bioeng 4:717–23.
- Duhan V, Joshi N, Nagarajan P, et al. (2012). Protocol for long duration whole body hyperthermia in mice. J Vis Exp 66:e3801.
- Goergen CJ, Barr KN, Huynh DT, et al. (2010). In vivo quantification of murine aortic cyclic strain, motion, and curvature: implications for abdominal aortic aneurysm growth. J Magn Reson Imaging 32:847–58.
- Hinson JM, Laprairie KN, Cundiff JM. (2005). One size does not fit all. J Appl Physiol 32:26–30.
- Liu X, Peyton KJ, Durante W. (2013). Physiological cyclic strain promotes endothelial cell survival via the induction of heme oxygenase-1. Am J Physiol Heart Circ Physiol 304:H1634–43.
- Schad JF, Meltzer KR, Hicks MR, et al. (2011). Cyclic strain upregulates VEGF and attenuates proliferation of vascular smooth muscle cells. Vasc Cell 3:21.
- Shimizu K, Mitchell RN, Libby P. (2006). Inflammation and cellular immune responses in abdominal aortic aneurysms. Arterioscler Thromb Vasc Biol 26:987–94.
- Smith JD, Davies N, Willis AI, et al. (2001). Cyclic stretch induces the expression of vascular endothelial growth factor in vascular smooth muscle cells. Endothelium 8:41–8.
- Goergen CJ, Azuma J, Barr KN, et al. (2011). Influences of aortic motion and curvature on vessel expansion in murine experimental aneurysms. Arterioscler Thromb Vasc Biol 31:270–9.
- Favreau JT, Liu C, Yu P, et al. (2014). Acute reductions in mechanical wall strain precede the formation of intimal hyperplasia in a murine model of arterial occlusive disease. J Vasc Surg 60:1340–7.
- Huxley VH. (2007). Sex and the cardiovascular system: the intriguing tale of how women and men regulate cardiovascular function differently. Adv Physiol Educ 31:17–22.
- Kochi T, Imai Y, Takeda A, et al. (2013). Characterization of the arterial anatomy of the murine hindlimb: functional role in the design and understanding of ischemia models. PLoS One 8:e84047.
- Rooke GA, Savage MV, Brengelmann GL. (1994). Maximal skin blood flow is decreased in elderly men. J Appl Physiol 77:11–14.
- Drinkwater BL, Bedi JF, Loucks AB, et al. (1982). Sweating sensitivity and capacity of women in relation to age. J Appl Physiol Respir Environ Exerc Physiol 53:671–6.
- Eric Kandle, Jame Schwartz, Thomas Jessell, Steven Siegelbaum AJH. (2012). Principles of neural science. 5th ed. New York (NY): McGraw-Hill Education.
- Ogoh S, Sato K, Okazaki K, et al. (2013). Blood flow distribution during feat stress: cerebral and systemic blood flow. J Cereb Blood Flow Metab 33:1915–20.
- Chung AK, Das SR, Leonard D, et al. (2006). Women have higher left ventricular ejection fractions than men independent of differences in left ventricular volume: the Dallas Heart Study. Circulation 113:1597–604.
- Kenney WL, Munce TA. (2003). Invited review: aging and human temperature regulation. J Appl Physiol 95:2598–603.
- Houghton D, Jones TW, Cassidy S, et al. (2016). The effect of age on the relationship between cardiac and vascular function. Mech Ageing Dev 153:1–6.
- Dunbar SL, Kenney WL. (2000). Effects of hormone replacement therapy on hemodynamic responses of postmenopausal women to passive heating. J Appl Physiol 89:97–103.
- Sanchez-Alavez M, Alboni S, Conti B. (2011). Sex- and age-specific differences in core body temperature of C57Bl/6 mice. Age (Dordr) 33:89–99.
- Støen R, Sessler DI. (1990). The thermoregulatory threshold is inversely proportional to isoflurane concentration. Anesthesiology 72:822–7.
- Matta BF, Heath KJ, Tipping K, et al. (1999). Direct cerebral vasodilatory effects of sevoflurane and isoflurane. Anesthesiology 91:677–80.
- Hartley CJ, Reddy AK, Madala S, et al. (2007). Effects of isoflurane on coronary blood flow velocity in young, old and ApoE(-/-) mice measured by Doppler ultrasound. Ultrasound Med Biol 33:512–21.
- Frank SM, Raja SN, Bulcao CF, et al. (1999). Relative contribution of core and cutaneous temperatures to thermal comfort and autonomic responses in humans. J Appl Physiol 86:1588–93.