
Abstract
Background: The effectiveness of hyperthermia is strongly dependent on the achieved tumour temperatures. Phased-array systems allow flexible power steering to realise good tumour heating while avoiding excessive heating in normal tissue, but the limited quantitative accuracy of pre-treatment planning complicates realising optimal tumour heating. On-line hyperthermia treatment planning could help to improve the heating quality. This paper demonstrates the feasibility of using on-line temperature-based treatment planning to improve the heating quality during hyperthermia in three patients.
Methods: Hyperthermia treatment planning was performed using the Plan2Heat software package combined with a dedicated graphical user interface for on-line application. Electric fields were pre-calculated to allow instant update and visualisation of the predicted temperature distribution for user-selected phase-amplitude settings during treatment. On-line treatment planning using manual variation of system settings for the AMC-8 hyperthermia system was applied in one patient with a deep-seated pelvic melanoma metastasis and two cervical cancer patients. For a clinically relevant improvement the increase in average target temperature should be at least 0.2 °C.
Results: With the assistance of on-line treatment planning a substantial improvement in tumour temperatures was realised for all three patients. In the melanoma patient, the average measured target temperature increased from 38.30 °C to 39.15 °C (i.e. +0.85 °C). In the cervical cancer patients, the average measured target temperature increased from 41.30 °C to 42.05 °C (i.e. +0.75 °C) and from 41.70 °C to 42.80 °C (i.e. +1.1 °C), respectively.
Conclusion: On-line temperature-based treatment planning is clinically feasible to improve tumour temperatures. A next, worthwhile step is automatic optimisation for a larger number of patients.
Introduction
Radiotherapy and chemotherapy are important treatments in clinical oncology and their effectiveness can be enhanced significantly by adding hyperthermia to the standard treatment schedule, without a significant increase in toxicity [Citation1–5]. Hyperthermia aims at heating the tumour to a temperature between 40 °C and 43 °C for 1 h. The effectiveness has been demonstrated for various tumours, among which recurrent breast cancer, cervical cancer, bladder cancer, melanoma, sarcoma and head and neck cancer [Citation6]. For cervical cancer, for example, the 3-year overall survival increased from 27 to 51% when hyperthermia was combined with radiotherapy, compared to radiotherapy alone [Citation4].
The effectiveness of hyperthermia as part of an anti-cancer treatment depends strongly on the achieved temperature, as demonstrated in pre-clinical and clinical studies [Citation7–11]. Since a thermal dose-effect relationship has been observed, aiming for the widely accepted optimal temperature of 43 °C is very important. This can be explained by several working mechanisms of hyperthermia that become (more) active beyond specific temperature thresholds [Citation12–14]. An important mechanism is inhibition of DNA damage repair. Hyperthermia, for example, induces degradation of BRCA2 [Citation15] and thereby inhibits the homologous recombination DNA repair mechanism when temperatures exceeding 41 °C are achieved [Citation16]. Furthermore, blood flow increases significantly during hyperthermia when 40 °C is exceeded [Citation17], which improves tumour oxygenation and thereby radiosensitivity [Citation18]. The majority of cervical tumours are infected with the human papillomavirus [Citation19], which produces a protein that binds to the tumour suppressor protein p53, preventing p53-dependent apoptosis and cell-cycle arrest. Hyperthermia restores the p53 function and thereby induces apoptosis and cell-cycle arrest [Citation20]. This mechanism becomes active when temperatures of 42 °C or higher are realised.
Thus, realising high tumour temperatures is very important for effective application of hyperthermia, but pain caused by hot spots in normal tissue often limits the achieved tumour temperature. These hot spots typically occur at tissue interfaces due to large variations in tissue properties (and thus power absorption) and perfusion (and thus heat removal) for different tissues (fat, muscle, bone). Advanced phased-array systems are often used for clinical hyperthermia, which operate at a frequency between 70 and 150 MHz [Citation21–24]. These systems have 4–24 antennas organised in one or multiple rings around the patient and the amplitudes and phases of the antennas can be adjusted to optimise the heating pattern. However, the large number of antennas and the complex interaction of the electromagnetic fields make intuitive optimisation of phase-amplitude settings very difficult. Moreover, 3 D temperature information feedback is generally not available, since standard clinical thermometry uses (minimally) invasive thermometry probes in the tumour area. Non-invasive 3 D thermometry using, e.g. MRI is under development and the feasibility of optimising antenna settings using MR-thermometry feedback has been demonstrated, e.g. for sarcomas in extremities [Citation25], but the reliability of MR-thermometry in the pelvic region is affected by organ movement and blood flow [Citation26]. Moreover, not all hyperthermia systems are MR-compatible, so MR-thermometry is not yet suitable or available for routine use in clinical hyperthermia.
Hyperthermia treatment planning is a very useful instrument with a clear potential to assist in optimising the specific absorption rate (SAR) or temperature distribution during clinical hyperthermia [Citation27]. Although hyperthermia treatment planning for individual patients is not quantitatively reliable because patient-specific dielectric and thermal tissue properties are not available, a qualitative reliability has been demonstrated [Citation28], which can be exploited for on-line application. It has been shown that simulated and measured changes in heating patterns after phase-amplitude adaptations correlate relatively well [Citation28]. Recently, we performed a feasibility study for the on-line use of temperature-based hyperthermia treatment planning, and found that treatment planning can assist in effective phase-amplitude steering to suppress treatment limiting hot spots in normal tissue, without significantly reducing the tumour temperature [Citation29]. Results suggested a window for improvement of tumour temperatures, since the temperature at the hot spot location was predicted to reduce much more than the temperature in the target region.
The next step is to investigate whether hyperthermia treatment planning can improve tumour temperatures without increasing pain from hot spots. Before starting a study with a large number of patients, the feasibility to improve tumour heating needs to be demonstrated first. This paper describes three different clinical cases in which temperature-based treatment planning was used to improve the heating quality.
Methods
Patients
On-line temperature-based adaptive hyperthermia treatment planning to improve tumour temperatures was applied in three different patients from our daily clinical practice. We aimed at including a representative selection of cases regarding both tumour location (eccentric vs. central) and patient sizes (slender/thin vs. obese; BMI <25 kg/m2 vs. BMI >30 kg/m2). shows transversal slices of the CT scans at the centre of the tumour.
Figure 1. Transversal cross-sections of the CT scan for the three patients. The contour indicates the target region. Cross-sections are at the centre of the target region in axial direction.
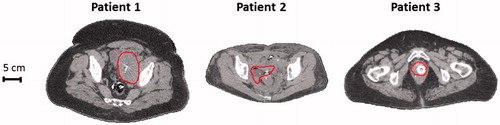
Patient 1: An obese (BMI 36.9 kg/m2) 55-year-old male melanoma patient with a lymph node metastasis located slightly eccentrically in the pelvis, treated with radiotherapy (7 × 5 Gy) combined with hyperthermia. On-line hyperthermia treatment planning was used during session 2. Thermometry probes were positioned intraluminally in the bladder (1 probe; sensor spacing 0.5 cm), the rectum (1 probe; sensor spacing 0.5 cm, 2 probes; sensor spacing 2 cm) and invasively via the groin (1 probe; sensor spacing 0.5 cm). Twenty temperature sensors of the rectal probes were marked as tumour indicative (i.e. within ∼5 cm of the tumour). More details about the thermometry probes can be found in the section “Hyperthermia treatment”.
Patient 2: A slender (BMI 21.1 kg/m2) 42-year-old woman with a locoregional cervical tumour, 2nd recurrence, treated with carboplatin plus hyperthermia. On-line hyperthermia treatment planning was used during session 4. Thermometry probes (sensor spacing 0.5 cm) were positioned intraluminally in the rectum (1 probe) and the vagina (2 probes). Fifteen temperature sensors of the vaginal probes were marked as tumour adjacent/indicative.
Patient 3: An obese (BMI 33.4 kg/m2) 65-year-old woman with recurrent cervical tumour in the vagina top treated with radiotherapy, 3 × 8 Gy in weekly fractions combined with hyperthermia. On-line hyperthermia treatment planning was used during session 2. Thermometry probes (sensor spacing 0.5 cm) were positioned intraluminally in the rectum (1 probe) and the cervix/vagina (3 probes). Twenty-seven temperature sensors of the vaginal and cervical probes were marked as tumour adjacent/indicative.
Hyperthermia treatment
Hyperthermia was applied using the 70 MHz AMC-8 phased-array waveguide system [Citation21]. This system consists of two rings with each four waveguides and can be used as a single ring device or as a double ring device. The majority of our patients is presently treated with a single ring of antennas, which was also the case for the treatments in this paper. A photograph of the system and a schematic picture of the single ring four-antenna set-up are shown in . Patients were treated in supine position and positioned centrally between the antennas in the lateral and anterior-posterior direction. The tumour was positioned centrally between the antennas in the cranial-caudal direction. Water boluses between the antennas and the patient provide effective skin cooling and coupling of the electromagnetic fields into tissue. The circulating water temperature is about 12 °C and is kept constant during the treatment. Thermometry was performed using 14-point thermocouple probes (accuracy ±0.01 °C, ELLA, Czech Republic) inserted before the start of the treatment. The sensors most representative for the target temperature were labelled as “tumour adjacent/indicative”. Temperatures were measured every 30 s after a 5 s power off to avoid electromagnetic disturbance [Citation30].
Figure 2. Photograph of the 70 MHz AMC-8 system (left) and a schematic picture of a patient in a single ring four-antenna set-up (right).

Initial treatment settings were determined using a clinical optimisation procedure as prescribed by our standard treatment protocol. This combines standard amplitude settings with an on-line phase-optimisation at the start of treatment, as mentioned in the quality assurance guidelines for regional hyperthermia [Citation31]. This optimisation uses an E-field probe at or close to the tumour location and a phase sweep per antenna is performed to realise a maximum E-field signal and thus a power focus at the probe location. The top antenna serves as a reference (i.e. phase 0 °C). As prescribed by our treatment protocol, the steady state period of 1 h was started when half of the thermocouple sensors in the target region registered at least 41 °C, or after a maximum induction period of 30 min.
Hyperthermia treatment planning
Pre-treatment simulations to enable on-line use of hyperthermia treatment planning were performed using the Plan2Heat software package [Citation32]. A hyperthermia planning CT scan was made in treatment position on a water bolus and mattresses. Hounsfield unit-based segmentation was performed to distinguish bone, muscle, fat and air [Citation33] and the tumour was delineated by a radiation oncologist. Literature-based dielectric and thermal properties were assigned to the segmented tissues, as listed in [Citation34,Citation35]. The models for the waveguides and water boluses were combined with the segmented patient model and electromagnetic fields were calculated for each individual antenna on a 2.5 × 2.5 × 2.5 mm3 grid using the “Finite Difference Time Domain” method [Citation36,Citation37]. For efficient temperature calculations the temperature at any location (x, y, z) in the patient resulting from a system with four active antennas, can be written as
(1)
where
![]() is a 4 × 4 complex, Hermitian matrix and T00 is a constant resulting from the boundary conditions [Citation38]. The feed vector v is a 4 × 1 vector containing the amplitudes and phases, vH is the complex conjugate transpose of v. The elements in the matrix
is a 4 × 4 complex, Hermitian matrix and T00 is a constant resulting from the boundary conditions [Citation38]. The feed vector v is a 4 × 1 vector containing the amplitudes and phases, vH is the complex conjugate transpose of v. The elements in the matrix ![]() represent the contribution of each active antenna and antenna combination to the temperature distribution and can be pre-computed. Steady state temperature calculations were based on Pennes’ bio heat equation [Citation39]. Thus, superposition of these pre-computed temperature distributions as in EquationEquation (1)
represent the contribution of each active antenna and antenna combination to the temperature distribution and can be pre-computed. Steady state temperature calculations were based on Pennes’ bio heat equation [Citation39]. Thus, superposition of these pre-computed temperature distributions as in EquationEquation (1)(1) allows an instant update of the predicted temperature distribution when the operator varies phase-amplitude settings during the on-line optimisation process [Citation29,Citation38]. The efficiency of the AMC-8 system is 70% [Citation21], which was accounted for in the simulations.
Table 1. Values of the tissue properties used in the simulations; conductivity (σ [S m−1]), relative permittivity (εr [–]), density (ρ [kg m−3]), specific heat capacity (c [J kg−1 °C−1]), thermal conductivity (k [W m−1 °C−1]) and perfusion (wb [kg m−3 s−1]).
On-line adaptive hyperthermia treatment planning
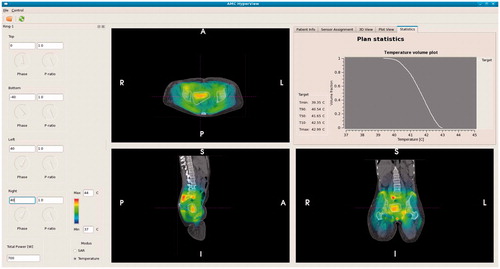
For on-line use of hyperthermia treatment planning a graphical user interface was developed to visualise the effect of phase-amplitude steering on the 3 D temperature distribution. The user interface provides information about the predicted amount of power absorbed in the tumour region as well as a predicted temperature volume histogram of the tumour, with a summary of the predicted minimum and maximum temperature as well as the indexed temperatures T10, T50 and T90, i.e. the temperature at least achieved in 10, 50 and 90% of the tumour volume, respectively. shows a screenshot of this graphical user interface. Treatments started with clinically optimised settings, as described above in the paragraph “Hyperthermia treatment”. During the steady-state period on-line treatment planning was used to improve tumour temperatures. To this end several adaptations in phase-amplitude settings were tested manually in the user interface to visualise and compare the effect of the alternative settings regarding predicted average tumour temperatures. Similar adaptations to system settings were performed in response to hot spot complaints, ensuring that the tumour temperature will not decrease while suppressing hot spots [Citation29].
Figure 3. Screenshot of the graphical user interface for on-line use of hyperthermia treatment planning. Phase-amplitude settings can be adapted on the left hand-side. The corresponding predicted temperature distribution is instantly projected onto the CT scan. In the top right window the temperature volume histogram of the delineated target region is shown, with a summary of the indexed temperatures T10, T50 and T90 and minimum and maximum temperature.
For a clinically relevant improvement in tumour temperatures the predicted increase in average tumour temperature should be more than 0.2 °C. This is supported by our previous study on the use of treatment planning in hot spot suppression [Citation29], where a change in temperature less than 0.2 °C was considered as constant. Clinical tumour temperatures typically vary between 40 °C and 41 °C, and a decrease in temperature rise of at most 0.2 °C implies maintaining 95% of tumour heating. Since variations within 0.2 °C were considered as constant we now aim in this study for an improvement in average temperature of at least 0.2 °C.
Although the tumour temperature is represented by a relatively low number of temperature sensors (15–27 sensors), these are representative, since locoregional heating at 70 MHz yields a focus of about 10 cm encompassing these points and the target. A study by Fatehi et al. [Citation40] using a similar locoregional hyperthermia device for pelvic tumours demonstrated that intratumour and intraluminal temperatures measured at the same time points during individual treatments are highly correlated. Thus, the change in temperature in the tumour volume will be comparable to the change at the location of the temperature sensors.
Results
On-line use of temperature-based hyperthermia treatment planning showed successful improvement of the measured average tumour temperatures with 0.75–1.1 °C. Initial power levels were 700–800 W and an increase of 0–12.5% was realised. Results for the three clinical cases are discussed below in more detail.
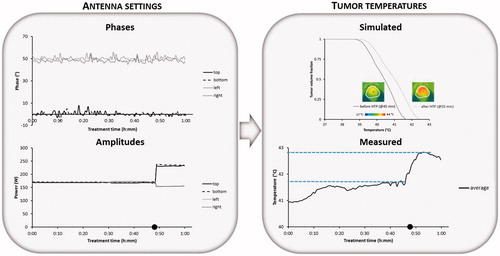
Patient 1: Treatment of the eccentric pelvic melanoma metastasis started with power ratios of top:bottom:left:right =0.75:1:1:1 and phases top:bottom:left:right =0°:65°:35°:50°. The total amount of applied power was 700 W. Shortly after the start of the steady state period the patient complained about pain in the upper abdomen, typically related to a hot spot. The power ratios were changed to 0.5:1:1:1. With the same amount of total power, this resulted in reducing the amount of power emitted from the top antenna, after which the hot spot disappeared without affecting the tumour temperature rise. The measured average tumour temperature was relatively low (38.30 °C). With the help of treatment planning the operator learned that a phase shift for the bottom antenna from 65° to 25° in combination with a change in power ratios to 0.75:1:1:1 would improve target coverage. In general, phases are most important for adequate focussing to the target region [Citation41] and the relative power of the top antenna can be increased slightly, since the phase reduction of the bottom antenna yields a lower power absorption in the abdomen close to the top antenna at the location of the previous hot spot complaint. The simulated average tumour temperature increased from 39.30 °C to 39.58 °C. At about 11 min after the start of steady state this change in settings was performed and shows a clear increase in measured average tumour temperatures after this adaptation. At 38 min the total amount of applied power was increased slightly to 725 W since no complaints occur. Next, about 45 min after the start of steady state the pain in the abdomen reappeared and the power ratios of top:bottom:left:right =0.75:1:1:1 were changed to 0.6:1:1:1, after which the hot spot disappeared. Eight minutes later the operator decided to reduce the total amount of applied power to 700 W to avoid re-emerging of complaints. The final measured average steady state tumour temperature was ∼0.85 °C higher compared to the start of the steady state period, with the help of treatment planning.
Figure 4. Example showing phase-amplitude steering for patient 1 (pelvic melanoma metastasis) with recorded phases and amplitudes per antenna, the average measured temperature during the steady state period and the simulated temperature distribution in the tumour with the simulated temperature volume histogram before and after adaptation of the phase-amplitude settings based on treatment planning. Symbol • indicates the time at which phase-amplitude steering was performed to improve tumour temperatures.
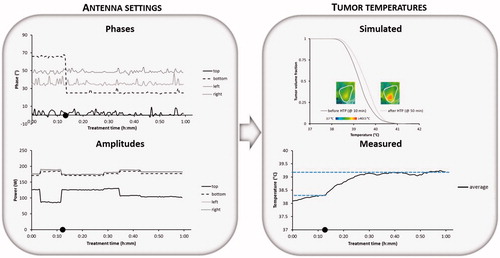
Patient 2: After initial clinical optimisation (i.e. without the use of treatment planning) this cervical cancer treatment started with power ratios of top:bottom:left:right =0.85:1:1:1 and phases top:bottom: left:right= 0°: –94°:34°:24°. The total amount of applied power was 700 W. No hot spot complaints occurred and when steady state was reached an average tumour temperature of 41 °C was measured. Next, 18 min after steady state was reached the operator decided to change the phase of the bottom antenna to –74°, since phases are most important for adequate focussing to the target region [Citation41] and treatment planning predicted that this would yield an even better tumour temperature distribution. As can be observed from , this yields indeed an increase in measured tumour temperatures. Later on (t = 32 min) the operator found with help of treatment planning that a bottom phase of –64 °C would even be slightly better. also shows the temperature volume histogram produced by the treatment planning with bottom phases –94° and –64°. Treatment planning predicted an increase in average tumour temperature from 41.49 °C to 41.84 °C when changing the bottom phase from –94° to –64°. The change in settings was performed and the temperatures indeed increased further. No hot spot complaints occurred during treatment and eventually the measured average tumour temperature increased from about 41.30 °C before phase-steering to 42.05 °C after phase steering; an increase of 0.75 °C. The small dips in the measured temperature at the beginning and near the end of the treatment are probably due to changes in perfusion levels.
Figure 5. Example showing phase steering for patient 2 (cervix) with recorded phases and amplitudes per antenna, the average measured temperature during the steady state period and the simulated temperature distribution in the tumour with the simulated temperature volume histogram before and after adaptation of the phases based on treatment planning. Symbols • indicate the times at which phase steering was performed to improve tumour temperatures.
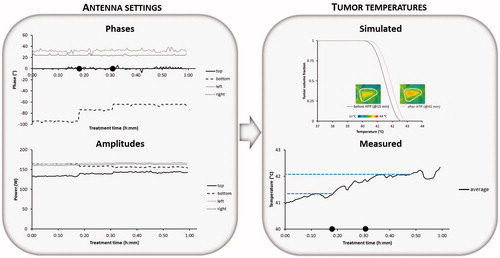
Patient 3: For this cervical cancer treatment equal amplitudes were selected and initial phase optimisation resulted in phases top:bottom:left:right= 0°:0°:50°:50°. When the steady-state period was reached the total amount of applied power was 800 W. Heating was rather effective and average tumour temperatures up to 41.70 °C were measured. After 48 min of the steady-state period had passed the patient complained about hot spots at both hips. Based on treatment planning predictions the power ratios were changed to top:bottom:left:right =1:1:0.67:0.67. With the same amount of total power, this reduced the amount of power emitted from the left and right antennas, which resolved the hot spot complaints. This substantial reduction of power emitted by both side antennas allowed a simultaneous increase of the total power from 800 to 900 W. Treatment planning predicted that this would result in an increase in average tumour temperature from 40.38 °C to 40.94 °C. As a result of this amplitude change the measured average tumour temperature increased to 42.80 °C, i.e. an increase of 1.1 °C, as can be seen in . The session was completed without further hot spot complaints.
Figure 6. Example showing amplitude steering for patient 3 (cervix) with recorded phases and amplitudes per antenna, the average measured temperature during the steady state period and the simulated temperature distribution in the tumour with the simulated temperature volume histogram before and after correction of the amplitude settings based on treatment planning. Symbol • indicates the time at which amplitude steering was performed to improve tumour temperatures.
Discussion
This work demonstrated the clinical feasibility of on-line temperature-based hyperthermia treatment planning to improve tumour temperatures. Results from three different patients showed an average tumour temperature increase of 0.75–1.1 °C. The three patients formed a representative selection of cases regarding both tumour location (eccentric vs. central) and patient sizes (slender/thin vs. obese). The use of on-line treatment planning is thus very promising to realise a substantial improvement in heating quality for hyperthermia treatments to further improve clinical outcome.
Routine clinical application of hyperthermia treatment planning is still limited and so far mainly based on SAR modelling. Previous studies have shown that with the assistance of treatment planning a good treatment quality can be realised [Citation42–44]. During hyperthermia treatments of head and neck tumours with the advanced 12-antenna HYPERcollar system a good heating quality is achieved using SAR-based treatment planning, since phase-amplitude steering based on empirical knowledge and experience is not possible for these treatments [Citation42]. For pelvic tumours, a cross-over trial using treatment planning guided phase-amplitude steering based on adaptive SAR optimisation reported similar or lower temperatures for planning-based steering compared with steering by an experienced operator [Citation44]. Prospective use of temperature-based hyperthermia treatment planning for oesophageal cancer patients has demonstrated the feasibility to improve heating effectiveness compared with standard clinical phase-amplitude settings, i.e. to realise the same tumour heating with less emitted power [Citation45]. Other studies using SAR-based and temperature-based treatment planning have demonstrated the effectiveness of treatment planning in hot spot suppression [Citation29,Citation43], but an actual improvement in achieved tumour temperatures compared with experience-based phase-amplitude steering during treatment has not been demonstrated yet. The present work shows a clear potential for substantial improvement of tumour heating using hyperthermia treatment planning.
The initial optimisation was a clinical optimisation procedure combining standard amplitude settings with a phase-optimisation using an E-field probe. Using this procedure we followed our standard treatment protocol and the quality assurance guidelines [Citation31]. Moreover, starting with clinically optimised settings and applying treatment planning during treatment to improve tumour temperatures allows to establish directly whether an improvement in achieved tumour temperatures can be realised with help of treatment planning.
Clinically optimised settings apply standard amplitude settings, which are not necessarily optimal for each patient and the E-field probe is used to obtain optimal phase settings by measuring the electric field in the direction of the probe. This is in principle the direction of the dominant E-field component, but the actual probe alignment in the patient might be slightly different. This influences the optimised phase settings and explains why clinically optimised phase settings could be improved by treatment planning to realise a better focussing for patients 1 and 2. Moreover, this clinical optimisation realises a heating focus and does not account for normal tissue hot spots, which explains the possible occurrence of hot spots during treatment. Temperatures at tissue interfaces/potential hot spot locations will be higher than in the surrounding normal tissues but will not give complaints as long as the temperature remains below the pain threshold at ∼45 °C [Citation46]. Thus a small change in temperature crossing that threshold will cause the sudden appearance of hot spots. This may happen even at constant amplitude and phase settings as the regional temperature may have been slowly increasing over a relatively long time period of power deposition with constant system settings. These hot spots can be resolved typically by adaptation of the amplitudes based on on-line treatment planning. Thus, clinical optimisation provides a good starting point but phase-amplitude settings should be optimised further during treatment, based on the clinical reality. Therefore, the final optimisation result was a mix of clinical and numerical optimisation.
The benefit of such a combined optimisation has been demonstrated before in a prospective study [Citation45]. In this study involving 48 treatment sessions of oesophageal cancer patients, a similar initial temperature rise (i.e. SAR) was measured in the tumour and a lower temperature rise was measured in the back musculature near the spinal cord for a combination of clinically optimised phases and numerically optimised amplitudes compared with clinically optimised settings. This indicated more efficient heating, such that higher tumour temperatures could be achieved, without overheating normal tissue.
However, there are limitations to the reliability of pre-treatment planning. Predicted temperatures are strongly dependent on the dielectric and thermal tissue properties used for calculations. Tissue properties show a large inter and intra patient variation up to 50%, but patient-specific tissue properties are not available and, therefore, average literature values are presently used for simulations in hyperthermia treatment planning [Citation34,Citation47,Citation48]. These uncertainties in tissue properties explain why hyperthermia treatment planning is not quantitatively reliable. In the present study the predicted increases in average temperature tended to be lower than the actual realised improvement in temperature. Nevertheless, we can conclude that the fact that the tumour temperatures increased after phase-amplitude steering was predicted correctly and therefore online planning is very helpful to assist in phase-amplitude steering during clinical hyperthermia. Moreover, the qualitative difference in heatability of these patients was also relatively well predicted. The achieved average tumour temperatures for the patient with a melanoma metastasis (Patient 1) were relatively low, even after improvement, and a much lower average tumour temperature was also predicted by treatment planning compared to the other two patients. This qualitative prediction of heatability has also been described by Sreenivasa et al. [Citation49].
Ongoing research aims to further improve treatment planning predictions by, e.g. reconstruction of patient-specific dielectric properties using MR dielectric imaging and advanced thermal modelling using temperature-dependent perfusion and discrete vasculature [Citation50–52]. MR dielectric imaging will improve the reliability of absolute SAR predictions, which are the input for thermal calculations. A temperature-dependent perfusion model [Citation48] would improve the prediction of transient temperatures. A previous study showed that ignoring the temperature dependence of the perfusion can lead to a significant overestimation of the absolute thermal dose that can be delivered [Citation48]. However, a temperature-dependent model yields substantially larger calculation times and whether a correct quantitative estimation of the thermal dose is essential for optimisation of the thermal dose should be investigated further. Modelling discrete vasculature is important for accurate absolute temperature predictions, since the Pennes model does not account for the local thermal impact of the vasculature and the direction of the blood flow [Citation51,Citation53,Citation54]. However, inclusion of discrete vasculature would make the treatment planning process more time-consuming and it also increases the burden for the patient, since treatment planning then requires an additional MR angiography for vessel segmentation. Further research should reveal to which extent this could improve results of adaptive treatment planning and whether the possible benefit outweighs the extra patient burden and clinical workload. Although the quantitative accuracy of hyperthermia treatment planning can be improved, the cases showing temperature improvement presented in this paper and the capability of adequate hot spot suppression demonstrated before [Citation29,Citation43] show that the qualitative accuracy of treatment planning already allows very useful application in clinical hyperthermia.
In view of the potential impact of uncertainties in tissue and perfusion properties on the robustness of optimisation, future research should also focus on evaluating the difference in clinical effectiveness between SAR-based and temperature-based adaptive planning. Temperature-based planning could be more effective, because it includes clinically relevant cooling mechanisms as blood flow, thermal conduction and water bolus cooling, that have a large effect on the temperature, and are not taken into account by SAR-based planning [Citation47,Citation55]. The present work, therefore, applied temperature-based planning and is the first study to demonstrate an actual improvement in achieved tumour temperatures using on-line planning compared with experience-based phase-amplitude steering during treatment. Nevertheless, since the exact impact of uncertainties in tissue and perfusion parameters is still unknown, SAR-based planning should also be further investigated and compared with temperature-based planning.
In this first feasibility test to use temperature-based hyperthermia treatment planning to improve tumour temperatures automatic phase-amplitude optimisation was not yet implemented in the graphical user interface and the operator manually compared several alternative system settings to determine whether an improvement in tumour temperatures could be achieved. This is quite time consuming and does not guarantee that an optimal tumour temperature will be realised. Thus, before initialising a larger study, aiming at more routine use, the present software (i.e. the graphical user interface in ) will be expanded with automatic phase-amplitude optimisation and hot spot suppression.
On-line planning has some challenges compared to pre-treatment planning. Several numerical phase-amplitude optimisation methods have been described in the literature [Citation38,Citation56–59] and on-line use of this optimisation requires very fast algorithms, e.g. by using superposition of pre-computed temperature distributions [Citation38,Citation59], possibly in combination with a substantial reduction of the number of constraints. A possible strategy to reduce constraints is element grouping, which combines tissue voxels that realise approximately the same maximum temperature for approximately the same phase-amplitude settings [Citation38,Citation60].
The principle of phase-amplitude steering is basically similar for all phased array systems, regardless of the exact type and number of radiofrequency antennas. It can, therefore, be expected that improvement of the heating quality can also be achieved with other locoregional heating systems, such as BSD-2000 series [Citation23,Citation61]. After these promising results it seems worthwhile to initialise a larger study to investigate whether temperature-based treatment planning can realise a substantial improvement in heating quality compared with experience-based steering for a large number of patients.
Conclusions
Improvement of tumour temperatures using on-line temperature-based treatment planning is clinically feasible. A next, worthwhile step is applying on-line temperature-based treatment planning with automatic optimisation for a larger number of patients.
Disclosure statement
No potential conflict of interest was reported by the authors.
Additional information
Funding
References
- Overgaard J, González González D, Hulshof MCCM, et al. (1995). Randomised trial of hyperthermia as adjuvant to radiotherapy for recurrent or metastatic malignant melanoma. European Society for Hyperthermic Oncology. Lancet 345:540–3.
- Vernon CC, Hand JW, Field SB, et al. (1996). Radiotherapy with or without hyperthermia in the treatment of superficial localized breast cancer: results from five randomized controlled trials. International Collaborative Hyperthermia Group. Int J Radiat Oncol Biol Phys 35:731–44.
- Rau B, Wust P, Hohenberger P, et al. (1998). Preoperative hyperthermia combined with radiochemotherapy in locally advanced rectal cancer: a phase II clinical trial. Ann Surg 227:380–9.
- Van der Zee J, González González D, Van Rhoon GC, et al. (2000). Comparison of radiotherapy alone with radiotherapy plus hyperthermia in locally advanced pelvic tumours: a prospective, randomised, multicentre trial. Dutch Deep Hyperthermia Group. Lancet 355:1119–25.
- Issels RD, Lindner LH, Verweij J, et al. (2010). Neo-adjuvant chemotherapy alone or with regional hyperthermia for localised high-risk soft-tissue sarcoma: a randomised phase 3 multicentre study. Lancet Oncol 11:561–70.
- Cihoric N, Tsikkinis A, van Rhoon G, et al. (2015). Hyperthermia-related clinical trials on cancer treatment within the ClinicalTrials.gov registry. Int J Hyperthermia 31:609–14.
- Franckena M, Fatehi D, de Bruijne M, et al. (2009). Hyperthermia dose-effect relationship in 420 patients with cervical cancer treated with combined radiotherapy and hyperthermia. Eur J Cancer 45:1969–78.
- Wust P, Rau B, Gellerman J, et al. (1998). Radiochemotherapy and hyperthermia in the treatment of rectal cancer. Recent Results Cancer Res 146:175–91.
- Dewhirst MW, Sim DA, Sapareto S, et al. (1984). Importance of minimum tumor temperature in determining early and long-term responses of spontaneous canine and feline tumors to heat and radiation. Cancer Res 44:43–50.
- Cox RS, Kapp DS. (1992). Correlation of thermal parameters with outcome in combined radiation therapy-hyperthermia trials. Int J Hyperthermia 8:719–32.
- van Rhoon GC. (2016). Is CEM43 still a relevant thermal dose parameter for hyperthermia treatment monitoring? Int J Hyperthermia 32:50–62.
- Crezee H, van Leeuwen CM, Oei AL, et al. (2016). Thermoradiotherapy planning: Integration in routine clinical practice. Int J Hyperthermia 32:41–9.
- Repasky EA, Evans SS, Dewhirst MW. (2013). Temperature matters! And why it should matter to tumor immunologists. Cancer Immunol Res 1:210–16.
- Issels R, Kampmann E, Kanaar R, et al. (2016). Hallmarks of hyperthermia in driving the future of clinical hyperthermia as targeted therapy: translation into clinical application. Int J Hyperthermia 32:89–95.
- Oei AL, Ahire VR, van Leeuwen CM, et al. (2017). Enhancing radiosensitisation of BRCA2-proficient and BRCA2-deficient cell lines with hyperthermia and PARP1-i. Int J Hyperthermia [Epub ahead of print]. doi: 10.1080/02656736.2017.1324642
- Krawczyk PM, Eppink B, Essers J, et al. (2011). Mild hyperthermia inhibits homologous recombination, induces BRCA2 degradation, and sensitizes cancer cells to poly (ADP-ribose) polymerase-1 inhibition. Proc Natl Acad Sci USA 108:9851–6.
- Song CW. (1984). Effect of local hyperthermia on blood flow and microenvironment: a review. Cancer Res 44:4721s–30s.
- Vujaskovic Z, Song CW. (2004). Physiological mechanisms underlying heat-induced radiosensitization. Int J Hyperthermia 20:163–74.
- Schiffman M, Castle PE, Jeronimo J, et al. (2007). Human papillomavirus and cervical cancer. Lancet 370:890–907.
- Oei AL, van Leeuwen CM, Ten Cate R, et al. (2015). Hyperthermia Selectively Targets Human Papillomavirus in Cervical Tumors via p53-Dependent Apoptosis. Cancer Res 75:5120–9.
- Crezee J, Van Haaren PMA, Westendorp H, et al. (2009). Improving locoregional hyperthermia delivery using the 3-D controlled AMC-8 phased array hyperthermia system: a preclinical study. Int J Hyperthermia 25:581–92.
- Wust P, Beck R, Berger J, et al. (2000). Electric field distributions in a phased-array applicator with 12 channels: measurements and numerical simulations. Med Phys 27:2565–79.
- Turner PF, Tumeh A, Schaefermeyer T. (1989). BSD-2000 approach for deep local and regional hyperthermia: physics and technology. Strahlenther Onkol 165:738–41.
- Stauffer PR. (2005). Evolving technology for thermal therapy of cancer. Int J Hyperthermia 21:731–44.
- Li Z, Vogel M, Maccarini PF, et al. (2011). Improved hyperthermia treatment control using SAR/temperature simulation and PRFS magnetic resonance thermal imaging. Int J Hyperthermia 27:86–99.
- Winter L, Oberacker E, Paul K, et al. (2016). Magnetic resonance thermometry: Methodology, pitfalls and practical solutions. Int J Hyperthermia 32:63–75.
- Kok HP, Wust P, Stauffer PR, et al. (2015). Current state of the art of regional hyperthermia treatment planning: a review. Radiat Oncol 10:196.
- Kok HP, Ciampa S, De Kroon-Oldenhof R, et al. (2014). Toward on-line adaptive hyperthermia treatment planning: correlation between measured and simulated specific absorption rate changes caused by phase steering in patients. Int J Radiat Oncol Biol Phys 90:438–45.
- Kok HP, Korshuize - van Straten L, Bakker A, et al. (2017). On-line adaptive hyperthermia treatment planning during locoregional heating to suppress treatment limiting hot spots. Int J Radiat Oncol Biol Phys 99:1039–47.
- De Leeuw AAC, Crezee J, Lagendijk JJW. (1993). Temperature and SAR measurements in deep-body hyperthermia with thermocouple thermometry. Int J Hyperthermia 9:685–97.
- Bruggmoser G, Bauchowitz S, Canters R, et al. (2012). Guideline for the clinical application, documentation and analysis of clinical studies for regional deep hyperthermia: quality management in regional deep hyperthermia. Strahlenther Onkol 188(Suppl 2):198–211.
- Kok HP, Kotte ANTJ, Crezee J. (2017). Planning, optimisation and evaluation of hyperthermia treatments. Int J Hyperthermia. Hyperthermia 33:593–607.
- Hornsleth SN, Mella O, Dahl O. (1996). A new segmentation algorithm for finite difference based treatment planning systems. In: Franconi C, Arcangeli G, Cavaliere R, eds. Hyperthermic oncology 1996. Vol. 2, Rome, Italy Tor Vergata, 521–3.
- Gabriel C, Gabriel S, Corthout E. (1996). The dielectric properties of biological tissues: I. Literature survey. Phys Med Biol 41:2231–49.
- ESHO Taskgroup Committee. (1992). Treatment Planning and Modelling in Hyperthermia, a Task Group Report of the European Society for Hyperthermic Oncology. Rome, Italy: Tor Vergata.
- Taflove A, Hagness SC. (2000). Computational electrodynamics. 2nd ed. Boston, London: Artech House.
- Berenger JP. (1994). A perfectly matched layer for the absorption of electromagnetic-waves. J Comput Phys 114:185–200.
- Das SK, Clegg ST, Samulski TV. (1999). Computational techniques for fast hyperthermia temperature optimization. Med Phys Phys 26:319–28.
- Pennes HH. (1948). Analysis of tissue and arterial blood temperatures in the resting human forearm. J Appl Physiol 1:93–122.
- Fatehi D, van der Zee J, Notenboom A, et al. (2007). Comparison of intratumor and intraluminal temperatures during locoregional deep hyperthermia of pelvic tumors. Strahlenther Onkol 183:479–86.
- Van der Wal E, Franckena M, Wielheesen DH, et al. (2008). Steering in locoregional deep hyperthermia: evaluation of common practice with 3D-planning. Int J Hyperthermia 24:682–93.
- Rijnen Z, Bakker JF, Canters RA, et al. (2013). Clinical integration of software tool VEDO for adaptive and quantitative application of phased array hyperthermia in the head and neck. Int J Hyperthermia 29:181–93.
- Canters RA, Franckena M, Van der Zee J, et al. (2008). Complaint-adaptive power density optimization as a tool for HTP-guided steering in deep hyperthermia treatment of pelvic tumors. Phys MedBiol 53:6799–820.
- Franckena M, Canters R, Termorshuizen F, et al. (2010). Clinical implementation of hyperthermia treatment planning guided steering: a cross over trial to assess its current contribution to treatment quality. Int J Hyperthermia 26:145–57.
- Kok HP, Van Haaren PMA, van de Kamer JB, et al. (2006). Prospective treatment planning to improve locoregional hyperthermia for oesophageal cancer. Int J Hyperthermia 22:375–89.
- Stoll AM, Greene LC. (1959). Relationship between pain and tissue damage due to thermal radiation. J Appl Physiol 14:373–82.
- De Greef M, Kok HP, Correia D, et al. (2010). Optimization in hyperthermia treatment planning: the impact of tissue perfusion uncertainty. Med Phys 37:4540–50.
- De Greef M, Kok HP, Correia D, et al. (2011). Uncertainty in hyperthermia treatment planning: the need for robust system design. Phys Med Biol. 56:3233–50.
- Sreenivasa G, Gellermann J, Rau B, et al. (2003). Clinical use of the hyperthermia treatment planning system HyperPlan to predict effectiveness and toxicity. Int J Radiat Oncol Biol Phys 55:407–19.
- Balidemaj E, Kok HP, Schooneveldt G, et al. (2016). Hyperthermia treatment planning for cervical cancer patients based on electrical conductivity tissue properties acquired in vivo with EPT at 3 T MRI. Int J Hyperthermia 32:558–68.
- Kok HP, Van den Berg CAT, Bel A, et al. (2013). Fast thermal simulations and temperature optimization for hyperthermia treatment planning, including realistic 3D vessel networks. Med Phys 40:103303.
- Schooneveldt G, Kok HP, Balidemaj E, et al. (2016). Improving hyperthermia treatment planning for the pelvis by accurate fluid modelling. Med Phys 43:5442–52.
- Kok HP, Gellermann J, Van den Berg CA, et al. (2013). Thermal modelling using discrete vasculature for thermal therapy: a review. Int J Hyperthermia 29:336–45.
- Kotte AN, van Leeuwen GM, Lagendijk JJ. (1999). Modelling the thermal impact of a discrete vessel tree. Phys Med Biol 44:57–74.
- Canters RA, Paulides MM, Franckena M, et al. (2013). Benefit of replacing the Sigma-60 by the Sigma-Eye applicator. A Monte Carlo-based uncertainty analysis. Strahlenther Onkol 189:74–80.
- Bardati F, Borrani A, Gerardino A, et al. (1995). SAR optimization in a phased array radiofrequency hyperthermia system. IEEE Trans Biomed Eng 42:1201–7.
- Cappiello G, Mc Ginley B, Elahi MA, et al. (2017). Differential evolution optimization of the SAR distribution for head and neck hyperthermia. IEEE Trans Biomed Eng 64:1875–85.
- Wiersma J, Van Maarseveen RAM, van Dijk JDP. (2002). A flexible optimization tool for hyperthermia treatments with RF phased array systems. Int J Hyperthermia 18:73–85.
- Kok HP, Van Haaren PMA, van de Kamer JB, et al. (2005). High-resolution temperature-based optimization for hyperthermia treatment planning. Phys Med Biol 50:3127–41.
- Kok HP, De Greef M, Bel A, et al. (2009). Acceleration of high resolution temperature based optimization for hyperthermia treatment planning using element grouping. Med Phys 36:3795–805.
- Wust P, Seebass M, Nadobny J, et al. (1996). Simulation studies promote technological development of radiofrequency phased array hyperthermia. Int J Hyperthermia 12:477–94.