
Abstract
Purpose: To analyse the precise ablative margin (AM) after radiofrequency ablation (RFA) for hepatocellular carcinoma (HCC) and the correlation between AM and local tumour progression (LTP) with a three-dimension (3D) reconstruction technique.
Methods: From March 2011 to May 2013, 134 patients who underwent RFA for 159 primary or recurrent HCCs within Milan criteria were enrolled. Contrast-enhanced computed tomography (CECT) scans were performed 1 week before and 1 month after treatment. The AM was measured in various directions using a 3D reconstruction technique that shows the index tumour and ablated zone on the same image. The average of all obtained AMs (average AM) and the smallest AM (min-AM) were calculated.
Results: The min-AM after RFA ranged from 1 to 9.3 mm (median ± standard deviation, 4.8 ± 1.8 mm). LTP was observed in 19 tumours from 19 patients. The median min-AM was 3.1 ± 1.6 mm for patients with LTP, while the median min-AM of patients without LTP was 5.1 ± 1.8 mm (p = 0.023). After RFA, the 1-, 2- and 3-year LTP rates were 10.9, 25.9 and 35.1%, respectively, for patients with min-AM <5 mm, and 4.1, 4.1 and 4.1%, respectively, for patients with min-AM ≥5 mm (p = 0.016). Multivariate analysis showed that only min-AM <5 mm was an independent risk factor for LTP after RFA (p = 0.044, hazard ratio =4.587, 95% confidence interval, 1.045–22.296).
Conclusions: The 3D reconstruction technique is a precise method for evaluating the post-ablation margin. Patients with min-AM less than 5 mm had a higher probability of developing LTP.
Introduction
Hepatocellular carcinoma (HCC) is a common liver cancer worldwide [Citation1]. Radiofrequency ablation (RFA) has emerged as a first-line curative treatment for patients with small HCC [Citation2–5], especially for patients without indications for surgical resection. Several studies have reported that RFA can achieve similar overall survival rates in early-stage HCC compared with liver resection [Citation6–10].
It has been reported that a tumour-free margin is one of the most important factors affecting the rate of LTP after curative treatments [Citation11–14]. Several early studies declared that a post-ablation safety margin over 0.5 cm could reduce LTP significantly [Citation15,Citation16]. Hereby, a sufficient post-ablation safety margin is of great necessity to improve local control rates after RFA [Citation17]. However, even with a specific standard, if we are unable to generate pre-planned location and extent of ablation, it will still lead to an inadequate ablative margin (AM). In addition, it is nearly impossible to precisely distinguish the AM between the index tumour and the ablated zone by conventional two-dimensional (2D) contrast-enhanced imaging obtained before and after treatment in a visual, side-by-side manner, especially in an oblique dimension. The ablation zone after RFA appears to have no enhancement, and there is no significant difference between the initial tumour and surrounding normal hepatic parenchyma on post-ablation images [Citation18]. A relatively objective way to evaluate the AM is based on the positional relation of iodised oil infused prior to ablation and the ablated zone [Citation19,Citation20]. However, this method cannot be used for hypovascular tumours.
Three-dimensional (3D) imaging is known to be advantageous for its ability to display spatial relationships. Therefore, we can rotate reconstructed 3D computed tomography (CT) images at different angles and establish the best position of an image to fully analyse a selected local region, compensating for the limitations of 2D CT images characterised by simple planes. Moreover, with the help of the combined technique showing the index tumour and the ablated zone on the same image, the AM can be more accurately observed and measured.
The purpose of this study was to investigate the results of a new 3 D reconstruction software for evaluating the AM and its correlation with LTP.
Materials and methods
Patients
This retrospective study was performed according to the guidelines of the Helsinki Declaration. The study was approved by the Ethical Committee of the First Affiliated Hospital of Sun Yat-sen University (Guangzhou, China) with waived informed consent. Patients with primary and first-recurrent HCCs after liver resection who were about to receive RFA were enrolled. The exclusion criteria included: (a) tumours with a location close to the liver capsule or critical structure (i.e., gallbladder, heart, gastrointestinal tract, portahepatis, or diaphragm) of 5 mm or less; and (b) patients without CT imaging one week before RFA or 1 month after RFA.
The diagnosis of HCC was based on the clinical criteria from the American Association for the Study of Liver Diseases [Citation21]: one contrast enhanced image showed intense contrast uptake during the arterial phase followed by contrast washout during venous or delayed phases or biopsy diagnosis of HCC.
Radiofrequency ablation
A Cool-tip RFA system (Radionics, Burlington, MA, USA) with the cooling bare 3 cm long 17 G Cool-tip electrode was used for RFA. After adequate sedation of the patient, the radiofrequency electrode was introduced percutaneously into the lesion under the guidance of ultrasound. The number of needle punctures and ablation points was determined by the number and diameters of the tumours. Single-needle single-point ablation was used for the tumours with a diameter of 1.5 cm or less, and multi-needle multi-point ablation was needed for tumours larger than 1.5 cm or a multi-nodule tumours. In the process of multi-point ablation, the first ablation began at the deepest part of the tumour and the electrode was retracted back 1.5–2.0 cm to begin another ablation after completion of each point. The process was repeated until the tumour was completely destroyed with the goal of achieving an AM of 5 mm. All treatments were performed by X.Y.X. and M.K both of who had experience with RFA for more than 10 years. Blood pressure, heart rate, respiration and oxygen saturation were monitored during ablation.
Contrast-enhanced CT (CECT) examination
The 64-slice helical CT (Aquilion 64, Toshiba Medical System, Tokyo, Japan) scans were performed for each patient one week before the ablation and one month after the ablation. The scanning range of the CECT was at least from the top of the diaphragm to the lower edge of the liver. The contrast agent at a volume of 1.5 ml/kg (Ultravist 300, Schering, Berlin, Germany) was injected through the cubital vein using a high-pressure syringe. The injection flow rate was 3–4 ml/s, and the total dose was within 150 ml. After the contrast agent was injected, 40 ml normal saline was administered at the same injection rate to ensure the full application of the contrast agent. The arterial phase (27 s after contrast agent injection) and portal venous phase (60 s after contrast agent injection) were scanned for each examination. The scan parameters were as follows: 120 kV, 200–250 mAs, collimation: 64 mm × 0.5 mm, slice thickness: 0.5 mm, slice increments: 0.5 mm and pitch: 0.9.
Three-dimensional reconstruction
The 3D reconstruction software (Myrian, Intrasense, Montpellier, France) was applied to reconstruct the 3D images and to measure the AM in various directions. This software had the advantages of unmatched 3D visualisation capabilities and one-click identification of liver, portal branches and vascular territories. The selected 3D images in view can be displayed as individual images or as a combined image. All the procedures were induced by one author (C.L.J., with over 5 years of experiences of 3D image reconstruction), who was blinded to the information of LTP when AM values were obtained.
First, the CT data as DICOM files were imported into the software, which were acquired from the archive of the PACS workstation. Next, 20–25 typical CT images on the axial plane were selected to mark the margin of the hepatic contour and regions of interest (ROI) (i.e., initial HCC on pre-RFA images and ablated zone on post-RFA images 1 month later). After fine adjustments on both coronal and vertical planes, a reconstructed 3D image with a smooth margin was displayed by the automatic system. The CT images obtained before RFA were applied to describe the HCC tumours, while the images obtained at 1 month after RFA were applied to describe the ablation zone. When reconstructed 3D images of before and after RFA were both satisfactory, the initial tumour and ablation zone were combined into one image by one-click, with artificial landmarks on 3–4 axial planes being used for precise localisation if necessary. Landmarks were carefully set in corresponding regions, such as the branching point of the hepatic vessels or segmental portal vein, on both pre- and post-ablation CT images. With a set of landmarks on both images, the combination could use those landmarks to accurately align the images. Furthermore, the portal vein and the hepatic vein were combined. Thereafter, we could directly visualise the spatial relationship of the initial HCC and the ablation zone. In addition, rotation in various directions and local enlargement were performed to observe the AM and the surrounding vessels.
To quantitatively measure the AM on the combined image, a 12 O’clock–6 O’clock coordinate system was applied, as described by Kim et al. [Citation22] (Supplementary Figure 1). To describe direction, the coordinate system was used, which consisted of two numerals: the first numeral indicated the direction on the axial plane from 0 O’clock to 11 O’clock and the second numeral indicated the direction on the vertical plane from 0 O’clock to 6 O’clock. Each direction line could be drawn on the surface of the tumour similar to longitude and latitude lines. Intersecting points made by each type of line created 62 coordinates, including the top and the bottom. All the AM values were recorded as direction and distance between the tumour and the ablated zone. Of all the obtained AMs, the average value was accepted as the average AM, and the smallest AM was accepted as the min-AM.
Moreover, if the LTP was detected during the follow-up periods, the CT series with LTP were also reconstructed and added to the 3D combined image to mark the location of the LTP. The recorded AM at this direction, which was also measured on the CT images 1 month after RFA, was picked out and defined as the LTP-associated AM.
Follow-up
Contrast-enhanced ultrasound (CEUS) was performed the following morning after the treatment to evaluate the technical success of ablation. An additional RFA was performed if residual viable tumour tissue was found. If an incomplete ablation was still observed after the additional RFA, the treatment was defined as a failure, and these patients were referred to other therapies. CECT were performed 1 month after the treatment. Thereafter, CECT was performed once every 3–6 months for the first 5 years and once every 12 months after 5 years. During the follow-up period, LTP detected at any point was included. LTP was defined as the re-appearance of nodular or rim tumour on CECT (hyper-enhancement during the artery and washout during venous or delayed phases) or positive histology at the edge of the ablation zone after complete ablation was achieved [Citation23,Citation24]. When LTP was detected, the CT series was reconstructed and added to the 3D reconstruction images, as above described above.
Statistical analysis
Basic information and tumour characteristics were documented. Clinical continuous variables were expressed as the mean value ± standard deviations (SD), and the range and the differences between the two groups were compared using Student’s t test or the Mann–Whitney test. Categorical variables were displayed as frequencies. The AMs of each patient were recorded and analysed by the combined image mentioned above. The first LTP during the follow-up was recorded and the 1-, 2- and 3-year cumulative LTP rates were estimated by the Kaplan–Meier method and the statistical significance was compared with the Log-Rank test. The correlations of min-AM, average AM and LTP were investigated with Spearman’s correlation coefficient. Multivariate analysis using the step wise Cox proportional hazard model was performed for the variables with p < 0.10 in the univariate analysis to investigate independent risk factors for LTP. All data were analysed with SPSS version 16.0 statistical software. A two-tailed p values < .05 was considered significant.
Results
Patient and tumour data
From March 2011 to May 2013, a total of 134 patients (21 females and 113 males; mean age, 54.3 ± 12.9 years; age range, 18–79 years) with 159 HCC tumours were enrolled in the study (). Sixty-eight patients (68/134, 50.7%) had primary HCC, and 66 patients (66/134, 49.3%) had recurrent HCC after liver resection. The maximal diameter of the tumours ranged from 1.0 to 4.9 cm (mean ± SD, 2.0 ± 0.9 cm). The detailed data of these patients are shown in .
Figure 1. Flow diagram of the study.
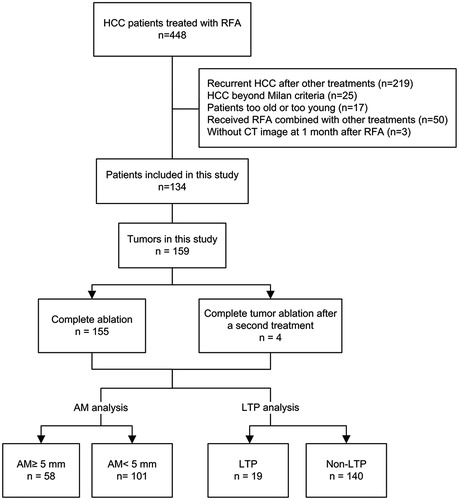
Table 1. Clinical characteristics of the enrolled patients with HCC (n = 134).
Local therapeutic efficacy
One hundred and thirty patients (130/134, 97.0%) with 155 tumours (155/159, 97.5%) received one session of RFA. Four tumours (4/159, 2.5%) in 4 patients (4/134, 3.0%) with residual viable tumour received an additional session of RFA the next day. After the additional RFA, all the HCC tumours (159/159) achieved complete ablation. A total of 138 sessions of RFA were performed.
The follow-up ranged from 2 to 69 months (median, 26 months). During the follow-up, LTP was observed in 19 patients (). Seventeen patients were diagnosed with LTP by typical CECT image and 2 patients were diagnosed by positive histological result after biopsy.
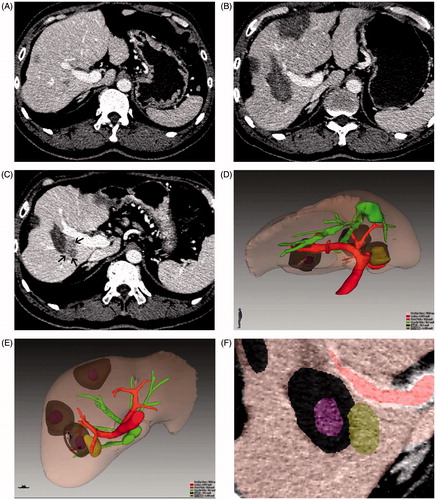
Figure 2. Images of a 54-year-old male patient with HCC who was treated with RFA. Among the three treated lesions, LTP occurred in one tumour at 9 months after treatment. (A) Conventional axial CT image in the portal phase shows HCC before ablation; (B) conventional axial CT image in the portal phase 1 month after ablation shows complete ablation; (C) conventional axial CT image in the portal phase when LTP (black arrow) is detected; (D, E) combined 3D images of the initial tumour (obtained before ablation), the ablation zone (obtained 1 month after ablation) and LTP (obtained 9 months after ablation) in various directions show their spatial relationship; (F) local enlargement images show the position relationship of the initial tumour, the ablation zone and LTP. On this image, the LTP-associated AM is 6.7 mm.
Analysis of AM
To obtain 3D images, we chose the hepatic arterial phase for 24 patients and the portal venous or equilibrium phase for the remaining 110 patients. The total time required to create the 3D reconstruction image was less than 30 min in all cases.
On the combined 3D images, the reconstructed ablation zone completely covers the original tumour lesion for each tumour nodule in all directions. No residual tumour protruding from the ablation zone was observed. The details of tumour diameter and ablation diameter are listed in . No significant differences were observed between patients with or without LTP (p = 0.187–.873).
Table 2. Comparison of tumour characteristics according to local tumour progression.
The average AM was 7.5 ± 2.6 mm (range, 2.3–15.6 mm). The mean value of the min-AM was 4.8 ± 1.8 mm (range, 1–9.3 mm). On the subgroup analysis, the mean value of min-AM for patients with LTP was 3.1 ± 1.6 mm (range, 1.0–7.1 mm) (LTP group), and the mean value of min-AM of patients without LTP was 5.1 ± 1.8 mm (range, 1.9–9.3 mm) (non-LTP group). The former group had a smaller min-AM than the latter group (p = 0.023). On the other hand, the average AM was 7.3 ± 3.5 mm (range, 2.3–14.3 mm) in the LTP group and 7.5 ± 2.5 mm (range, 2.8–13.6 mm) in the non-LTP group. There was no significant difference between these two groups (p = 0.726).
Among the 19 tumours associated with LTP, LTP-associated AM was 5.1 ± 2.7 mm (range, 1.2–10.7 mm). There was a significant positive correlation between min-AM and LTP-associated AM (r = 0.728, p < 0.001). Among all the tumours defined as completely ablated by CECT, a 5-mm min-AM was only achieved in 36.5% (58/159).
LTP rate after RFA
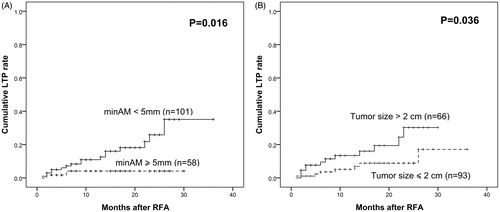
The 1-, 2- and 3-year cumulative LTP rates were 8.6, 18.0 and 23.5%, respectively. On subgroup analysis, the 1-, 2- and 3-year LTP rates were 10.9, 25.9 and 35.1% for patients with min-AM <5 mm and 4.1%, 4.1%, and 4.1% for patients with min-AM ≥5 mm, respectively (p = 0.016) (). The cumulative LTP rates at 1, 2 and 3 years were 13.4, 30.2 and 30.2% for patients with tumour size >2 cm and 5.1, 8.8 and 17.1% for patients with tumour size ≤2 cm, respectively (p = 0.036) ().
Figure 3. Comparison of cumulative local tumour progression rates according to min-AM (A) and tumour size (B).
Univariate and multivariate analysis of local tumour progression
In the univariate analysis, the potential factors for LTP with a p values of less than 0.10 were designated tumour size (p = 0.036), min-AM (p = 0.016) and AFP (p = 0.092) (). These three factors were investigated with a multivariate analysis. Multivariate analysis identified that only min-AM less than 5 mm (p = 0.044; hazard ratio [HR] = 4.587, 95% confidence interval [CI], 1.045–22.296) was an independent risk factor for LTP after RFA of HCC ().
Table 3. Univariate and multivariate analysis of possible risk factors for local tumour progression.
Discussion
We used a new 3D reconstruction technique using CT imaging to obtain combined image of tumour zones and ablated zones and to quantitatively measure the post-RFA AMs of HCC. The obtained results demonstrated that the min-AM of tumours occurring with LTP was significantly smaller than those without LTP. A safety margin over 5 mm in various directions on the combined 3D reconstruction image of RFA treatment was associated with a lower LTP. Additionally, the average AM surrounding the index tumour was not associated with LTP. Among the suspicious risk factors for LTP after RFA, only an insufficient min-AM was identified as an independent risk factor.
To date, a few studies have precisely measured the AM on 3D reconstruction images to predict LTP after RFA [Citation2,Citation22,Citation25]. However, although these studies created a combined image similar to our method and with the same purpose, we used a new 3D reconstruction technique with unmatched 3D visualisation capabilities. Our method can provide the directly visualised positional relationship of the initial tumour and ablated zone in varied directions and it can quantitatively measure post-RFA AM. Furthermore, this technique is adapted to volumetric software, which can automatically calculate the volume of the index tumour and ablative zone. All the cases in this study were reconstructed and analysed within 30 min.
Additionally, previous studies reported that only 2.7–10.6% of patients could achieve a sufficient 5-mm AM with a 3D image [Citation2,Citation22]. In our study, 36.5% of the tumours achieved the so called 5-mm safety margin on the combined 3D image. Less LTP occurred for patients who achieved a minimum 5-mm safety margin. This result further demonstrated the great importance of precisely evaluating the post-ablation margin and that the 3D combined technique might have an advantage over the previous combined image techniques in predicting the risk of LTP.
Recently, some studies have applied 3D CEUS to precisely assess the ablation range and efficacy [Citation26–28]. Although 3D CEUS has advantages such as real-time and no ionising radiation, it may miss or misdiagnose some residual tumours compared with 3D CECT [Citation27]. In the study of Wang et al. [Citation27] using 3D CECT as reference, two residual tumours had been missed by dynamic 3D-CEUS, while another lesion with inflammation at its edge was identified as tumour. As we known, 3D CEUS is prone to interference by air in the body. Therefore, residual tumours without an appropriate observation window such as those closing to lung may be missed.
It is clear that the current study has several limitations. First, we could not obtain histological proof of the AM. Although some patients had salvage liver resection, it is difficult to visualise the real AM as reference. Therefore, long-term follow-up was chosen to test the accuracy of the evaluated AM. Second, we did not compare our new 3D reconstruction technique with commonly accepted side-by-side method. It has been suggested that the assessment with combined 3D images revealed an insufficient AM, which was previously evaluated as sufficient by conventional axial imaging [Citation25,Citation29]. With this evidence, we considered that this 3D reconstruction technique was more effective and used the side-by-side method as a standard, which might not be appropriate. Third, the intra- and inter-operator reproducibility of this new 3D reconstruction technique that was used to measure the post-RFA AM was not evaluated in our study.
In conclusion, the utility of the new 3D reconstruction technique using CT imaging for post-ablation evaluation of AM is determined to be feasible. When the AM of RFA is evaluated by combined 3D images, a min-AM of 5 mm or more appears to be associated with a lower rate of LTP after RFA. Tumors without a 5-mm safety margin should receive more attention and closer follow-up. The results of this study warrant further validation.
Supplemental File
Download TIFF Image (7 MB)Disclosure statement
No potential conflict of interest was reported by the authors.
References
- Torre LA, Bray F, Siegel RL, et al. (2015). Global cancer statistics, 2012. Cancer J Clin 65:87–108.
- Bruix J, Sherman M. Practice Guidelines Committee AAftSoLD (2005). Management of hepatocellular carcinoma. Hepatology 42:1208–36.
- Forner A, Llovet JM, Bruix J. (2012). Hepatocellular carcinoma. Lancet 379:1245–55.
- Facciorusso A, Di Maso M, Muscatiello N. (2016). Microwave ablation versus radiofrequency ablation for the treatment of hepatocellular carcinoma: a systematic review and meta-analysis. Int J Hyperthermia 32:339–44.
- Zhang F, Wu G, Sun H, et al. (2014). Radiofrequency ablation of hepatocellular carcinoma in elderly patients fitting the Milan criteria: a single centre with 13 years experience. Int J Hyperthermia 30:471–9.
- Kuang M, Xie XY, Huang C, et al. (2011). Long-term outcome of percutaneous ablation in very early-stage hepatocellular carcinoma. J Gastrointest Surg 15:2165–71.
- Feng K, Yan J, Li X, et al. (2012). A randomized controlled trial of radiofrequency ablation and surgical resection in the treatment of small hepatocellular carcinoma. J Hepatol 57:794–802.
- Hasegawa K, Makuuchi M, Takayama T, et al. (2008). Surgical resection vs. percutaneous ablation for hepatocellular carcinoma: a preliminary report of the Japanese nationwide survey. J Hepatol 49:589–94.
- Chen MS, Li JQ, Zheng Y, et al. (2006). A prospective randomized trial comparing percutaneous local ablative therapy and partial hepatectomy for small hepatocellular carcinoma. Ann Surg 243:321–8.
- Hocquelet A, Balageas P, Laurent C, et al. (2015). Radiofrequency ablation versus surgical resection for hepatocellular carcinoma within the Milan criteria: a study of 281 Western patients. Int J Hyperthermia 31:749–57.
- Poon RT, Fan ST, Ng IO, Wong J. (2000). Significance of resection margin in hepatectomy for hepatocellular carcinoma: a critical reappraisal. Ann Surg 231:544–51.
- Shi M, Guo RP, Lin XJ, et al. (2007). Partial hepatectomy with wide versus narrow resection margin for solitary hepatocellular carcinoma: a prospective randomized trial. Ann Surg 245:36–43.
- Nakazawa T, Kokubu S, Shibuya A, et al. (2007). Radiofrequency ablation of hepatocellular carcinoma: correlation between local tumor progression after ablation and ablative margin. Am J Roentgenol 188:480–8.
- Shin S, Lee JM, Kim KW, et al. (2014). Postablation assessment using follow-up registration of CT images before and after radiofrequency ablation (RFA): prospective evaluation of midterm therapeutic results of RFA for hepatocellular carcinoma. Am J Roentgenol 203:70–7.
- Ikeda K, Seki T, Umehara H, et al. (2007). Clinicopathologic study of small hepatocellular carcinoma with microscopic satellite nodules to determine the extent of tumor ablation by local therapy. Int J Oncol 31:485–91.
- Motoyama T, Ogasawara S, Chiba T, et al. (2014). Coronal reformatted CT images contribute to the precise evaluation of the radiofrequency ablative margin for hepatocellular carcinoma. Abdom Imaging 39:262–8.
- Sala M, Llovet JM, Vilana R, et al. (2004). Initial response to percutaneous ablation predicts survival in patients with hepatocellular carcinoma. Hepatology 40:1352–60.
- Schraml C, Clasen S, Schwenzer NF, et al. (2008). Diagnostic performance of contrast-enhanced computed tomography in the immediate assessment of radiofrequency ablation success in colorectal liver metastases. Abdom Imaging 33:643–51.
- Koda M, Tokunaga S, Fujise Y, et al. (2012). Assessment of ablative margin after radiofrequency ablation for hepatocellular carcinoma; comparison between magnetic resonance imaging with ferucarbotran and enhanced CT with iodized oil deposition. Eur J Radiol 81:1400–4.
- Nishikawa H, Inuzuka T, Takeda H, et al. (2011). Percutaneous radiofrequency ablation therapy for hepatocellular carcinoma: a proposed new grading system for the ablative margin and prediction of local tumor progression and its validation. J Gastroenterol 46:1418–26.
- Bruix J, Sherman M. American Association for the Study of Liver D (2011). Management of hepatocellular carcinoma: an update. Hepatology 53:1020–2.
- Kim YS, Lee WJ, Rhim H, et al. (2010). The minimal ablative margin of radiofrequency ablation of hepatocellular carcinoma (>2 and <5 cm) needed to prevent local tumor progression: 3D quantitative assessment using CT image fusion. AJR Am J Roentgenol 195:758–65.
- Hao Y, Numata K, Ishii T, et al. (2017). Rate of local tumor progression following radiofrequency ablation of pathologically early hepatocellular carcinoma. World J Gastroenterol 23:3111–21.
- Kawamura Y, Ikeda K, Seko Y, et al. (2011). Heterogeneous type 4 enhancement of hepatocellular carcinoma on dynamic CT is associated with tumor recurrence after radiofrequency ablation. Am J Roentgenol 197:W665–73.
- Makino Y, Imai Y, Igura T, et al. (2013). Utility of computed tomography fusion imaging for the evaluation of the ablative margin of radiofrequency ablation for hepatocellular carcinoma and the correlation to local tumor progression. Hepatol Res 43:950–8.
- Bartolotta TV, Taibbi A, Matranga D, et al. (2015). 3D versus 2D contrast-enhanced sonography in the evaluation of therapeutic response of hepatocellular carcinoma after locoregional therapies: preliminary findings. Radiol Med 120:695–704.
- Wang Y, Jing X, Ding J. (2016). Clinical value of dynamic 3-dimensional contrast-enhanced ultrasound imaging for the assessment of hepatocellular carcinoma ablation. Clin Imaging 40:402–6.
- Tanaka T, Ikeda K, Sorin Y, et al. (2016). Three-dimensional imaging using contrast-enhanced and three-dimensional ultrasound techniques in the ablative zone treated with a multipolar radiofrequency ablation system for hepatocellular carcinoma. Oncology 90:255–60.
- Shi M, Zhang CQ, Zhang YQ, et al. (2004). Micrometastases of solitary hepatocellular carcinoma and appropriate resection margin. World J Surg 28:376–81.