
 ?Mathematical formulae have been encoded as MathML and are displayed in this HTML version using MathJax in order to improve their display. Uncheck the box to turn MathJax off. This feature requires Javascript. Click on a formula to zoom.
Abstract
Introduction: Magnetic resonance-guided high-intensity focused ultrasound (MRgHIFU) treatments of mobile organs require locking the HIFU beam on the targeted tissue to maximise heating efficiency. We propose to use a standalone 3 D ultrasound (US)-based motion correction technique using the HIFU transducer in pulse-echo mode. Validation of the method was performed in vitro and in vivo in the liver of pig under MR-thermometry.
Methods: 3 D-motion estimation was implemented using ultrasonic speckle-tracking between consecutive acquisitions. Displacement was estimated along four sub-apertures of the HIFU transducer by computing the normalised cross-correlation of backscattered signals followed by a triangulation algorithm. The HIFU beam was steered accordingly and energy was delivered under real-time MR-thermometry (using the proton resonance frequency shift method with online motion compensation and correction of associated susceptibility artefacts). An MR-navigator echo was used to assess the quality of the US-based motion correction.
Results: Displacement estimations from US measurements were in good agreement with 1 D MR-navigator echo readings. In vitro, the maximum temperature increase was improved by 37% as compared to experiments performed without motion correction and temperature distribution remained much more focussed. Similar results were reported in vivo, with an increase of 35% on the maximum temperature using this US-based HIFU target locking.
Conclusion: This standalone 3D US-based motion correction technique is robust and allows maintaining the HIFU focal spot in the presence of motion without adding any burden or complexity to MR thermal imaging. In vitro and in vivo results showed about 35% improvement in heating efficiency when focus position was locked on the target using the proposed technique.
Keywords:
Introduction
Magnetic resonance-guided high-intensity focused ultrasound (MRgHIFU) combines two fully non-invasive methods, extracorporeal HIFU for therapeutic purpose and magnetic resonance imaging (MRI) for monitoring the procedure in real-time through MR-thermometry. MRgHIFU therapies have been successfully delivered clinically in static organs, such as brain [Citation1], bones [Citation2] or uterus [Citation3]. However, treatments of mobile organs (e.g. liver, kidney, pancreas, heart …) are much more challenging. Respiratory motion amplitude (typically 10 mm with 10 mm.s−1 maximal speed [Citation4]) is greater than the focus size (e.g. ∼2 mm at -6 dB in the direction transverse to the axis of propagation). Thereby, HIFU focus has to be steered in real-time to follow the targeted tissue position in order to deposit heat at the desired location, reduce the treatment time and improve the safety of the procedure [Citation5] by avoiding overheating the surrounding tissues [Citation6].
Several methods have been proposed to extract organ motion, either using MR-based information or through external sensors. In the first approach, extraction of the respiratory motion has been proposed by tracking anatomical contours [Citation7] in 2 D using optical flow algorithms [Citation8], or in 1 D using an echo MR-navigator [Citation9]. An MR-based 3 D motion tracking was proposed by combining the two aforementioned methods [Citation10]. The second approach relies on 1 D US signal [Citation11] or 2 D US imaging combined with optical flow algorithms. More recently, a 2 D US imaging correction method combined with an MR-navigator echo perpendicular to the imaging plane was proposed for a full 3 D correction [Citation12,Citation13]. Even though these methods have shown good correction capabilities, they suffer from an update time slaved to the imaging time resolution, from the need to operate an additional device inside the magnet or from the lack of 3 D correction. Ideally, a 3 D motion correction should be precise (millimeter uncertainty), independent from the MR acquisition system (to avoid imposing strong compromises on the imaging strategy) and require minimal modifications of the hardware to remain compatible with limited available space inside the magnet. A standalone, US-based 3 D motion tracking has been introduced by Pernot et al. [Citation14] using several elements of the therapeutic transducer in reception. This method estimates the displacement using a triangulation algorithm: temporal shifts in the back-scattered US signals produced by HIFU sonication from different locations of the transducer can be converted into displacement, knowing the speed of sound and the normal vectors of each selected sub-aperture. This displacement estimate can then be used for beam steering to compensate the target motion. However, this technique has only been validated in vivo without sonication and ex vivo during ablation using a mechanical system actuating the liver after surgery [Citation15]. Moreover, this technique has never been evaluated in combination with real-time MRI, although it could be of major interest for MRgHIFU on mobile organs.
As a matter of fact, monitoring temperature with MRI on mobile organs is also not trivial, since it requires combination of fast acquisition methods with real-time image processing to register each image in the time series at the same position and compensate for susceptibility artefacts (due to different organ positions) on phase images and resulting temperature maps. Although several studies reported precise thermometry on liver [Citation16,Citation17], kidney [Citation18] and heart [Citation19], a compromise is usually made between acquisition speed, volume coverage, spatial resolution and thermometry uncertainty. Thus, having a fully decoupled MR-thermometry pipeline and HIFU target locking may provide an ideal situation where MRI may be optimised to increase volume coverage for enhanced safety of the therapeutic procedure (e.g. monitoring temperature in organs located in the near and far fields of the HIFU beam and near the focus) and/or avoid compromises on image resolution or acquisition speed.
In this study, we propose a 3 D US-based motion compensation for online HIFU beam steering combined with rapid MR-thermometry (using the proton resonance frequency shift (PRFS) [Citation20] method). Such a method is expected to improve acoustic energy deposition at the desired location to increase treatment efficiency while providing online volumetric temperature imaging for enhanced safety. The methods are evaluated in vitro in an agar phantom mounted on a motion controller and in vivo in the liver of pig.
Methods
HIFU system
A MR-compatible HIFU platform (Image-guided Therapy SA, Pessac, France) was used in this study. Following this article the transducer geometry ( (see ) was taken as the reference frame of coordinates. The HIFU platform consisted of a 256-elements phase array transducer (focal length 13 cm, aperture 14.5 cm, 1 MHz operating frequency). Electrical signals emitted from the HIFU generator were controlled (amplitude, phase and duration for each channel) from MATLAB™ (MATLAB R2015a, Natick, MA) using a custom library (IGTFUS, Image-guided Therapy SA, Pessac, France). The transducer steering capability was investigated in a degassed water tank and a needle hydrophone (0.075 mm, Precision Acoustics, Dorchester, UK). The steering losses were measured to be 2.50 dB cm−1 laterally and 0.45 dB cm−1 axially. These values were measured in a deionised and degassed water tank, using a needle hydrophone. During sonication, these two values were used to correct the emitted power during focus electronic steering outside from its geometrical position.
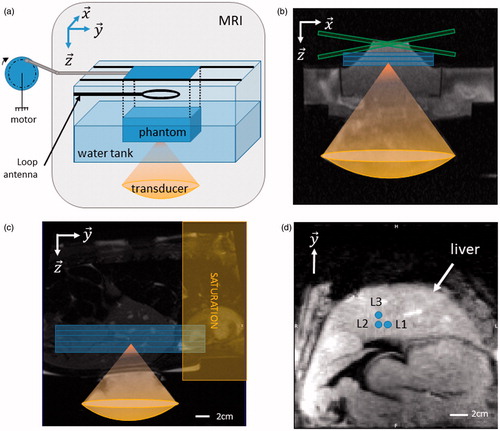
Figure 1. 3 D ultrasound (US)-based motion tracking and MR-thermometry pipeline. Schematic of the 3D US-based motion estimation system. The 256 elements HIFU transducer is represented in grey. Transducer elements operating in emission are represented in green and those in reception in blue, respectively. ( is the transducer spatial reference frame of coordinates, where the displacement
(green arrow) is estimated.
represents the normal vector of each sub-aperture along which the displacement is measured using a pulse-echo mode. The pipeline of 3D displacement estimation is presented underneath. TOF: Time Of Flight for US to reach the depth of interest; motion correction (MOCO): computing time for the displacement estimation, UPDATE: transducer phase law update (see Methods section for details). HIFU: additional US sonication to induce temperature increase of the tissue. Refresh rate is given by durations of TOF (150 µs for typical distance of 12 cm) + MOCO (18 ms) + UPDATE (19 ms) + HIFU (adjustable depending on desired update rate). (Colored version is available on the journal’s webpage).
![Figure 1. 3 D ultrasound (US)-based motion tracking and MR-thermometry pipeline. Schematic of the 3D US-based motion estimation system. The 256 elements HIFU transducer is represented in grey. Transducer elements operating in emission are represented in green and those in reception in blue, respectively. (x→,y→,z→) is the transducer spatial reference frame of coordinates, where the displacement D→ (green arrow) is estimated. ai →, i∈[1,4] represents the normal vector of each sub-aperture along which the displacement is measured using a pulse-echo mode. The pipeline of 3D displacement estimation is presented underneath. TOF: Time Of Flight for US to reach the depth of interest; motion correction (MOCO): computing time for the displacement estimation, UPDATE: transducer phase law update (see Methods section for details). HIFU: additional US sonication to induce temperature increase of the tissue. Refresh rate is given by durations of TOF (150 µs for typical distance of 12 cm) + MOCO (18 ms) + UPDATE (19 ms) + HIFU (adjustable depending on desired update rate). (Colored version is available on the journal’s webpage).](/cms/asset/f53ddbf5-a4b1-4bc8-b157-e2b3b39fa97f/ihyt_a_1433879_f0001_c.jpg)
3D ultrasound-based motion correction
3 D motion correction was performed using four sub-apertures (i = [1:4]) composed of one element in reception surrounded by six elements in emission. A 2 ms sonication at 22 W acoustic power was emitted by the 24 elements and back-scattered US signals were collected by the four elements operating in received mode. Band-rejecter filters tuned at the MR-frequency (64 MHz) were inserted into each corresponding transmission line to prevent potential interferences from the MR sequence. Each sub-aperture estimated the displacement along its normal direction (aix, aiy, aiz) in a pulse-echo mode, as shown by yellow arrows in . The displacement estimation pipeline followed these steps (see ):
Figure 2. Displacement estimation pipeline.1. Ultrasound (US) signal acquisition was performed at 100 MHz and 1400 samples were acquired. The first acquisition (t = 0) was taken as the reference (US signals surrounded in red).2. Decision tree: Absolute displacement (reset to initial position) was made if normalised cross-correlation of the current and reference data (
) was greater than a predefined threshold (0.998 in vitro and 0.98 in vivo). If normalised cross-correlation (
) was greater than 0.8, a relative displacement between t and t + dt was performed, and data were discarded otherwise.3. Computation of normalised cross-correlations and extraction of temporal lags Ti.4. Computation of the displacement
in (
by solving a pseudo-inverse problem [see EquationEquation (1)
(1)
(1) ].5. Update of the current focus position
(Colored version is available on the journal’s webpage).
![Figure 2. Displacement estimation pipeline.1. Ultrasound (US) signal acquisition was performed at 100 MHz and 1400 samples were acquired. The first acquisition (t = 0) was taken as the reference (US signals surrounded in red).2. Decision tree: Absolute displacement (reset to initial position FPt=[0 0 0]) was made if normalised cross-correlation of the current and reference data (Corrt=0,t+dt¯) was greater than a predefined threshold (0.998 in vitro and 0.98 in vivo). If normalised cross-correlation (Corrt,t+dt¯) was greater than 0.8, a relative displacement between t and t + dt was performed, and data were discarded otherwise.3. Computation of normalised cross-correlations and extraction of temporal lags Ti.4. Computation of the displacement D→ in (x→,y→,z→) by solving a pseudo-inverse problem [see EquationEquation (1)(1) Ti=2c.A.D i∈1:4(1) ].5. Update of the current focus position FPt+dt.(Colored version is available on the journal’s webpage).](/cms/asset/c25e8984-78c5-4b9f-ae82-90f0e2c7f87e/ihyt_a_1433879_f0002_c.jpg)
US backscattered signals received upstream (20 mm away from the focal spot toward the transducer) from the ultrasonic focus were sampled (Oscar, Gage Applied Technologies, Dynamic Signal LLC, Lockport, IL) at a frequency of 100 MHz (1250 points, for an acquisition duration of 12.5 µs) simultaneously on each channel. In a preliminary step before ablation, the acquisition window was adjusted by 5 mm steps in depth, to optimise displacement estimation.
Setting of two thresholds of mean correlation values, for relative and absolute (see
and
1D normalised cross-correlation was calculated between two consecutive signals acquired from each of the four sub-apertures. The temporal lag Ti corresponding to the maximum of the normalised cross-correlation was converted into displacement
The pseudo-inverse of EquationEquation (1)
Current focus position
Decision tree for incoming US-data allowed correcting for displacement estimation drifts and local displacement estimation discontinuities. Drifts have been corrected by taking the first US-acquisition in the time series as the initial position of reference. During the displacement monitoring, if the averaged normalised cross-correlation over the four sub-apertures between current and the reference US-acquisition (see on ) was greater than a pre-defined threshold (experimentally tuned between 0.997 and 0.999 for in vitro experiments and between 0.977 and 0.983 for in vivo experiments), the previous focus position
was reset to its initial position ([0 0 0]) and current focus position was computed as
=
The reset of the position based on an absolute estimation was performed only one time per respiratory cycle. A timing window of 0.5–1 s was set after each absolute estimation to prevent multiple resets. Potential discontinuities induced by artefact signals were suppressed by discarding the current acquisition if the averaged normalised cross-correlation between current and previous acquisition (see
on ) was lower than 0.80. The number of such adverse events was recorded to assess the robustness of the method. When focus correction was disabled,
was set to [0 0 0].
After the pulse-echo for displacement estimation (total duration of 18 ms), a second HIFU pulse was emitted to induce tissue heating until a new displacement estimation was performed (see ). The focus position was updated online according to the displacement estimation by uploading phase values to the HIFU generator (19 ms) and acoustic power was corrected to compensate for power losses inherent from electronic steering, using previously mentioned attenuation factors in each direction. The 3 D position was determined from a synchronised push for all sub-apertures and each US-signals were recorded on the four channels simultaneously. This differs from the initial solution proposed by Pernot et al. [Citation14] in which each position was determined sequentially through consecutive pulse-echo measurements for each individual sub-aperture. With this implementation and available hardware, the 3 D motion estimation could be performed up to 25 times per second. US signals, 3 D positions, velocities and correlation coefficients were computed and continuously displayed in real-time on a MATLAB™ plot.
MR acquisition and real-time reconstruction pipeline
MR-thermomety was performed on a 1.5 T scanner (Siemens Aera, Erlangen, Germany) using a single-shot echo-planar imaging (EPI) sequence with generalised autocalibrating partial parallel acquisition with an acceleration factor of 2. This sequence integrated a crossed-pair MR-navigator used to correlate the displacement estimations with an absolute displacement measurement. MR-navigator was positioned along the y-axis in the transducer geometry, where motion was the most significant.
During in vitro experiments, three slices were acquired in coronal orientation with the following parameters: FOV = 180 × 168 mm2, TR/TE/FA = 166 ms/14 ms/32°, voxel size = 2 × 2 × 5 mm3, partial Fourier 6/8, with a bandwidth of 1650 Hz per pixel. For in vivo experiments (see ), five slices were acquired: FOV = 224 × 224 mm2, TR/TE/FA = 140 ms/14 ms/45°, voxel size = 2 × 2 × 5 mm3, partial Fourier 6/8, with a bandwidth of 1860 Hz per pixel. Acquisition parameters were experimentally tuned to provide sufficient image quality for rapid and volumetric monitoring of temperature changes in the gel and the liver.
Figure 3. In vitro and in vivo validation. (a) The rotation of a motor is converted into a 1D translation along y-axis, using a rod and slides. The phantom is maintained above the transducer using a plastic box with a Mylar membrane glued at the bottom to allow propagation of the ultrasound beam. Typical motion settings were 10 mm of amplitudes and maximum velocities of 10 mm.s−1. Three coronal slices were acquired to monitor MR-thermometry. (b) Transverse ((x, z) plane in the transducer’s frame of reference) anatomical image of the setup. Blue box represent three slices in coronal orientation and green box represent the crossed pair navigator position. (c) Anatomical image and animal positioning. Blue box represent five MR-temperature slices positioned in coronal orientation. A saturation slab (yellow box) was positioned on top of the hepatic dome to suppress signal from the heart on the images. (d) Diagram of sonication locations in pig #2 (L1–L3), blue circles depict the focus locations for each ablation. Note that for each location a reference sonication was performed at the same location without focus position correction. Sonication locations in pig #1 (2 locations separated by 1 cm) were performed in the same anatomical region of the liver (data not shown). (Colored version is available on the journal’s webpage).
Temperature image reconstruction was performed on the open source Gadgetron framework [Citation21]. Magnitudes and phase images were processed in real-time in a previously described thermometry pipeline [Citation22] developed for cardiac thermometry:
The first 20 magnitude images in the time series were used to find the image corresponding to the central position within the displacement range. This image was used as a reference frame for the registration.
The following magnitude images were registered using optical flow algorithm [Citation23]. For in vitro experiments, a rigid motion algorithm (least-squares minimisation using translations and rotations) was used whereas a Black-Anandan algorithm [Citation24] (implemented on graphic card) was used for in vivo experiments to account for liver deformations during breathing.
A principal component analysis method was performed on the following 30 frames to build a phase model (synthetic phase image) freed from susceptibility artefact induced by motion [Citation25].
Temperature maps were computed using the PRFS method after 50 frames (25 s in vitro and 35 s in vivo) of learning step. The current temperature increase
where is the current synthetic phase and
is a reference phase taken as the first synthetic phase of the interventional step.
is the gyromagnetic ratio, α = −0.0094 ppm.°C−1 [Citation26] is the PRF temperature coefficient,
and TE is the echo time.
The potential improvement of the 3 D US based beam steering was analysed on the temperature images. For both in vitro and in vivo experiments, two consecutive sonications were performed for each location, first without motion compensation and then with motion compensation. A delay of at least 5 min was observed between each sonication to ensure complete tissue cooling. The pixel displaying the maximal temperature increase in the sonicated area was selected and temperature profile in y direction was plotted. The full width at half maximum (FWHM) was computed and compared with and without motion compensation.
Evaluation platform
A phantom composed of 3% agar and 2% silica was positioned in a plastic box inside a water tank (see ). Silica (particle size <14 nm, Sigma Aldrich, St. Louis, MO) is aimed to have Rayleigh scattering effects (14 nm ≪ λ = 1.6 mm) in order to mimic the speckle observed in tissues. Mylar membranes (50-µm thick, smaller than 1/30 of the ultrasonic wavelength) were glued to the base of the plastic box and water tank to ensure US wave propagation from the transducer toward the phantom. A rotary motor was used to generate a translation of the sample on y-axis using rod and slides. The motor control allowed tuning of the frequency of the sinusoidal displacement and thus the maximal velocity. Typical settings of the motion were amplitudes of 10 mm and maximum velocities ranged between 10 and 15 mm.s −1.
MR data were acquired using two 32-element imaging coil arrays positioned laterally to the water box and a 19-cm loop coil was positioned above the phantom to improve coil coverage and maximise signal to noise of the MR-images. A first batch of experiments was conducted to setup the displacement monitoring method and integrate it into the thermometry pipeline. After adjustments, this study reports five ablations in vitro, with and without focus correction.
In vivo study
In vivo validation was performed in the livers of two pigs (Large White × Landrace, ∼40 kg). In total, N = 8 ablations in vivo have been performed. The protocol was approved by the local Ethics Committee according to the European rules for animal experimentation. Premedication of pigs were performed by an intramuscular injection of a mix ketamine (20 mg.kg−1), acepromazine (1 mg.kg−1) and buprenorphine (10 µg.kg−1). Animal anaesthesia was induced with intravenous injection of propofol (1.5–2 mg.kg−1) and maintained using 2% of Isoflurane mixed with the appropriate air/oxygen supply (50/50) after intratracheal intubation. The animal ventilation was performed 12 times per minute with 400 ml of air/oxygen mix. The heart rate and arterial pressure were recorded and monitored continuously. The animal was installed in prone position on top of the HIFU platform and positioned at the magnet isocenter. The animal was continuously cared for by veterinary staff.
MR-data were acquired using two 32-element imaging coil arrays positioned laterally to the thorax and a 19-cm loop coil was positioned underneath the animal on top of the HIFU transducer. After completion of the treatment, the animal was euthanized with an intravenous injection of Dolethal (Vetoquinol, Lure, France), until complete cardiac arrest was attested from the ECG trace.
Results
The thermometry pipeline allowed retrieving temperature maps with a total computation time around 100 ms/slice, for the spatial resolution of the thermometry images used in this study. This processing pipeline is thus compatible with real-time conditions, with minimal latency. No interference of the 3 D US motion estimation pipeline could be identified on the MR-images. Very limited radiofrequency interferences (the maximal number of discarded signals during 120 s monitoring was 3 over 1200 measurements, with most of the experiments showing 0 or 1 occurrence) were observed on the recorded backscattered signals from US pulse-echo system when the MR-thermometry sequence was running.
shows the timings for the 3 D motion correction pipeline. US data computation time and update of phases of the US transducers lasted 18 ms and 19 ms, respectively. This leads to the main source of HIFU sonication time loss, resulting in a 63% of duty cycle for a motion correction update rate of 10 Hz. Such a refresh rate was considered sufficient to monitor liver displacement while maintaining a reasonable sonication duty cycle.
In vitro
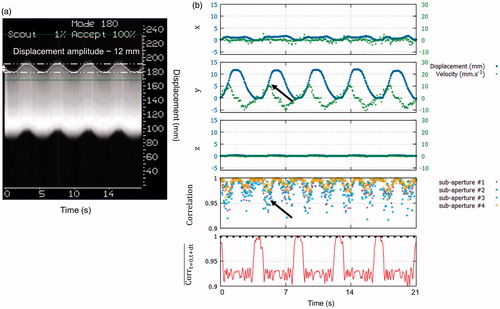
shows the 3 D displacement in the transducer framework computed form the proposed US-based method. The maximum displacement and velocity were 12 mm and 11 mm.s−1, respectively. The MR-navigator signal amplitude () was in good agreement with the proposed method (y-axis on ). Normalized cross-correlation coefficients between current and previous US-acquisition, along time, for all sub-apertures, remained above 0.94 (see ). Minimum normalised cross-correlation was found when the absolute velocity was maximum (see black arrows on ). The mean correlation on each sub-aperture between the reference and current US-acquisition (, is displayed in red on the bottom graph of . Above the threshold (dashed line), a reset of the position based on an absolute displacement estimation was performed (see ). Using this approach, the reset of the position was found robust on every in vitro experiments (N = 5).
Figure 4. Displacement estimation validation in vitro. (a) MR-navigator signal positioned along the y-axis acquired during 21 s. (b) Representative displacement estimations in ( obtained in vitro using our experimental settings. The blue and green curves represent the displacement estimations and the corresponding instantaneous speed computed from estimated positions, respectively. The bottom graph displays the normalised cross-correlations between two successive US acquisitions along time, for each sub-apertures. Black arrows depict lower normalised cross-correlation coefficients during peak velocities. On the bottom graph, the red curve represents the mean correlation between current measurement and the first acquisition taken as reference. The black dashed line represents the threshold above which absolute displacement estimations is performed to reset the position. (Colored version is available on the journal’s webpage).
shows a screen capture of temperature map for the three slices, after 60 s of sonication at 150 W acoustic power. Without motion correction of the focus, the temperature footprint was lengthened mainly in the y-direction where the displacement was the most important. With 3 D US-based motion correction, the temperature rise remained very localised. The temporal evolution of the maximum temperature increase is displayed on . It reached 18 °C and 26 °C without and with motion compensation, respectively. The temperature standard deviation on this pixel measured prior to sonication was 1.2 °C. These improvements of heating efficiency were observed for each in vitro experiments (N = 5). Overall, maximum temperature increases were improved by 37 ± 5%. The FWHM of the temperature profiles along the y direction were 18 mm and 6 mm without and with HIFU beam steering, respectively (see ). summarises results for every sonication performed in the gel.
Figure 5. Representative in vitro MR-thermometry. (a) Shows temperature images overlaid to magnitude images, taken at the end of HIFU sonication, without (top) and with (bottom) 3D focus position update. (b) Shows the temperature temporal evolution of the pixel experiencing the maximum temperature increase, for both conditions. The 50 first dynamic acquisitions (grey box) corresponded to the learning step in the thermometry pipeline and were used for correction of motion and associated susceptibility artefacts of temperature images. (c) shows the temperature profiles along the y-axis crossing the pixel with maximal temperature increase, at the end of sonication, for both conditions. (Colored version is available on the journal’s webpage).
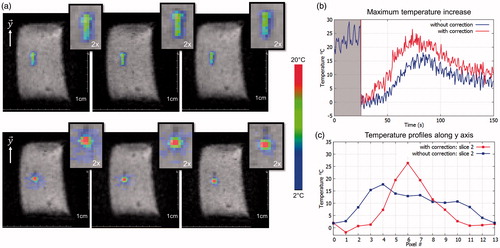
Table 1. Summary of the five ablations performed on gel phantom.
In vivo
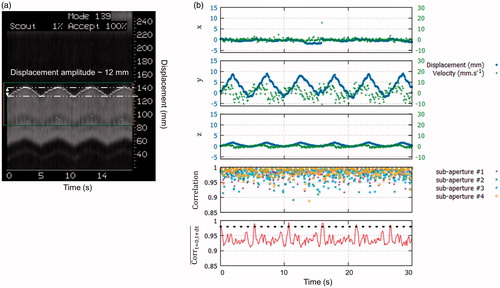
Displacement could also be successfully monitored in vivo in the liver of pigs during N = 8 ablations. shows displacement in (. The maximum displacement and peak velocity were 10 mm and 11 mm.s−1, respectively. MR-navigator signal amplitude () was in agreement with the motion displacement estimated on y-axis. Compared to the in vitro experiments, normalised cross-correlation coefficients along time, were lower but remained above 0.85 (see ). In vivo
was a robust metric to reset the position to its initial position, for each respiratory cycle.
Figure 6. Displacement estimation in vivo in pig liver. (a) MR-navigator signal positioned along the y-axis acquired during 30 s. (b) Representative displacement estimations in ( obtained during in vivo experiment on liver. The blue and green curves represent the displacement estimations and the corresponding instantaneous speed computed from estimated positions, respectively. The bottom graph displays the normalised cross-correlations between two successive US acquisitions along time, for each sub-apertures. The red curve displays the mean correlation between current and the first acquisition taken as reference. The black dashed line represents the threshold above which absolute displacement estimations is performed to reset the position. (Colored version is available on the journal’s webpage).
shows a screen capture of temperature map after 40 s of sonication at 560 W acoustic power. The temperature footprint at the focal spot, with and without focus correction were close to each other. However, we can note a slight lengthening in the y-axis along the principal motion axis without focus correction. Conversely, with motion correction the focal spot conserved its point-like shape. The temporal evolution of the maximal temperature is displayed on . The maximum temperature increase was 18 °C and 27 °C without and with focus position correction, respectively. The temperature standard deviation on this pixel measured prior to sonication was 0.9 °C. Maximal temperature increases (N = 8) were improved by 35 ± 9% when using motion compensation.
Figure 7. Representative in vivo MR-thermometry. (a) Screen capture of representative temperature images overlaid to magnitude image, taken at the end of HIFU sonication, without (top) and with (bottom) focus update. (b) Shows the temperature evolution of the pixel experiencing the maximum temperature increase, along time, for both conditions. The 50 first dynamic acquisitions (grey box) corresponded to the learning step in the thermometry pipeline (see Methods for details). (c) shows the temperature profile along the axis crossing the pixel with maximal temperature increase at the end of sonication, for both conditions. (Colored version is available on the journal’s webpage).
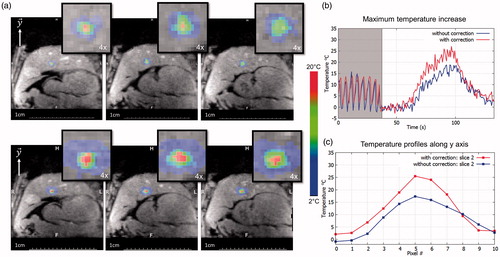
displays temperature profiles on y-axis for both conditions. The FWHM of the temperature profiles along the y direction were 13 mm and 9 mm without and with HIFU beam steering, respectively. The FWHM in the x direction (data not shown) were 12 and 8 mm, respectively. summarises results for every sonication performed in vivo.
Table 2. Summary of the eight ablations performed in the liver of pigs.
Discussion
This study shows that the proposed 3 D US-based motion correction approach allows maintaining the HIFU focal spot in the presence of motion without adding any burden or complexity to MR thermal imaging. Thus, treatment efficiency on mobile organs can be improved while reducing risks of overheating of tissues located in the near field of the HIFU beam. Simultaneous 3 D rapid MR-thermometry provided precise monitoring of temperature distribution at the focus and in surrounding areas, allowing online safety assessment of the therapeutic procedure, which is mandatory in perspective of clinical application.
The 3 D speckle-tracking method required only four elements over 256 of the HIFU transducer to operate in reception, resulting in a negligible loss in maximal available acoustic power. Only few US signals from back scattered US were affected by electro-magnetic radiofrequency signals from the MR-sequence. However, the US signal envelope was preserved and no error was induced on displacement estimations. Thus, no constraint was imposed on MR-sequence timings with respect to displacement estimations or vice-versa, allowing HIFU and MRI to operate asynchronously. This provides the operator full flexibility for adjusting MR-sequence parameters according to the desired priority, including spatial resolution, volume coverage, update rate or effective signal to noise ratio. In the present work, we chose to acquire five slices every 0.7 s in vivo with an in-plane spatial resolution of 2 mm, using a single-shot EPI acquisition. Higher spatial resolution (1 mm in-plane) was reported in the liver of pig using a segmented EPI acquisition, at the cost of a much slower imaging update rate (2.1 s/slice) [Citation27].
3 D US-based HIFU beam steering was successfully evaluated on a phantom and in vivo in the liver of pig. Estimation of 3 D position from a simultaneous measurement of the four sub-apertures was found robust and did not require sequential measurements for each sub-aperture, as proposed initially in Pernot et al. [Citation14]. Compared to other autonomous methods (e.g. 2 D US imaging), this method does not require any additional device to be operated inside the magnet bore. The 3 D motion correction system was able to compensate typical respiratory motion reported in the literature [Citation4], showing direct practical applicability of this method for clinical application.
3 D speckle motion tracking relies on the spatio-temporal correlations of US speckle measured consecutively. Compared to in vitro, in vivo temporal correlation coefficients were found lower. These results can be attributed to attenuation of the back-scattered US-signal, inherent to heterogeneities of the liver (lobes, blood vessels) and presence of other anatomical structures (skin, fat layer) in the HIFU beam path. Besides, the in vivo density and homogeneity of the US speckle may differ from in vitro experiments. Other parameters such as the transducers sensitivity in reception and their operating frequency can play a pre-dominant role in the overall quality of the displacement estimation. However, 3 D tracking results were found satisfactory with the available hardware and technical implementation.
US signals were acquired upstream from the focus to limit displacement estimation errors due to speed of sound variations during temperature increase. For in vivo ablations, the footprint of temperature rise in the direction of motion appeared less visible on temperature images () than for in vitro experiments (). The presence of perfusion in the liver is expected to evacuate heat more efficiently than in the gel, making observation of moderate temperature increase outside of the focal spot position more difficult. Moreover, thermal diffusivity also differs in the liver, which may explain that temperature spot dimensions were larger than in the gel. However, the FWHM was systematically reduced in vivo with motion compensation and showed comparable values in x and y directions (8 mm vs. 9 mm), whose difference remained lower than the pixel size of the temperature image (2 mm). As a result of spatially reduced temperature spread, the maximal temperature was increased by ∼35% in vitro and in vivo, confirming that the correction substantially improved focalisation of acoustic energy for better heating efficiency. In this study, two consecutive sonications were systematically performed at the same location, without and with focus position correction, respectively. Changes of tissue US properties during sonication or between consecutive sonications might have occurred and could have impacted the precision of displacement estimate. However, since motion estimation was performed 20 mm below the targeted region, such a change was expected to have a limited influence on motion compensation. Data reported in and show similar motion amplitudes measured before, during and after each individual sonication and between consecutive sonications performed at the same location.
In this study, we deliberately chose to apply long duration sonications to evaluate the robustness of the motion compensation method over a large number of respiratory cycles. However, increasing the sonication time while using moderate HIFU acoustic intensity is usually not preferred for thermal ablation in the liver, since perfusion and thermal diffusivity dissipate heat at the focus more efficiently than in the pre-focal region, increasing risks of inducing unwanted lesions near the skin. However, we did not observed such effects under the tested experimental conditions in the present work. Moreover, a number of innovative therapeutic procedures aim at creating a moderate thermal build-up of few degrees for long duration sonications (several minutes), such as for local delivery of chemotherapies encapsulated into thermosensitive nanovehicles [Citation27]. In such a context, robust motion compensation is a clear added value to precisely control the therapy.
In vitro and in vivo, an MR-navigator echo was aligned with the main axis of displacement, allowing correlating its values with those estimated by US measurements. In vitro, only rigid motion was present and MR-navigator positions were very close to the 3 D estimations on the y-axis. However for the in vivo case, some differences were observed between MR-navigator readings and displacement estimated from US. Although maximal amplitudes of displacement were similar, the shape of displacement was slightly different. However, the MR-navigator was positioned at the dome of the liver (liver/lung interface), whereas HIFU sonication were performed at the inferior part of the liver. Thus, readings from the 1 D MR-navigator echoes can hardly reflect the effective liver deformation at this position during the different breathing states. Thereby, the proposed approach appears more robust as compared to MR-navigator-based motion estimation since it evaluates local displacements near the targeted region to be treated. Another advantage of the method is that motion of the target is directly computed in the transducer’s frame of reference and does not require computations between different frames of coordinates.
In this study, MR-acquisition slices were positioned from anatomical images to cover the region being sonicated. Thus, potential out-of-slice motion may appear when the stack of slices is not aligned with the direction of motion, which could introduce small oscillations in MR-temperature readings. Although these effects were not experimentally observed in our experiments (maximal displacement measured by US in x and z axes remained below 3 mm–see and ), refinement of the method may include automatic slice repositioning from the 3 D US position. Another option would be to run US pulse-echo over several respiratory cycles and to compute optimal slice orientation to minimise out-of-slice motion in order to optimise temperature mapping precision around the targeted region.
Despite the positive results reported in this study, the current implementation suffers from several limitations. First, the loss in sonication duty cycle is due to the 18 ms delay to process the US data and estimate the displacement (normalised cross-correlations, pseudo-inverse) and to the additional 19 ms delay to update the phase law of our 256 elements generator. These delays could easily be reduced using optimised electronic device and using more rapid implementation of the displacement estimation algorithm. Second, the current implementation does not allow arbitrary selection of the transducer elements operating in reception. Thus, in perspective of transcostal liver ablation [Citation15,Citation28], some transducer may be located in front of a rib, making determination of liver position impossible. Again, this limitation could be circumvented by appropriate electronics, with all US channels operating in transmit/receive mode.
Conclusion
In this study, we have validated a 3 D US-based motion tracking along with real-time temperature monitoring. Focus position was successfully corrected in vivo in the liver of pigs for typical respiratory motion amplitudes and maximum velocities of 10 mm and 10 mm·s−1, respectively. After focus position correction the heating effectiveness was improved by ∼35% in vitro and in vivo. Hardware and software optimisation may provide higher frame rate for motion determination and compensation in 3 D.
Acknowledgements
The authors gratefully acknowledge Valentine Prat for her assistance in animal experimentation.
Disclosure statement
No potential conflict of interest was reported by the authors.
Additional information
Funding
References
- Coluccia D, Fandino J, Schwyzer L, et al. (2014). First noninvasive thermal ablation of a brain tumor with MR-guided focused ultrasound. J Ther Ultrasound 2:17.
- Gianfelice D, Gupta C, Kucharczyk W, et al. (2008). Palliative treatment of painful bone metastases with MR imaging-guided focused ultrasound. Radiology 249:355–63.
- Dorenberg EJ, Courivaud F, Ring E, et al. (2013). Volumetric ablation of uterine fibroids using Sonalleve high-intensity focused ultrasound in a 3 Tesla scanner – first clinical assessment. Minim Invasive Ther Allied Technol 22:73–9.
- Davies SC, Hill AL, Holmes RB, et al. (1994). Ultrasound quantitation of respiratory organ motion in the upper abdomen. Br J Radiol. 67:1096–102.
- N’Djin WA, Chapelon J-Y, Melodelima D. (2015). An ultrasound image-based dynamic fusion modeling method for predicting the quantitative impact of in vivo liver motion on intraoperative HIFU therapies: investigations in a porcine model. PLoS One 10:e0137317.
- Greef M, de Schubert G, Wijlemans JW, et al. (2015). Intercostal high intensity focused ultrasound for liver ablation: the influence of beam shaping on sonication efficacy and near-field risks. Med Phys 42:4685–97.
- Holbrook AB, Ghanouni P, Santos JM, et al. (2014). Respiration based steering for high intensity focused ultrasound liver ablation: respiration guided MRgFUS in the liver. Magn Reson Med 71:797–806.
- de Senneville BD, Ries M, Maclair G, et al. (2011). MR-guided thermotherapy of abdominal organs using a robust PCA-based motion descriptor. IEEE Trans Med Imaging 30:1987–95.
- Celicanin Z, Auboiroux V, Bieri O, et al. (2014). Real-time method for motion-compensated MR thermometry and MRgHIFU treatment in abdominal organs: MRgHIFU treatment method in abdominal organs. Magn Reson Med 72:1087–95.
- Ries M, de Senneville BD, Roujol S, et al. (2010). Real-time 3D target tracking in MRI guided focused ultrasound ablations in moving tissues. Magn Reson Med 64:1704–12.
- de Oliveira PL, de Senneville BD, Dragonu I, et al. (2010). Rapid motion correction in MR-guided high-intensity focused ultrasound heating using real-time ultrasound echo information. NMR Biomed 23:1103–8.
- Petrusca L, Cattin P, De Luca V, et al. (2013). Hybrid ultrasound/magnetic resonance simultaneous acquisition and image fusion for motion monitoring in the upper abdomen. Invest Radiol 48:333–40.
- Celicanin Z, Manasseh G, Petrusca L, et al. (2017). Hybrid ultrasound-MR guided HIFU treatment method with 3D motion compensation. Magn Reson Med [Sep 24]. doi: 10.1002/mrm.26897
- Pernot M, Tanter M, Fink M. (2004). 3-D real-time motion correction in high-intensity focused ultrasound therapy. Ultrasound Med Biol 30:1239–49.
- Marquet F, Aubry JF, Pernot M, et al. (2011). Optimal transcostal high-intensity focused ultrasound with combined real-time 3D movement tracking and correction. Phys Med Biol 56:7061–80.
- Wijlemans JW, Bartels LW, Deckers R, et al. (2012). Magnetic resonance-guided high-intensity focused ultrasound (MR-HIFU) ablation of liver tumours. Cancer Imaging 12:397–4.
- Roujol S, Ries M, Quesson B, et al. (2010). Real-time MR-thermometry and dosimetry for interventional guidance on abdominal organs. Magn Reson Med 63:1080–7.
- Quesson B, Laurent C, Maclair G, et al. (2011). Real‐time volumetric MRI thermometry of focused ultrasound ablation in vivo: a feasibility study in pig liver and kidney. NMR Biomed 24:145–53.
- Toupin S, Bour P, Lepetit-Coiffé M, et al. (2017). Feasibility of real-time MR thermal dose mapping for predicting radiofrequency ablation outcome in the myocardium in vivo. J Cardiovasc Magn Reson 19:14.
- Peters RD, Henkelman RM. (2000). Proton-resonance frequency shift MR thermometry is affected by changes in the electrical conductivity of tissue. Magn Reson Med 43:62–71.
- Hansen MS, Sørensen TS. (2013). Gadgetron: an open source framework for medical image reconstruction. Magn Reson Med 69:1768–76.
- Ozenne V, Toupin S, Bour P, et al. (2017). Improved cardiac magnetic resonance thermometry and dosimetry for monitoring lesion formation during catheter ablation. Magn Reson Med 77:673–83.
- Sun D, Roth S, Black MJ, Secrets of optical flow estimation and their principles. Comput Vis Pattern Recognit CVPR 2010. IEEE: IEEE Conference [Internet]; 2010, 2432–39. Available from: http://ieeexplore.ieee.org/abstract/document/5539939/ [last accessed 10 Oct 2017].
- Black MJ, Anandan P. (1996). The robust estimation of multiple motions: parametric and piecewise-smooth flow fields. Comput Vis Image Underst 63:75–104.
- Denis de Senneville B, El Hamidi A, Moonen C. (2015). A direct PCA-based approach for real-time description of physiological organ deformations. IEEE Trans Med Imaging 34:974–82.
- de Zwart JA, van Gelderen P, Kelly DJ, et al. (1996). Fast magnetic-resonance temperature imaging. J Magn Reson B 112:86–90.
- Auboiroux V, Petrusca L, Viallon M, et al. (2014). Respiratory-gated MRgHIFU in upper abdomen using an MR-compatible in-bore digital camera. BioMed Res Int 2014:421726.
- Quesson B, Merle M, Köhler MO, et al. (2010). A method for MRI guidance of intercostal high intensity focused ultrasound ablation in the liver. Med Phys 37:2533.