
 ?Mathematical formulae have been encoded as MathML and are displayed in this HTML version using MathJax in order to improve their display. Uncheck the box to turn MathJax off. This feature requires Javascript. Click on a formula to zoom.
Abstract
In this study, the feasibility of using ultrasonic differential attenuation coefficient intercept (Δα0) imaging to evaluate thermal lesions induced by microwave ablation (MWA) was explored using an in vivo porcine model. The attenuation coefficient intercept (Δα0 is estimated by subtracting an initial value of Δα0 images. Receiver operating characteristic (ROC) curves and the area under ROC curve (AUC) were employed to statistically assess the predictability of ultrasonic imaging. Ultrasonic Δα0 values were approximately 0.13 dB/cm and 0.16 dB/cm in a normal liver and kidney, respectively, increasing to 2.9 dB/cm and 2.55 dB/cm in ablated regions after MWA. The CNR values of the ultrasonic Δα0 images (0.9 dB and 0.6 dB in the liver and kidney, respectively) were significantly higher (p < 0.05) than the values of B-mode images (0.6 dB and 0.3 dB). The AUC value of the ultrasonic Δα0 image was higher than the B-mode image value, 0.95 compared with 0.88. This in vivo study suggests that ultrasonic Δα0 imaging has the potential to evaluate thermal lesions with high accuracy and better image contrast for monitoring MWA.
Introduction
Image-guided thermal or energy-based ablation technologies, such as radiofrequency (RF), microwave, laser, cryosurgery and high-intensity focussed ultrasound (HIFU), are emerging as alternatives treatments for cancer and have been used in the treating numerous types of tumours located in various tissues, including the liver, kidney, lung, uterine fibroids, bone, prostate, breast and adrenal glands [Citation1–4]. Currently, percutaneous radiofrequency ablation (RFA) and microwave ablation (MWA) are the two most common modalities used to treat tumours [Citation5]. RFA has been widely used for treating primary and metastatic tumours in the liver, kidney, lung, breast and head due to its effectiveness and safety in both percutaneous and surgical settings [Citation6]. However, RFA requires electrical energy to be conducted through the body during treatment, which can present a number of major limitations. When temperatures reach 100 °C, the increased impedance limits further deposition of electricity into the tissue [Citation7]. Moreover, the active heating zone is relatively small [Citation8], and has been shown to create a heat-sink effect in the liver [Citation9]. Image-guided MWA is a minimally invasive local therapeutic modality that destroys tumours within the body by thermal coagulation or protein denaturation [Citation1,Citation3,Citation10–13]. Since MWA does not rely on conducting electricity into the tissue, its application is not limited by increased impedance or charring, allowing for a larger ablation zone and shorter treatment times [Citation6]. In addition, the heat-sink effect is thought to result in a high rate of local tumour recurrence after RFA and MWA is less affected by this phenomenon [Citation5].
At present, MWA is extensively used for treating cancers of the liver, kidney, lung, breast, adrenal gland, bone, adenomyosis and uterine fibroids [Citation10,Citation12,Citation14]. The method is continually advancing due to recent developments in modern imaging techniques, such as ultrasound imaging [Citation12,Citation15], computed tomography (CT) [Citation13] and magnetic resonance imaging (MRI) [Citation11,Citation16]. Thermal ablation can be predicted using CT with an accuracy of 2–3 mm [Citation13]. The temperature sensitivity of proton resonance frequency (PRF) and relaxation time T1 can be utilised to monitor temperature distribution within the body using MRI [Citation16]. Moreover, magnetic resonance-guided MWA has been put into clinical use in a broad range of applications, taking advantage of its high accuracy and spatial resolution of quantitative spatial–temporal temperature information [Citation11]. Ultrasound imaging has numerous advantages, such as portability, wide clinical availability, real-time imaging capabilities, low-cost and non-invasiveness. Moreover, ultrasound has made an important impact on the field of radiology as a theranostic technology for cancer treatment [Citation17]. In recent years, a number of ultrasonic techniques in the field of non-invasive thermal therapy monitoring have been investigated. Several ultrasound elastography and strain imaging techniques have shown potential in the field of percutaneous RF [Citation18,Citation19] and MWA monitoring [Citation20–23]. A variety of techniques using time and frequency domain features of raw ultrasound backscattered signals from the ablated region have been used in ultrasound temperature imaging, including time-shift, frequency-shift, attenuation coefficient, changes in backscattered energy, probability distribution, B-mode ultrasound image texture and speckle tracking, which have been performed over the entire range of ablative temperatures during thermal ablation therapy [Citation15,Citation24–27]. After thermal ablation treatment, changes in acoustic properties, such as backscattering [Citation28], attenuation [Citation29–31], Nakagami parameter [Citation32,Citation33] and mean scatterer spacing [Citation34], have been proposed as methods of evaluating thermal lesions. As a quantifiable tissue property, acoustic attenuation was previously reported to be a useful parameter for accurate visualisation of thermal lesions, due to its potential for predicting the position, shape and size of lesions [Citation31,Citation35–37]. Conventional ultrasonic B-mode images have been clinically used for guiding and monitoring MWA with the aid of the hyper-echoic regions in the ultrasound image [Citation17,Citation38]. Hyper-echoic regions are often induced by thermal lesions, and are associated with protein coagulation necrosis and/or the appearance of bubble activity [Citation17,Citation38,Citation39]. During thermal ablation treatment, bubble activity may be the consequence of cavitation and/or boiling [Citation40–42]. However, considering the low intrinsic contrast between ablated and normal tissue, the thermal lesions in tissues are sometimes not easily visualised with ultrasound imaging [Citation17].
Investigations of medical imaging techniques for monitoring and targeting cancers have aided in progressing the clinical application of thermal ablation treatments, such as RFA, MWA and HIFU. The acoustic attenuation of biological tissues may provide valuable insights into the physical and pathological properties of the tissue, thus, attenuation imaging may become useful as an alternative modality to augment standard ultrasonic B-mode imaging [Citation43]. Over the past few years, various methods have been utilised to estimate ultrasonic attenuation in tissue, and can be classified into two categories: time-domain methods and frequency-domain methods [Citation44]. Numerous time-domain algorithms have been used to estimate attenuation. The envelope peak method measures attenuation by adjusting the ratio between the mean envelope peaks over depth and the standard deviation of the envelope peaks over depth [Citation45]. Moreover, Jang et al. [Citation46] estimated attenuation using an attenuation- and depth-dependent gain for a signal envelope. Frequency-domain techniques, by comparison, are more widely used to estimate attenuation. Two basic frequency-domain approaches can be defined [Citation44,Citation47]: spectral shift methods and spectral difference methods. Spectral shift methods calculate the downshift of the centre frequency of a power spectrum at different depths [Citation48], while spectral difference methods calculate the amplitude decay of power spectra from backscattered RF signals [Citation49]. Moreover, Kim and Varghese [Citation50] implemented a hybrid method combining a reference phantom with the spectral shift estimation. In the literature, a large body of work has addressed the acoustic attenuation contrast between thermally coagulated tissue and untreated tissue due to heating or thermal ablation [Citation24,Citation51–53]. When tissue was heated in a hot water or saline bath, an increase in the attenuation coefficient was demonstrated in ex vivo bovine liver [Citation53], porcine liver [Citation54] and kidney [Citation55], canine liver, kidney and muscle [Citation56], rat liver [Citation57] and intercostal tissue in the fresh chest walls of rats and pigs [Citation52]. Previous studies have also observed a similar increase in the ultrasound attenuation coefficient during MWA and HIFU ablation. Bush et al. [Citation51] reported a significant increase in the attenuation coefficient of thermal lesion regions, from 3.72 to 7.22 dB/cm, generated in excised porcine livers using an ultrasound therapy system. A dramatic increase in the attenuation coefficient was observed after thermal coagulation in ex vivo bovine liver [Citation29,Citation30], porcine liver [Citation35,Citation51,Citation58] and egg white phantom [Citation59]. In our previous work, we found that the attenuation coefficient in transparent tissue-mimicking phantoms increased from 3 to 4.8 dB/cm during HIFU ablation [Citation39]. Moreover, the attenuation coefficient in ex vivo bovine liver increased from 1.9 to 6.9 dB/cm [Citation39]. Similar results have been demonstrated for monitoring MWA treatments. In a study conducted by Samimi et al. [Citation31], the mean attenuation coefficient in an ex vivo bovine liver, with regions of interest drawn inside, increased from 0.7 to 0.9 dB/cm/MHz after MWA treatment, much higher than normal zones. Yang et al. [Citation60] found that as the temperature increased during MWA treatment, the ultrasonic attenuation coefficient in an in vivo porcine liver increased from 0.2 to 0.9 dB/cm. In addition to the attenuation coefficient, the feasibility of using another attenuation parameter to monitor HIFU treatments, the attenuation coefficient intercept Δα0) is estimated by subtracting the initial value of Δα0 imaging algorithm was implemented to estimate Δα0 as a function of its location in space with respect to an initial value of α0 immediately before beginning HIFU treatment [Citation36].
In this work, we hypothesised that Δα0 imaging may have the potential to evaluate the formation of MWA-induced thermal lesions. Most studies published in the literature have been performed in ex vivo models and there are limited results demonstrating acceptable attenuation images of thermal lesions, especially using the ultrasonic backscatter imaging rather than the through-transmission imaging which is impractical in clinical monitoring. In this work, the feasibility of using Δα0 imaging to monitor and evaluate MWA-induced thermal lesions was explored in an in vivo porcine model. As a preclinical evaluation, thermal lesions were induced in porcine livers and kidneys using a clinical MWA system. To estimate the ultrasonic Δα0 values, two-dimensional (2-D) radiofrequency data backscattered from the ablated region was captured during MWA treatments using the linear array imaging probe of an ultrasound scanner. Ultrasonic B-mode and Δα0 images were reconstructed simultaneously during MWA, and the dynamic changes of ultrasonic Δα0 in the thermal lesion region were calculated throughout the MWA procedure. The contrast-to-noise ratio (CNR) was introduced as a parameter to measure the difference between MWA-induced thermal lesions and the normal tissue surrounding it. The ablation prediction ability of ultrasonic B-mode and Δα0 images were compared using the receiver operating characteristic (ROC) analysis. Finally, potential causes of the differences between the results based on ultrasonic B-mode and Δα0 images, as well as the possible role for ultrasonic Δα0 imaging in ultrasonic imaging applications used during MWA treatments, are discussed.
Materials and methods
In vivo microwave ablation
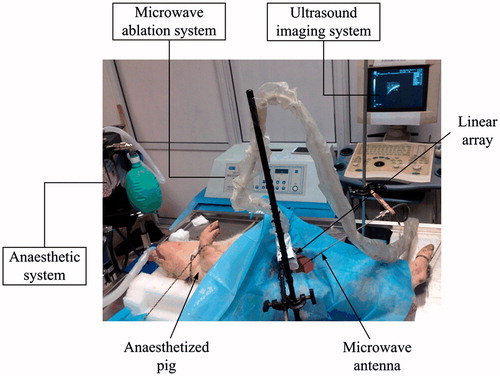
In this work, in vivo MWA experiments were performed in normal porcine livers (N = 9) and kidneys (N = 7) of five domestic pigs. All procedures were approved by the Institutional Animal Care and Use Committee of the School of Life Science and Technology at Xi’an Jiaotong University. A clinical MWA system (MH-1Y, M&Y Electronic Co., Ltd., Beijing, China) was used which operates at 2450 ± 50 MHz and delivers different levels of electrical power for 5 min. A schematic of the experimental apparatus is shown in . The pigs were anaesthetised and laparotomised, and a MWA antenna was placed in the centre of both the liver and kidney using the guidance of ultrasonic B-mode imaging (DP9900, Mindray, Shenzhen, China). After all treatments were completed, the animals were sacrificed and the livers and kidneys were excised and sliced along the ultrasonic data acquisition plane through the centre of the lesion in preparation for photo capture.
Figure 1. Schematic of the experimental apparatus.
2-D RF data acquisition by ultrasound system
During MWA treatment, 2-D RF data were backscattered from the regions of the thermal lesion and normal control tissue, and captured using a linear array imaging probe (5 MHz working frequency; 60% bandwidth) of a modified diagnostic ultrasound machine (DP9900, Mindray, Shenzhen, China). The RF data were digitised at 25 MS/s with a resolution of 14 bits and transferred to a PC for offline processing. During MWA treatment, RF data were acquired at intervals of 10 s while the MWA energy was switched on.
Estimation of the ultrasonic differential attenuation coefficient intercept and imaging
When ultrasonic waves propagate through biological tissue, attenuation of the ultrasonic energy is mainly due to energy absorption and wave propagation. The attenuation coefficient, α(f), is a frequency-dependent term expressed in dB/cm. For attenuation in biological tissues, previous studies have made the simplifying assumption that α(f) is linearly related to frequency [Citation39,Citation44],
(1)
(1)
where α0) is defined as the attenuation coefficient at the centre frequency, α0 are dB/cm [Citation58,Citation59]. The ultrasonic differential attenuation coefficient intercept α0 from values calculated during MWA, and represents the variation in the attenuation coefficient intercept of a predetermined area of tissue [Citation36]. Estimation of the ultrasonic differential attenuation coefficient intercept, Δα0, has been described in detail in previous studies [Citation58,Citation59], and is presented only briefly here. When a given pulse in the frequency domain, P0(f), propagates in a biological tissue over path z, the echo signal power spectra can be defined as
(2)
(2)
Similarly, the reference frame obtained at T0 (T = 0 s) is
(3)
(3)
Subtracting Sreference (f) from Ssignal (f) yields
(4)
(4)
Based on EquationEquation (1)(1)
(1) ,
(5)
(5)
This equation can be used to estimate both Δα0 and Δα0 can be obtained as
(6)
(6)
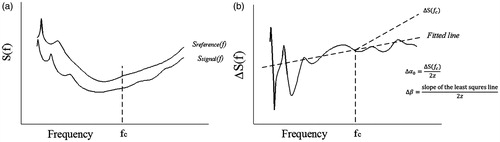
A schematic illustration of the estimation of Δα0 is provided in . The ultrasonic Δα0 image was constructed using a moving Blackman window function of length 5Δα0 image, in which the vertical coordinate is the depth from the imaging transducer and the abscissa is the lateral location.
Figure 2. Schematic illustration of the estimated value of Δα0. (a) Superimposed graphs of Δα0.
Contrast-to-noise ratio
In this work, the CNR between the MWA-induced thermal lesion and the surrounding normal tissue is used to estimate the contrast resolution of the ultrasonic B-mode and Δα0 images, and has been used to evaluate the ablation lesion induced by RFA [Citation17] calculated as
(7)
(7)
where M and S are the mean and standard deviation of the signal intensities in the region of interest (ROI) of the MWA-induced thermal lesion (T) and surrounding normal tissue (N), respectively. CNR values were calculated from the ultrasonic echo amplitudes of the corresponding ultrasonic B-mode images and values of Δα0 of the corresponding ultrasonic Δα0 images. The ROI used to calculate the CNR was placed at the same depth each time to eliminate any depth-dependent attenuation effects. The purpose of selecting the ROI location is to search for the centre point of the ablated region and normal region on the image, which is the centre of ROI.
Receiver operating characteristic analysis
Receiver operating characteristic curves have previously been employed to compare the ablation prediction ability of several imaging techniques [Citation28,Citation61]. The curves are constructed through pixel-by-pixel comparisons. Approaches for constructing the ROC curves have been proposed by Subramanian et al. [Citation28,Citation61]. In this study, the ROC curves were constructed by comparing the threshold-corrected ultrasonic Δα0 and B-mode images with the gross pathology. The sample size of the predictions used to make the ROC curves was equal to the size of the ultrasound image (for an image with 239 columns and 300 rows, there were 71 700 predictions in total). All spatial points exceeding a certain threshold were assumed to be ablated, and any other point was considered normal. To construct the ROC curves, optical images of the tissue sections were segmented and placed on the same grid as the corresponding ultrasound images containing the thermal lesion information. For the ROC analysis, every pixel was counted as a separate prediction. To make the ROC curves based on multiple experiments, predictions from all the experiments were combined. The ROC curve was then created by plotting the false positive rate (1 – Specificity) vs. true positive rate (Sensitivity) over the entire range of predictor threshold values by comparing the thermal lesion, assessed by the ultrasonic B-mode and Δα0 images with the gross pathology. In this study, the area under ROC curve (AUC) was calculated to quantify the ablation prediction ability. A general model to calculate the AUC standard error (SE, one-tailed, significance criterion: p < 0.05) and its 95% confidence interval (CI) was created in MATLAB (MathWorks, Natick, MA) in order to measure the statistical significance of AUC values vs. the null hypothesis [Citation62]. The effective sample size for examining the difference between two areas was determined by estimating the number of independent ablation predictions. Statistical significance between the AUC values of the ultrasonic B-mode and Δα0 images was assessed based on the Z-statistic, calculated using the method of Hanley and McNeil [Citation63].
Assessment of thermal lesions
After completing all treatments, the livers and kidneys were excised and sliced along the ultrasonic data acquisition plane through the centre of the lesion for photo capture. ImageJ software was used to assess the length, width and area of the thermal lesions from the ultrasonic B-mode, Δα0 and gross pathology (optical) images [Citation64] using blinded multiple-observer analysis (n = 3).
Statistical analyses
MATLAB was used to perform statistical analyses. All data are expressed as mean ±1 standard deviation. Means between groups were compared using independent t-tests and p < 0.05 was considered statistically significance.
Results
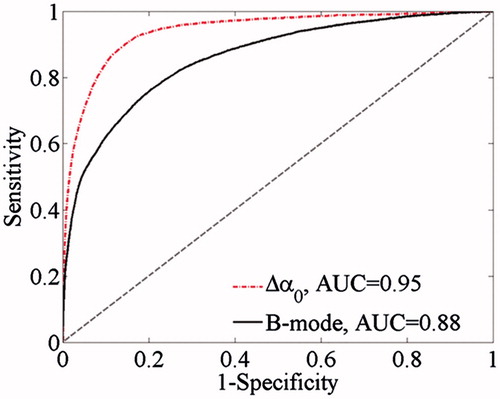
To illustrate MWA-induced thermal lesions in an in vivo porcine model, ultrasonic B-mode and Δα0 images were constructed from the same RF data before and after MWA. The ultrasonic B-mode, Δα0 and tissue section images of thermal lesions in a porcine liver before and immediately after MWA are shown in . Thermal lesions, observed as white discolouration in photos, appeared in the porcine livers after MWA. A bright hyper-echoic region appeared in the corresponding ultrasonic B-mode images and Δα0 images, and became more enlarged as the lesions developed over longer MWA exposure. Qualitatively, the thermal ablation area where the ultrasonic differential attenuation coefficient values were increased after MWA treatment can be distinguished as a change of colour from blue to red (. The ROC curves based on the ultrasonic B-mode and Δα0 images are shown in . The ROC curves of the Δα0 images completely wrap around the B-mode curves in the lower right corner of the former. The AUC values were 0.88 (SE = 0.00187, p < 0.0001, 95% CI = [0.8796, 0.8831]) for the ultrasonic B-mode image and 0.95 (SE = 0.00117, p < 0.0001, 95% CI = [0.9432, 0.9465]) for the ultrasonic Δα0 image. The difference between the AUC values is 0.0643 (SE = 0.00197, 95% CI = [0.0604, 0.0682]), which was statistically significant (Z test statistic = 32.610; p < 0.0001). The in vivo MWA ablation experiments were also performed in the porcine kidneys.
Figure 3. Ultrasonic B-mode, Δα0 and tissue section images of the thermal lesion in an in vivo porcine liver immediately after MWA. Regions of interest are 4 × 4 mm.
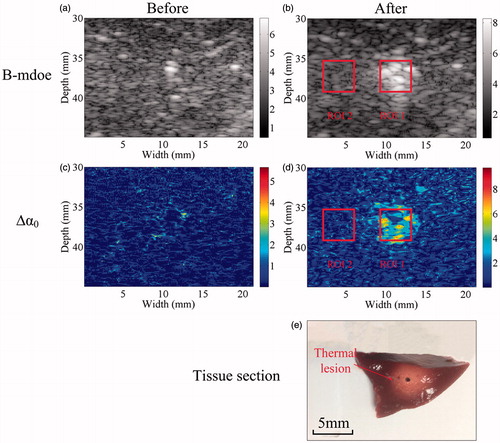
Figure 4. Receiver operating characteristic (ROC) curves showing the accuracy of ablation prediction using ultrasonic B-mode and Δα0 imaging.
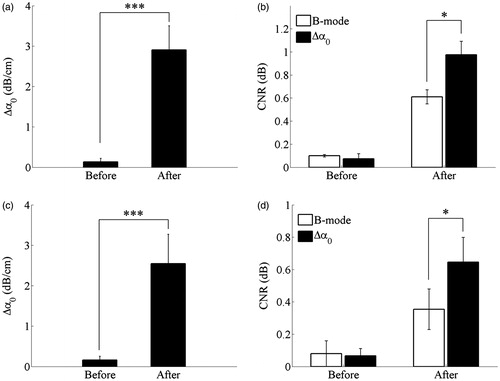
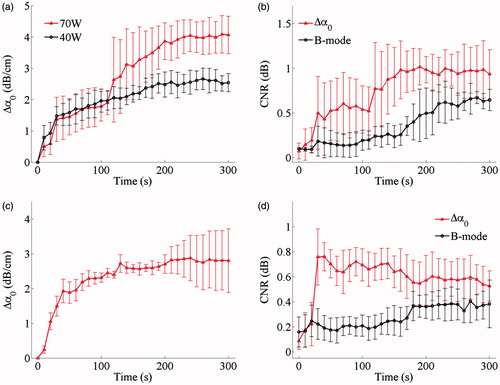
The simultaneous ultrasonic B-mode, Δα0, and tissue section images of thermal lesions in the in vivo porcine kidney before and immediately after MWA are shown in . A quantitative comparison of the ultrasonic Δα0 values calculated in the thermal lesion region of the liver and kidney, before and after MWA treatment, is shown in , as well as changes in the CNR calculated between MWA-induced thermal lesion and surrounding normal tissue. CNR values were calculated from the Δα0 values and ultrasonic echo amplitudes of the ultrasonic Δα0 images and B-mode images, respectively. The mean values of ultrasonic Δα0 were approximately 0.13 dB/cm and 0.16 dB/cm in the normal porcine liver and kidney, respectively, and increased to 2.9 dB/cm and 2.55 dB/cm, respectively, as a result of the thermal lesion formation after MWA treatment. Importantly, this could provide a promising modality for distinguishing thermal lesions induced by MWA from surrounding normal tissue. Before MWA, the mean values of CNR calculated from the ultrasonic B-mode and Δα0 images were 0.09 dB and 0.07 dB, respectively, in the liver, and 0.08 dB and 0.07 dB, respectively, in the kidney. No significant differences (p > 0.05) were observed between the CNR levels calculated from the ultrasonic echo amplitudes and Δα0 parameters. After MWA exposure and once the thermal lesions had been induced, the CNR values in the ultrasonic B-mode and Δα0 images increased. The values increased to 0.61 dB and 0.97 dB in the liver, and 0.35 dB and 0.65 dB in the kidney. The mean CNR values calculated from the Δα0 parameter were significantly higher than those calculated from the ultrasonic echo amplitude (p < 0.05), which suggests the ultrasonic Δα0 images may offer a potential method of improving the contrast resolution of ultrasonic imaging used in monitoring MWA treatments.
Figure 5. Ultrasonic B-mode, Δα0 and tissue section images of the thermal lesion in an in vivo porcine kidney immediately after MWA. Regions of interest are 3 × 3 mm.
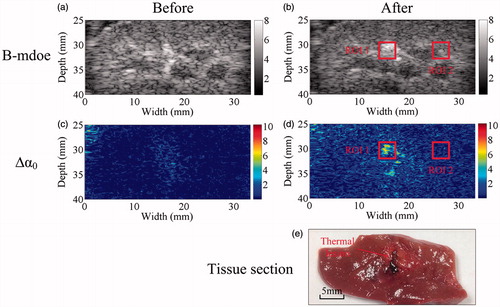
Figure 6. Statistical results for (a, c) ultrasonic Δα0 values calculated within the thermal lesion region of interest (ROI1), before and after MWA exposure, and (b, d) CNR calculated between the MWA-induced thermal lesion (ROI1) and surrounding normal tissue (ROI2) in the porcine (a, b) liver and (c, d) kidney. Values were calculated from the ROIs shown in , respectively, and are presented as group means. Error bars represent ±1 standard deviation. *p < 0.05; ***p < 0.001.
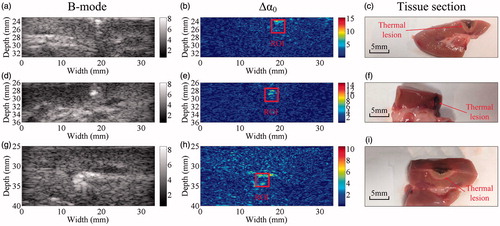
A representative visualisation of MWA-induced thermal lesions in the porcine liver at different MWA power levels is shown as ultrasonic B-mode, Δα0 and tissue section images immediately after MWA are shown in . The MWA-induced thermal lesions can be visibly observed in the photographs as gross white discolouration in the tissue section images and as bright regions in the corresponding ultrasonic B-mode and Δα0 images. Additional results were obtained for in vivo MWA treatments in the porcine kidneys, presented in . Ultrasonic B-mode, Δα0 and tissue section images were taken immediately after MWA. Bright regions appeared in the ultrasonic B-mode and Δα0 images of the porcine kidney, and MWA-induced thermal lesions can be visibly observed as white discolouration in the corresponding tissue section image.
Figure 7. Representative results obtained using the ultrasonic B-mode, Δα0 and tissue section images of thermal lesions in the in vivo porcine liver immediately after MWA at (a–f) 40 W and (g–l) 70 W.
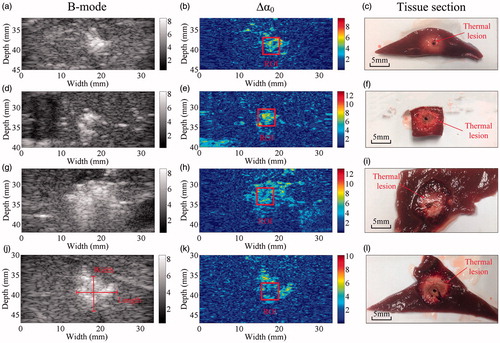
Figure 8. Representative results obtained using the ultrasonic B-mode, Δα0 and tissue section images of thermal lesions in the in vivo porcine kidney immediately after MWA at 40 W, illustrated in rows (1) through (3), respectively.
The dynamic changes in the ultrasonic Δα0 values calculated in the thermal lesion region and CNR values between the MWA-induced thermal lesions and surrounding normal tissue in porcine livers and kidneys during MWA exposure are clearly observed in . The Δα0 values tended to increase in the porcine liver during MWA exposure. By the end of treatment, the mean values had increased to 2.5 dB/cm at 40 W and 4.1 dB/cm at 70 W. Mean CNR values were calculated from the ultrasonic B-mode images and increased from 0.09 to 0.64 dB in the porcine liver. In the ultrasonic Δα0 images, the corresponding CNR values increased from 0.07 to 0.93 dB. When the MWA was switched on, the mean CNR values rose and then tended to increase with some fluctuation. The mean CNR values calculated from the ultrasonic Δα0 images obtained during the MWA exposure were higher than those calculated from the ultrasonic B-mode images at the same instant. Furthermore, the Δα0 values tended to increase in the porcine kidney during MWA exposure and by the end of treatment, the mean ultrasonic Δα0 reached 2.8 dB/cm. Similarly, the mean CNR values calculated from the ultrasonic B-mode images increased from 0.15 to 0.38 dB in the porcine kidney. For the ultrasonic Δα0 images, the corresponding values increased from 0.09 to 0.53 dB. During MWA exposure, the mean CNR values calculated from the ultrasonic B-mode images tended to increase immediately as the MWA was switched on. There was also a sharp rise in the mean CNR values calculated from the ultrasonic Δα0 images at the beginning of MWA exposure, followed by a slower decrease as the lesions developed, however, still remaining higher than those calculated at the same instant from the ultrasonic B-mode images.
Figure 9. Dynamic changes of (a, c) ultrasonic Δα0 values calculated in the thermal lesion region and (b, d) CNR between MWA-induced thermal lesion and surrounding normal tissue in porcine (a, b) liver and (c, d) kidney during MWA exposure. Values are shown as the mean of each group. Error bars represent ±1 standard deviation.
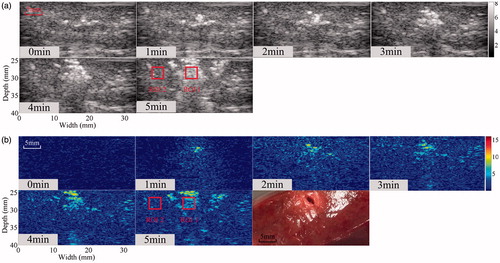
The relationship between the thermal lesion length, width and area was assessed based on the ultrasonic B-mode, Δα0 images and gross pathology, as shown in . Error bars represent ±1 standard deviation of the multiple observer assessments and are relatively small. The results demonstrate that the size measurements from the ultrasonic Δα0 images have a better correlation with the pathologies, in comparison to those obtained from the B-mode images. The Δα0 images, and 0.7045, 0.8165 and 0.7974, respectively, for the B-mode images. To illustrate MWA-induced thermal lesion growth in the in vivo porcine liver and kidney, a temporal evolution of the ultrasonic B-mode and Δα0 images of the thermal lesions was performed over the entire MWA duration, as shown in and . Corresponding images of the tissue sections after MWA are also provided. In the ablation stage, bright hyper-echoic regions appeared in both the ultrasonic B-mode and Δα0 images, which indicated thermal lesions, and as the lesions developed over longer MWA exposure, the bright spots became larger.
Figure 10. Relationship between the thermal lesion (a, d) length, (b, e) width and (c, f) area assessed by ultrasonic B-mode images, Δα0 images and gross pathology. Error bars represent ±1 standard deviation based on multiple observer assessments.
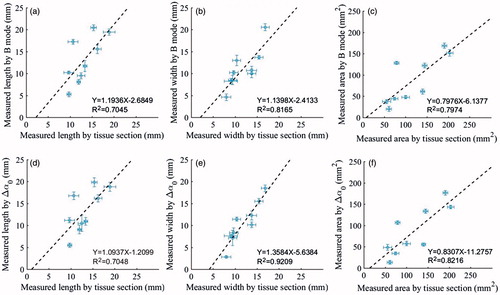
Figure 11. Temporal evolution of ultrasonic (a) B-mode and (b) Δα0 images of MWA-induced thermal lesion in an in vivo porcine liver during MWA treatment. The regions of interest (ROI) are the MWA-induced thermal lesion and surrounding normal tissue. Both regions of interest are 4 × 4 mm.
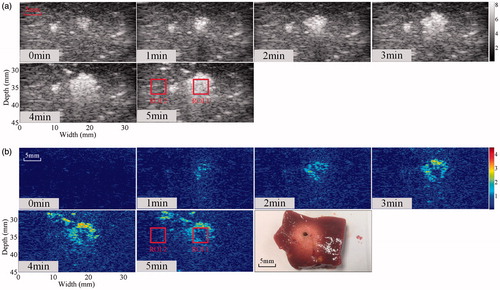
Figure 12. Temporal evolution of ultrasonic (a) B-mode and (b) Δα0 images of MWA-induced thermal lesion in an in vivo porcine kidney during MWA treatment. The regions of interest (ROI) are the MWA-induced thermal lesion and surrounding normal tissue. Both regions of interest are 3 × 3 mm.
Discussion
The purpose of this study was to investigate the feasibility of using ultrasonic Δα0 images to monitor and evaluate MWA-induced thermal lesions in an in vivo porcine liver and kidney. Mean values of ultrasonic Δα0 in the liver and kidney increased after MWA due to the formation of thermal lesions. Higher AUC values based on the ultrasonic Δα0 images suggest the method may be able to make more accurate predictions than those using B-mode images. Changes in the estimated ablation size using ultrasonic Δα0 imaging were in agreement with trends observed in the optically-imaged tissue sections. During MWA exposure, the mean CNR values calculated from the ultrasonic Δα0 images were also higher than those calculated from the ultrasonic B-mode images. This study, based on an in vivo porcine model, suggests that the ultrasonic differential attenuation coefficient intercept has the potential to evaluate the formation of MWA-induced thermal lesions, and ultrasonic Δα0 imaging may provide an alternative modality for monitoring MWA treatments.
The results presented in and show an increase in ultrasonic attenuation characteristics in the porcine liver and kidney after the formation of thermal lesions induced by MWA treatment. This increase was previously reported in other studies, and changes in the ultrasonic attenuation coefficient in biological tissues have been experimentally investigated following the formation of thermal lesions induced by heat or thermal ablation. Recently, Abd Manaf et al. [Citation43] investigated the effect of ultrasound attenuation in breast tissue during a localised hyperthermia treatment and found that attenuation was highly sensitive to changes in the tissue microstructure. The increase in attenuation of biological tissue after thermal ablation treatment is considered to be caused by two main effects: thermally induced changes in macromolecular structures due to protein denaturation and the presence of vapour bubbles due to boiling [Citation40–42,Citation65]. The mechanisms of ultrasound attenuation in biological tissues include viscous frictional forces, inertia and constant energy loss per cycle due to hysteresis and energy loss during the relaxation process [Citation66]. The viscous frictional forces oppose the periodic motion of particles in the medium, inertia is produced by relative motion between structural elements and their surrounding medium, and thermal coagulation necrosis of biological tissue can affect the various largely unknown forms of submicroscopic associations, and cause changes in tissue macromolecular structures [Citation66]. The presence of vapour bubbles due to boiling during MWA treatment may also contribute to the increase in the attenuation coefficient due to scattering of raw ultrasound backscattered signals from the ablation region [Citation39]. Bubble activity may be a result of boiling during MWA treatment [Citation65] and the formation of bubbles may affect estimates of the acoustic attenuation in tissues [Citation39]. The formation of bubbles inside the treated region of tissue modifies the scattering and propagation of ultrasound, which may induce an increase in the attenuation coefficient during thermal ablation [Citation39]. Further studies are needed to quantify the contributions of thermal coagulation necrosis and bubble activity to the changes observed in the acoustic parameters.
The ROC curves of the ultrasonic Δα0 images completely wrap around those of the B-mode images in the lower right corner, as shown in . The AUC value for the ultrasonic Δα0 image (0.95) was significantly higher than for the ultrasonic B-mode image (0.88). The larger value means that the ultrasonic Δα0 image can successfully predict any pair of damaged and non-damaged points at a 6% greater probability than the ultrasonic B-mode images under any threshold [Citation67]. In this work, visualisation of MWA-induced thermal lesions in the porcine liver and kidney was illustrated using the ultrasonic differential attenuation coefficient intercept imaging and the central region of ablation was accurately detected from the images. However, the identification of the edge position and the elimination of the background noise were more clearly reflected in the ultrasonic Δα0 images. This is because the differential imaging method can highlight changes in the acoustic parameter in the ablated region and avoid interference from other hyper-echoic untreated regions. Therefore, the ultrasonic Δα0 images could provide useful information about changes in the ablated region and eliminate background noise to some extent, resulting in a high linear correlation coefficient () for predicting the ablated region. Thus, the relatively high AUC values obtained from the ultrasonic Δα0 images may be the result of differential imaging. The ROC analysis results indicate that ultrasonic Δα0 imaging can more accurately reflect the specificity of the non-ablation region and significantly improve the identification of the ablation edge boundaries. These results are consistent with previous studies of lesion formation using HIFU. Moreover, Zhong et al. [Citation58] presented differential images as colour overlays on top of the pre-treatment B-mode images to identify the location of lesions, and differential imaging was proposed as a practical monitoring method to visualise and evaluate HIFU-induced lesions. In our previous work, we found that CNR values calculated from Nakagami parameter images increased from 0.13 dB to approximately 0.61 dB during MWA exposure [Citation68], whereas in this work, CNR values calculated from ultrasonic Δα0 images were higher, increasing from 0.07 dB to 0.93 dB. The reason for this is that the differential imaging method highlights changes in the acoustic parameter within the ablated region and suppresses the artefacts to some extent, which are clearly observed in the ultrasonic Nakagami parameter images. Therefore, ultrasonic Δα0 imaging offers a higher CNR compared with ultrasonic Nakagami parameter imaging and can preferentially highlight the ablated region.
It is expected that the attenuation of thermal lesions induced by different MWA regimens (power, exposure time, etc.) will differ. illustrates the dynamic changes in the ultrasonic Δα0 values calculated in the thermal lesion region of the liver during MWA exposure at different MWA power levels: 40 W and 70 W. At the end of MWA treatment, the mean values of Δα0 were significantly higher at 70 W than at 40 W, and the mean values of Δα0 showed a large increase from 0.1 to 3.9 dB/cm following MWA at 70 W. Previous studies have shown the attenuation of heat-induced coagulated lesions in the porcine liver increases as the amount of heat is increased. Clarke et al. [Citation69] found a significant increase in the attenuation coefficient, up to 2.4 dB/cm, in the thermal lesion region generated with an ultrasound therapy system in in vivo porcine liver. Damianou et al. [Citation56] studied canine soft tissues at temperatures ranging from room temperature to 70 °C and found that the attenuation coefficient of a degassed ex vivo canine liver dropped initially, but eventually increased to 0.73 dB/cm/MHz at 70 °C. In our previous work, the attenuation coefficient was found to increase from 2 to 7 dB/cm during HIFU ablation in an ex vivo bovine liver, while in the transparent tissue-mimicking phantoms, an increase from 2 to 5 dB/cm was observed [Citation39]. More recently, a study conducted by Samimi et al. [Citation31] showed an increase of the mean attenuation coefficient from 0.68 to 0.90 dB/cm/MHz in an ex vivo bovine liver within regions of interest drawn inside the ablated zone during MWA ablation. Therefore, higher MWA doses are expected to cause higher attenuation in the thermal lesions that are formed.
The variance in values of the Δα0 statistical parameter and CNR may be the result of tissue heterogeneity and bubble activity in the ablation region. Although the tissues were examined with ultrasonic B-mode imaging prior to the experiment to avoid large vessels in the ablation region, some small vessels and fascia were still present in the organs. During MWA treatment, bubble activity may be the result of boiling [Citation65] and may cause fluctuations in the attenuation coefficient during HIFU treatment [Citation39]. Thermal lesions that appeared in the porcine liver after MWA were observed as white discolouration in the optical images. A bright hyper-echoic region appeared in ultrasonic B-mode images and Δα0 images, caused by both bubble activity and thermal effects during thermal treatment [Citation39]. For real-time monitoring, the RF data are acquired during ablation to construct B-mode images and Δα0 images. Therefore, the real-time RF data acquisition can be influenced by gas bubbles induced during ablation. The hyper-echoic region may reflect the acoustic properties of the ablated regions, which become enlarged as the lesion develops during MWA exposure. Moreover, tissue non-homogeneity and random bubble activity may lead to variations in the raw ultrasound backscattered signals from the ablation region, thereby influencing the estimated ultrasonic Δα0 and corresponding CNR values.
There are some limitations in this study and further research is required. An inadequate number of the livers and kidneys were used in the ROC analysis. Furthermore, additional experiments with different animal models are needed to fully demonstrate the suitability of the proposed imaging technique as a treatment monitoring tool. During MWA treatment, the hyper-echoic regions in the ultrasonic B-mode images can mainly be attributed to gas bubbles, therefore, changes in attenuation may also be the result of gas bubbles. Rahimian and Tavakkoli [Citation37] used the attenuation parameter to monitor HIFU ablation in an ex vivo bovine liver, and suggested that the rapid increase in Δα0 may be attributed to bubble activity, which can cause abrupt changes in the acoustic properties of the tissue at the HIFU treatment site. Our previous work also indicates that bubble activity has a dominant effect on the dynamic changes in attenuation during thermal ablation [Citation39]. Bubbles are composed of air which represents a major impedance mismatch and acts to efficiently scatter the ultrasound pulses, which can cause significant acoustic attenuation. Air bubbles filling the ablation zone may be a key factor in allowing the attenuation imaging to characterise thermal lesions. Further studies are necessary to determine the relative contributions of bubble activity and thermal lesions to the increases in Δα0 values during thermal ablation.
Conclusions
An in vivo porcine model was used to explore the feasibility of using ultrasonic Δα0 imaging to evaluate MWA-induced thermal lesions in a porcine liver and kidney for the purpose of monitoring MWA treatments. After MWA exposure, the ultrasonic Δα0 values in the thermal lesion region increased and CNR values calculated from the ultrasonic Δα0 images were higher than those calculated from the ultrasonic echo amplitudes in ultrasonic B-mode images. This suggests the ultrasonic Δα0 imaging may offer superior image contrast for monitoring MWA treatments. The higher AUC value from the ultrasonic Δα0 images indicates a more accurate prediction of the ablation region in comparison to using B-mode images. The change in the size and area of the ablation observed using ultrasonic Δα0 imaging agreed well with values measured from the optical images of the tissue section. This study, performed using an in vivo a porcine model, suggests that ultrasonic Δα0 imaging may be useful in evaluating the formation of MWA-induced thermal lesions and may be utilised as an alternative modality in the development of real-time monitoring systems for image-guided MWA treatments.
Disclosure statement
The authors declare no conflicts of interest.
Additional information
Funding
References
- Isfort P, Penzkofer T, Tanaka T, et al. (2013). Efficacy of antegrade pyeloperfusion to protect the renal pelvis in kidney microwave ablation using an in vivo swine model. Invest Radiol 48:863–8.
- Zhang SY, Li C, Yin H, et al. (2013). Surface vibration and nearby cavitation of an ex vivo bovine femur exposed to high intensity focused ultrasound. J Acoust Soc Am 134:1656–62.
- Chu KF, Dupuy DE. (2014). Thermal ablation of tumours: biological mechanisms and advances in therapy. Nat Rev Cancer 14:199–208.
- Ahmed M, Brace CL, Lee FT, et al. (2011). Principles of and advances in percutaneous ablation. Radiology 258:351–69.
- Carrafiello G, Mangini M, Fontana F, et al. (2012). Complications of microwave and radiofrequency lung ablation: personal experience and review of the literature. Radiol Med 117:201–13.
- Wright AS, Sampson LA, Warner TF, et al. (2005). Radiofrequency versus microwave ablation in a hepatic porcine model. Radiology 236:132–9.
- Goldberg SN, Gazelle GS, Solbiati L, et al. (1996). Radiofrequency tissue ablation: increased lesion diameter with a perfusion electrode. Acad Radiol 3:636–44.
- Organ LW. (1976). Electrophysiologic principles of radiofrequency lesion making. Appl Neurophysiol 39:69–76.
- Lu DS, Raman SS, Vodopich DJ, et al. (2002). Effect of vessel size on creation of hepatic radiofrequency lesions in pigs: assessment of the “heat sink” effect. Am J Roentgenol 178:47–51.
- Stattner S, Primavesi F, Yip VS, et al. (2015). Evolution of surgical microwave ablation for the treatment of colorectal cancer liver metastasis: review of the literature and a single centre experience. Surg Today 45:407–15.
- Mauri G, Cova L, De Beni S, et al. (2015). Real-time US-CT/MRI image fusion for guidance of thermal ablation of liver tumors undetectable with US: results in 295 cases. Cardiovasc Intervent Radiol 38:143–51.
- Yang Y, Zhang J, Han ZY, et al. (2015). Ultrasound-guided percutaneous microwave ablation for adenomyosis: efficacy of treatment and effect on ovarian function. Sci Rep 5:1–7.
- Wei ZG, Zhang KX, Ye X, et al. (2015). Computed tomography-guided percutaneous microwave ablation combined with osteoplasty for palliative treatment of painful extraspinal bone metastases from lung cancer. Skeletal Radiol 44:1485–90.
- Fornage BD, Hwang RF. (2014). Current status of imaging-guided percutaneous ablation of breast cancer. Am J Roentgenol 203:442–8.
- Tsui PH, Shu YC, Chen WS, et al. (2012). Ultrasound temperature estimation based on probability variation of backscatter data. Med Phys 39:2369–85.
- Birkl C, Langkammer C, Haybaeck J, et al. (2014). Temperature-induced changes of magnetic resonance relaxation times in the human brain: a postmortem study. Magn Reson Med 71:1575–80.
- Yue WW, Wang SR, Wang B, et al. (2013). Ultrasound guided percutaneous microwave ablation of benign thyroid nodules: safety and imaging follow-up in 222 patients. Eur J Radiol 82:E11–16.
- Zhou ZH, Wu WW, Wu SC, et al. (2014). A survey of ultrasound elastography approaches to percutaneous ablation monitoring. Proc Inst Mech Eng H 228:1069–82.
- Rubert N, Bharat S, DeWall RJ, et al. (2010). Electrode displacement strain imaging of thermally-ablated liver tissue in an in vivo animal model. Med Phys 37:1075–82.
- Korkusuz H, Happel C, Klebe J, et al. (2015). Diagnostic accuracy of elastography and scintigraphic imaging after thermal microwave ablation of thyroid nodules. Fortschr Röntgenstr 187:353–9.
- Seo CH, Shi Y, Huang SW, et al. (2011). Thermal strain imaging: a review. Interface Focus 1:649–64.
- Yang W, Alexander M, Rubert N, et al. (2014). Monitoring microwave ablation for liver tumors with electrode displacement strain imaging. 2014 IEEE International Ultrasonics Symposium; 2014 Sept 3?6; 1128–31.
- DeWall RJ, Varghese T, Madsen EL. (2011). Shear wave velocity imaging using transient electrode perturbation: phantom and ex vivo validation. IEEE Trans Med Imaging 30:666–78.
- Techavipoo U, Varghese T, Chen Q, et al. (2004). Temperature dependence of ultrasonic propagation speed and attenuation in excised canine liver tissue measured using transmitted and reflected pulses. J Acoust Soc Am 115:2859–65.
- Tsui PH, Chien YT, Liu HL, et al. (2012). Using ultrasound CBE imaging without echo shift compensation for temperature estimation. Ultrasonics 52:925–35.
- Yang CL, Zhu H, Wu SC, et al. (2010). Correlations between B-mode ultrasonic image texture features and tissue temperature in microwave ablation. J Ultras Med 29:1787–99.
- Choi K, Kong D, Park J, eds. (2012). Noninvasive ultrasound temperature imaging with fusion algorithm. 2012 IEEE International Ultrasonics Symposium; 2012 Oct 7–10, 933–6.
- Subramanian S, Rudich SM, Alqadah A, et al. (2014). In vivo thermal ablation monitoring using ultrasound echo decorrelation imaging. Ultrasound Med Biol 40:102–14.
- Bevan PD, Sherar MD. (2001). B-scan ultrasound imaging of thermal coagulation in bovine liver: frequency shift attenuation mapping. Ultrasound Med Biol 27:809–17.
- Bevan PD, Sherar MD. (2001). B-scan ultrasound imaging of thermal coagulation in bovine liver: log envelope slope attenuation mapping. Ultrasound Med Biol 27:379–87.
- Samimi K, White JK, Brace CL, et al. (2017). Monitoring microwave ablation of ex vivo bovine liver using ultrasonic attenuation imaging. Ultrasound Med Biol 43:1441–51.
- Zhang SY, Li C, Zhou FY, et al. (2014). Enhanced lesion-to-bubble ratio on ultrasonic Nakagami imaging for monitoring of high-intensity focused ultrasound. J Ultras Med 33:959–70.
- Zhang SY, Zhou FY, Wan MX, et al. (2012). Feasibility of using Nakagami distribution in evaluating the formation of ultrasound-induced thermal lesions. J Acoust Soc Am 131:4836–44.
- Zhou ZH, Sheng L, Wu SC, et al. (2013). Ultrasonic evaluation of microwave-induced thermal lesions based on wavelet analysis of mean scatterer spacing. Ultrasonics 53:1325–31.
- Ribault M, Chapelon JY, Cathignol D, et al. (1998). Differential attenuation imaging for the characterization of high intensity focused ultrasound lesions. Ultrason Imaging 20:160–77.
- Rahimian S, Tavakkoli J. (2013). Estimating dynamic changes of tissue attenuation coefficient during high-intensity focused ultrasound treatment. J Ther Ultrasound 11:22.
- Rahimian S, Tavakkoli J. (2012). An acoustic backscatter-based method for estimating attenuation towards monitoring lesion formation in high intensity focused ultrasound. AIP Conf Proc 1503:107–12.
- Liang P, Wang Y, Zhang DK, et al. (2008). Ultrasound guided percutaneous microwave ablation for small renal cancer: initial experience. J Urol 180:844–8.
- Zhang SY, Wan MX, Zhong H, et al. (2009). Dynamic changes of integrated backscatter, attenuation coefficient and bubble activities during high-intensity focused ultrasound (HIFU) treatment. Ultrasound Med Biol 35:1828–44.
- Zhang SY, Ding T, Wan MX, et al. (2011). Minimizing the thermal losses from perfusion during focused ultrasound exposures with flowing microbubbles. J Acoust Soc Am 129:2336–44.
- Zhang SY, Zong YJ, Wan MX, et al. (2012). Compare ultrasound-mediated heating and cavitation between flowing polymer- and lipid-shelled microbubbles during focused ultrasound exposures. J Acoust Soc Am 131:4845–55.
- Zhang SY, Cui ZW, Xu TQ, et al. (2017). Inverse effects of flowing phase-shift nanodroplets and lipid-shelled microbubbles on subsequent cavitation during focused ultrasound exposures. Ultrason Sonochem 34:400–9.
- Abd Manaf N, Aziz MNC, Ridzuan DS, et al. (2016). Feasibility of A-mode ultrasound attenuation as a monitoring method of local hyperthermia treatment. Med Biol Eng Comput 54:967–81.
- Ophir J, Shawker TH, Maklad NF, et al. (1984). Attenuation estimation in reflection – progress and prospects. Ultrason Imaging 6:349–95.
- He P, Greenleaf JF. (1986). Attenuation estimation on phantoms – a stability test. Ultrason Imaging 8:1–10.
- Jang HS, Song TK, Park SB. (1988). Ultrasound attenuation estimation in soft tissue using the entropy difference of pulsed echoes between two adjacent envelope segments. Ultrason Imaging 10:248–64.
- Kuc R. (1984). Estimating acoustic attenuation from reflected ultrasound signals – comparison of spectral-shift and spectral-difference approaches. IEEE Trans Acoust Speech Signal Process Speech 32:1–6.
- Kuc R, Li H. (1985). Estimating the center-frequency of reflected ultrasound using maximum-entropy method spectral estimation. Ultrasonic Imaging 7:94.
- Yao LX, Zagzebski JA, Madsen EL. (1990). Backscatter coefficient measurements using a reference phantom to extract depth-dependent instrumentation factors. Ultrason Imaging 12:58–70.
- Kim H, Varghese T. (2008). Hybrid spectral domain method for attenuation slope estimation. Ultrasound Med Biol 34:1808–19.
- Bush NL, Rivens I, Terhaar GR, et al. (1993). Acoustic properties of lesions generated with an ultrasound therapy system. Ultrasound Med Biol 19:789–801.
- Towa RT, Miller RJ, Rizzell LA, et al. (2002). Attenuation coefficient and propagation speed estimates of rat and pig intercostal tissue as a function of temperature. IEEE Trans Ultrason Ferroelect Freq Contr 49:1411–20.
- Gertner MR, Wilson BC, Sherar MD. (1997). Ultrasound properties of liver tissue during heating. Ultrasound Med Biol 23:1395–403.
- Choi MJ, Guntur SR, Lee JM, et al. (2011). Changes in ultrasonic properties of liver tissue in vitro during heating-cooling cycle concomitant with thermal coagulation. Ultrasound Med Biol 37:2000–12.
- Worthington AE, Sherar MD. (2001). Changes in ultrasound properties of porcine kidney tissue during heating. Ultrasound Med Biol 27:673–82.
- Damianou CA, Sanghvi NT, Fry FJ, et al. (1997). Dependence of ultrasonic attenuation and absorption in dog soft tissues on temperature and thermal dose. J Acoust Soc Am 102:628–34.
- Kemmerer JP, Oelze ML. (2012). Ultrasonic assessment of thermal therapy in rat liver. Ultrasound Med Biol 38:2130–7.
- Zhong H, Wan MX, Jiang YF, et al. (2007). Monitoring imaging of lesions induced by high intensity focused ultrasound based on differential ultrasonic attenuation and integrated backscatter estimation. Ultrasound Med Biol 33:82–94.
- Divkovic GW, Liebler M, Braun K, et al. (2007). Thermal properties and changes of acoustic parameters in an egg white phantom during heating and coagulation by high intensity focused ultrasound. Ultrasound Med Biol 33:981–6.
- Yang C, Sheng L, Wu S, eds. (2011). Features of ultrasonic radio frequency signal in microwave ablation experiments. International Conference on Information Technology, Computer Engineering and Management Sciences; 2011 Sep 24–25, vol. 3, 55–8.
- Fosnight TR, Hooi FM, Keil RD, et al. (2017). Echo decorrelation imaging of rabbit liver and vx2 tumor during in vivo ultrasound ablation. Ultrasound Med Biol 43:176–86.
- Hanley JA, McNeil BJ. (1982). The meaning and use of the area under a receiver operating characteristic (ROC) curve. Radiology 143:29–36.
- Hanley JA, McNeil BJ. (1983). A method of comparing the areas under receiver operating characteristic curves derived from the same cases. Radiology 148:839–43.
- Abramoff MD, Magelhaes PJ, Ram SJ. (2004). Image processing with ImageJ. Biophoton Int 11:36–42.
- Deardorff DL, Diederich CJ, Nau WH. (2001). Control of interstitial thermal coagulation: comparative evaluation of microwave and ultrasound applicators. Med Phys 28:104–17.
- Pauly H, Schwan HP. (1971). Mechanism of absorption of ultrasound in liver tissue. J Acoust Soc Am 50:692–9.
- Krzanowski WJ, Hand DJ. (2015). ROC Curves for continuous data. Rev Neurol 171(Suppl.1):A3.
- Zhang SY, Han YQ, Zhu XG, et al. (2017). Feasibility of using ultrasonic Nakagami imaging for monitoring microwave-induced thermal lesion in ex vivo porcine liver. Ultrasound Med Biol 43:482–93.
- Clarke RL, Bush NL, Ter Haar GR. (2003). The changes in acoustic attenuation due to in vitro heating. Ultrasound Med Biol 29:127–35.