
Abstract
Purpose: Tumor response and treatment toxicity are related to minimum and maximum tissue temperatures during hyperthermia, respectively. Using a large set of clinical data, we analyzed the number of sensors required to adequately monitor skin temperature during superficial hyperthermia treatment of breast cancer patients.
Methods: Hyperthermia treatments monitored with >60 stationary temperature sensors were selected from a database of patients with recurrent breast cancer treated with re-irradiation (23 × 2 Gy) and hyperthermia using single 434 MHz applicators (effective field size 351–396 cm2). Reduced temperature monitoring schemes involved randomly selected subsets of stationary skin sensors, and another subset simulating continuous thermal mapping of the skin. Temperature differences (ΔT) between subsets and complete sets of sensors were evaluated in terms of overall minimum (Tmin) and maximum (Tmax) temperature, as well as T90 and T10.
Results: Eighty patients were included yielding a total of 400 hyperthermia sessions. Median ΔT was <0.01 °C for T90, its 95% confidence interval (95%CI) decreased to ≤0.5 °C when >50 sensors were used. Subsets of <10 sensors result in underestimation of Tmax up to −2.1 °C (ΔT 95%CI), which decreased to −0.5 °C when >50 sensors were used. Thermal profiles (8–21 probes) yielded a median ΔT < 0.01 °C for T90 and Tmax, with a 95%CI of −0.2 °C and 0.4 °C, respectively. The detection rate of Tmax ≥43 °C is ≥85% while using >50 stationary sensors or thermal profiles.
Conclusions: Adequate coverage of the skin temperature distribution during superficial hyperthermia treatment requires the use of >50 stationary sensors per 400 cm2 applicator. Thermal mapping is a valid alternative.
Introduction
Hyperthermia (HT), i.e., increasing tumor temperature to 41-45 °C for one hour, is a proven radiotherapy (RT) and chemotherapy sensitizer [Citation1–3]. HT delivery is monitored using temperature sensors, but the required minimum number of sensors has not been identified. Unlike chemotherapy or RT, delivery of a prescribed HT dose is challenging due to limited number of sensors, patient-specific anatomy, and patient-specific response to heat treatment. The HT dose that can be given often depends on the maximum temperature patients can tolerate, which is unknown prior to treatment and may vary in subsequent treatments. In addition, temperature uniformity is not guaranteed due to heterogeneous power deposition and heterogeneous perfusion, which is tissue, time and temperature dependent [Citation4]. For various tumor types, e.g., sarcoma, melanoma, head and neck cancer, and recurrent breast cancer, tumor response and local control were shown to be related to minimum temperature (Tmin) and the 90th percentile of temperatures (T90) achieved in the treatment area during HT [Citation5–16]. In addition, there is a clear relationship between maximum temperature (Tmax) and HT associated toxicity [Citation12,Citation15,Citation17–21]. Recent consensus advocate that Tmax should not exceed 43–45 °C [Citation4]. This statement is supported by an observational study of 262 female patients treated for recurrent breast cancer with reirradiation (reRT) and HT: no HT associated toxicity occurred when Tmax remained below 43.0 °C, while the probability of a second-degree burn was 5% when Tmax was 43.7 °C [Citation17]. These conclusions highlight the need to find the delicate balance between optimizing HT for best tumor response while minimizing toxicity by avoiding excessively low and excessively high temperatures.
Adequate thermometry is critical for successful HT treatments. Techniques to measure temperature during HT include fiber-optic probes, thermistors and thermocouples [Citation4,Citation22]. A disadvantage associated with these methods is that temperature is often recorded using a small number of temperature sensors. The European Society for Hyperthermic Oncology (ESHO) technical committee recommended a minimum of five different locations to measure skin temperature every minute during superficial HT. But measuring at just five skin locations may result in under sampling when significant temperature gradients are present, particularly within large treatment areas. Spatial temperature gradients of 1.6 °C/cm have been reported for head and neck [Citation23]. Thermal mapping is an alternative technique that involves moving single-sensor probes cyclically over a fixed trajectory to cover multiple measurement locations with a single sensor. Despite the lower temporal resolution, mapping significantly improves the spatial resolution [Citation24].
For recurrent breast cancer treated with reRT + HT, the reported number of temperature sensors varies between 1 and 82, with a median of 8 per study [Citation9,Citation12,Citation15,Citation17,Citation19, Citation20,Citation25–27]. Major suppliers of superficial HT equipment offer 4-32 sensors (ALBA ON 4000, Medlogix, Italy) or 4-8 sensors (BSD-500, Pyrexar, Salt Lake City, UT, USA). At the Academic Medical Center (AMC, Amsterdam, The Netherlands) tumor temperatures are monitored with more than 80 sensors () using a 196-channel thermometry system (UMCU, Utrecht, The Netherlands).
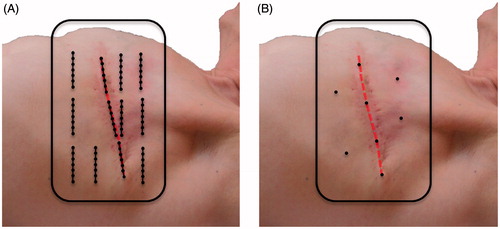
Figure 1. Typical placement of superficial temperature sensors in a previously irradiated area during a superficial hyperthermia treatment of a patient with recurrent breast cancer. (A) At the AMC, multiple 7-point thermocouple probes are placed in the target region, three or four probes are placed in areas with low perfusion, such as the surgical scar (red dashed line), and the remaining probes are spread out over the target region. (B) Most other users spread limited single temperature sensors to maximize coverage of the target area.
HT aims to maximize tumor response while minimizing the risk of HT associated toxicity. To help achieve this goal, we performed a simulation study using subsets of skin temperatures measured during superficial HT treatments of patients with recurrent breast cancer treated with reRT + HT at the AMC. Two reduced temperature monitoring schemes were considered: (1) subsets of randomly selected stationary temperature sensors; and (2) a thermal mapping subset. These subsets were compared in terms of adequate thermometry coverage, thus establishing the minimum required number of sensors during superficial HT. In addition, we investigated the proportion of HT sessions in which a maximum skin temperature exceeding 43.0 °C goes undetected while using smaller subsets of sensors.
Methods
Between February 2015 and June 2017, 137 patients were treated with RT and superficial HT using one or two applicators of the ALBA 4000 Double-ON system (Medlogix, Rome, Italy). Of these, 80 patients presented recurrent breast cancer and were reirradiated with 23 × 2 Gy and five weekly HT sessions. The other 57 patients were excluded from this study for various criteria identified in . Median age at start of treatment was 66 years (range 40–88). Patients had been treated previously with surgery (n = 79), chemotherapy (n = 47), hormonal therapy (n = 44) and radiotherapy (n = 80) with 60.2 ± 8.8 Gy (mean ± SD; range 40–76). Nine patients had macroscopic tumor, whereas in the other 71 patients, the recurrent tumor had been surgically removed before reRT + HT.
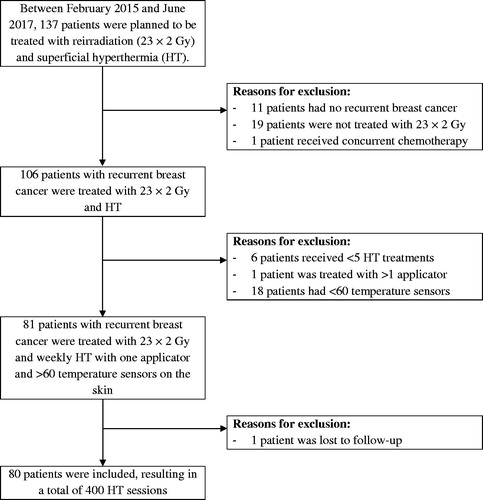
Figure 2. Patient inclusion/exclusion flowchart.
HT objectives were to elevate temperatures in the target region to a minimum of 41 °C for one hour while maintaining maximum skin temperatures below 43.5 °C to minimize occurrence of second-degree burns [Citation17]. Skin temperatures were evaluated in terms of overall minimum (Tmin) and maximum (Tmax) temperature, as well as T90 and T10, which are the 90th and 10th percentile of the temperature measurements during steady state, respectively. HT started within 30–60 min after RT. The HT device consisted of single conformal contact flexible microstrip applicators (CFMA; Istok, Fryazino, Russia) operating at 434 MHz: models 3 H (n = 36), 4 H (n = 1) and 5 H (n = 43) with effective field sizes (EFS) of 396, 216 and 351 cm2, respectively [Citation28]. The EFS is defined as the area enclosed within the 50% contour of normalized specific absorption rate (SAR), where the normalization was performed at 1 cm depth in a flat homogeneous phantom [Citation29]. A flat water bag containing temperature-controlled circulating deionized water was placed between antenna and skin to control skin temperature and couple microwave energy to the human body. The water temperature was adjusted within 38–42 °C to maintain a minimum temperature of 41 °C on the target skin surface.
Temperature monitoring was performed with 7-point copper-constantan thermocouple probes (±0.05 °C accuracy; ELLA-CS, Hradec Králové, Czech Republic) placed both interstitially and superficially on the skin (). The probes were placed perpendicular to the dominant direction of the electromagnetic field to avoid self-heating of the thermocouple probes. Power of the microwave device was on for 25 s and then off for 1 s to enable electronically undisturbed temperature measurements once every 26 s with a 196-channel thermometry system (UMCU, Utrecht, The Netherlands). Note that superficial temperature measurements are influenced by water bolus temperature, type of thermometry and the presence of plastic coating and surrounding catheters around the sensor [Citation30,Citation31] and may thus indicate a temperature lower than the actual temperature a few millimeters deep in the skin [Citation17,Citation32]. The superficial temperatures were measured with a median of thirteen 7-point probes (range 8–21) and 89 sensors (range 60–147), where broken sensors were excluded from the analysis. No interstitial temperature data are reported in this study.
Subset analysis
The multi-step procedure to randomly select subsets of stationary sensors is illustrated in . First, a patient with one of its corresponding HT sessions was drawn at random. Next, several random sensors of each thermocouple probe positioned on the skin were selected. This resulted in six random subsets (with one to six sensors per 7-point probe) and one non-random selection with all seven sensors of the 7-point probe. In subsets with two or three sensors per probe, selected sensors were not allowed to be adjacent. The parameters Tmin, T90, T10 and Tmax of the session were calculated for each sensor selection. To increase the statistical significance, these steps were repeated 5000 times, i.e., each HT session was sampled approximately 12 times.
Figure 3. Simulation steps for thermal mapping and stationary sensors subsets.
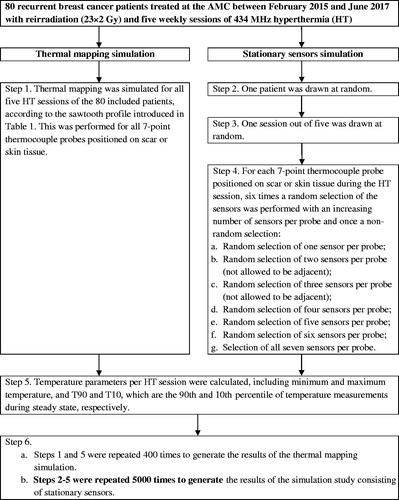
Thermal mapping was simulated as cyclically pulling a sensor in a sawtooth fashion along the 6 cm trajectory of the 7-point probe with a temperature measurement performed every 26 s and every 1 cm, which resulted in a seven-fold reduction in temporal resolution. The transformation of the full set of stationary temperature measurements into a temporal selection of points representing continuous thermal mapping is a non-randomized selection process, which we call ‘thermal profiles’ throughout the manuscript to differentiate from traditional thermal mapping. shows an example of the temporal distribution of the first 20 temperature measurements. This was performed for all five HT sessions of all 80 included patients, using all available superficial temperature measurements (). All simulations were implemented in Matlab R2016a (MathWorks, Natick, MA, USA) using the default random seed.
Table 1. The selection of the first 20 temperature measurements to simulate thermal mapping with thermal profiles using clinical data from stationary 7-point thermocouple probes.
To compare the different subsets to the full set of sensors, we calculated their temperature difference (ΔT) for each simulation. This procedure was repeated for the thermal profile subset. Furthermore, we compared the results for scar and other superficial tissue, as well as for different HT applicators. Finally, we investigated the proportion of treatments where a Tmax ≥ 43.0 °C was identified using the full set of sensors. Using a random selection of these sensors, we simulated the proportion of subsets that still identified a Tmax ≥ 43.0 °C.
Thermometry coverage is well characterized by T90 and Tmax, which correlate with tumor response and toxicity, respectively. We define thermometry coverage as adequate if ΔT 95% CI ≤ 0.5 °C for both T90 and Tmax. This criterion is based on accepting maximum detected temperatures of 43.0 °C, with a deviation ≤0.5 °C. True maximum temperatures may rise up to 43.5 °C, which presents a very small probability (3%) of a second-degree burn [Citation17]. Finally, we investigated spatial temperature gradients on the skin.
Statistical analysis
No correction for stratified sampling was applied because we analyzed the highest and lowest temperature values and not the median or average. Median treatment parameter statistics, 25th and 75th interquartile and 95% CI are reported.
Results
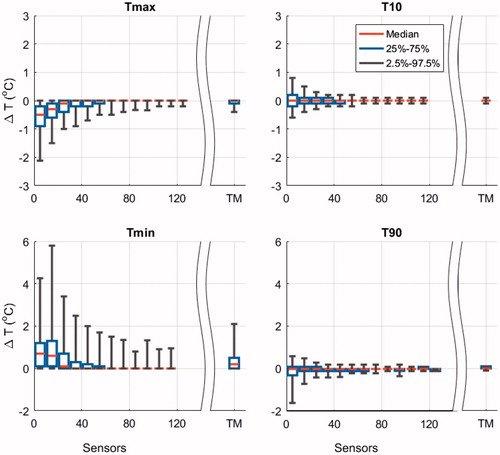
The ΔT between the complete set (range 60–147 sensors) and randomly selected subsets of superficial sensors (range 8–126 sensors) during a HT session are displayed in . In general, Tmin and Tmax show more variation than T90 and T10. Remarkably, T90 and T10 have a median temperature difference <0.01 °C across the different subsets of sensors and small 95% CI, which decrease below 0.5 °C when using >50 and >30 sensors for T90 and T10, respectively. Small subsets of sensors result in overestimation of Tmin and underestimation of Tmax (), and by increasing the number of sensors the over and underestimation of Tmin and Tmax decreased, respectively. The median ΔT associated with Tmax was <−0.01 °C when >20 sensors were randomly selected, its 95% CI decreased below −0.5 °C when >50 sensors were selected. Thermal profiles (17 profiles, median 13 trajectories, range 8–21) showed a median ΔT <0.01 °C for T90 and Tmax for all 400 HT sessions. The corresponding 95% CI were small: −0.2 °C and 0.4 °C for T90 and Tmax, respectively ().
Figure 4. Tukey boxplots of the temperature difference (ΔT) between randomly selected subsets (5000 simulations) and the complete set of sensors during a HT session. The ΔT Tukey boxplot for the thermal profile analysis that represents thermal mapping (TM) is displayed separately (400 simulations). The median (red horizontal line), 25th and 75th percentiles (lower and upper limits of the rectangular box), as well as the 95% confidence intervals (bracketed vertical lines) of the maximum temperature (Tmax), T10, T90 and minimum temperature (Tmin) are displayed for an increasing number of randomly selected temperature sensors in patients with recurrent breast cancer. The median number of stationary sensors analyzed per bin was 110,983 (range 1386–259,041).
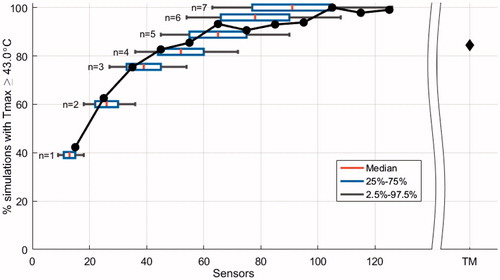
A Tmax ≥43.0 °C was identified in 50.0% of the HT sessions (200 out of 400) and in 50.5% of the simulations (2524 out of 5000). shows that at least 50% of the sessions with temperatures ≥43.0 °C were not detected when 20 sensors were used. Doubling the number of sensors to 40 increased the detection rate to 80%. Thermal profiles identified treatments with temperatures ≥43.0 °C in 85% of the simulations, which is comparable using 50 stationary sensors.
Figure 5. Normalized percentage of simulations that identify a maximum temperature (Tmax) ≥ 43.0 °C (2524 simulations) as a function of randomly selected sensors. The result of thermal profiles, which represents thermal mapping (TM), is displayed separately (85%; 200 simulations). Tukey boxplots show the median (red vertical line), 25th and 75th percentiles (lower and upper limits of the rectangular box), as well as 95% confidence intervals (bracketed horizontal lines) of the number of sensors when n sensors per 7-point probe are selected. The solid circles represent the results per interval of sensors in bins of 10. The median number of stationary sensors analyzed per bin was 51,589 (range 1656–119,510).
Finally, when the temperature results of scar were analyzed separately from other superficial tissue, the temperature differences of scar presented lower absolute medians and smaller ΔT 95% CI for all four parameters (Tmin, T90, T10 and Tmax). For example, for subsets of <10 stationary sensors the median ΔT Tmax was −0.1 °C (scar) vs. −0.4 °C (other superficial tissue). Furthermore, for patients treated with the 3 H applicator (EFS = 396 cm2, n = 36) the temperature difference showed wider ΔT 95% CI for all four parameters compared to the 5 H applicator (EFS = 351 cm2, n = 43). For example, for subsets of <10 stationary sensors, the ΔT 95% CI of Tmax was −2.7 °C (3H) vs. −1.7 °C (5H). In the 400 HT sessions, the median maximum spatial temperature gradient measured on the skin was 1.1 °C/cm (range 0.3–1.9 °C/cm).
Discussion
A simulation study was performed using clinical superficial temperature measurements of HT treatments of patients with recurrent breast cancer treated with reRT + HT at the AMC. Using a large set of clinical data with detailed temperature recordings (≥60 sensors), subsets with an increasing number of skin temperature sensors were randomly selected. The corresponding Tmin, T90, T10 and Tmax parameters were calculated. A similar analysis was performed for another subset of the clinical data, where we simulated the use of thermal mapping.
We found that T90, T10 and Tmax are generally robust parameters that can be detected within 0.5 °C as measured by the ΔT 95% CI using: >50 stationary sensors (T90 and Tmax), >30 stationary sensors (T10), or using thermal profiles (T90, T10 and Tmax). Furthermore, median ΔT of T90 and T10 was <0.01 °C even when using <10 sensors. These findings indicate that T90 and T10 parameters can be used to compare HT treatments between different HT centers or between different sources in literature. However, for comparison purposes, we recommend a ΔT 95% CI ≤1.0 °C, which implies the use of at least 20 stationary sensors or thermal profiles. Regardless of the comparison, the quality of thermometry remains highly dependent on a rigorous spatial sensor distribution that should capture all heterogeneities in superficial tissue, including scars. Note that T90 and T10 derived from skin temperature sensors do not represent the dose in the entire tumor. The quality of hyperthermia treatment is more dominantly determined by interstitial temperature (dose) values, the ESHO technical committee therefore strongly advises to measure both superficial and interstitial temperatures during hyperthermia treatment [Citation4].
The minimum and maximum temperatures deviate significantly for a low number of sensors (). For <10 sensors Tmax can be underestimated with a ΔT 95% CI of 2.1 °C. This can have serious implications for the estimated toxicity based on temperature values during HT, since the probability of a second-degree burn will significantly increase when a Tmax of 43 °C is underestimated by 2.1 °C [Citation17]. To reduce the risk of missing a temperature peak, one would need >100 temperature sensors on the skin during HT treatment (). However, even our complete set of thermometry does not fully cover the entire treatment area. Sensors within a probe are located at 1 cm distance, thus a temperature peak of 44.0 °C is unlikely but theoretically possible between two neighboring sensors both measuring 43.0 °C, based on the highest expected gradients of 1.9 °C/cm. Such a temperature peak would still be below the typical pain threshold of 44.5 °C [Citation21,Citation33] and would give 10% probability on a second-degree burn [Citation17]. However, the distance between different probes positioned on the skin was more than 1 cm (). It would thus be necessary to place a temperature sensor on every 1 cm2 if one would want to limit the maximum possible temperature peak to 44.0 °C throughout the target area. In alternative, the maximum temperature limits during HT treatment could be reduced depending on the number of sensors that was used (), For example, when <10 sensors were placed on the skin, a reduction of 0.9 °C in the maximum temperature limit, from 43.7 °C to 42.8 °C, would leave 25% of the HT sessions at risk for undetected temperatures above 43.7 °C, i.e., ≥5% probability on a second-degree burn [Citation17].
Thermal mapping is a strategy to increase thermometry coverage using a relatively low number of sensors. There are many thermal mapping protocols, e.g., mapping a trajectory of 14 cm in 1 cm increments, performed at 5 min intervals [Citation34] or using essentially stationary sensors with whom a manual map is performed 2–3 times during treatment [Citation24]. Without loss of generality, we choose to implement a simple, logical and generic thermal mapping procedure with our dataset. The implemented thermal mapping procedure entails more thermal profiles per treatment (17 profiles) than standard practice reported in literature for thermal mapping (2–10 maps), furthermore shorter trajectories (6 cm) were taken into account than standard practice reported in literature (14 cm). In our study, thermal profiles performed much better than the same number of stationary sensors (median 13, range 8–21); and its performance was comparable to 31–40 stationary sensors in terms of Tmin, T90, T10 and Tmax (). It increased the detection rate of temperatures above 43 °C from 40% to 85% (). Therefore, thermal mapping is strongly recommended when there are only a few sensors available, as with current commercially available superficial HT equipment, under the condition that thermal mapping is performed at least every 5–10 minutes to gain sufficient maps during the treatment. The effectiveness of thermal mapping could be further extended by optimizing the mapping trajectories, the acquisition time, and steps per map, so that the density of sampled temperature points under the applicator is increased.
Part of the temperature sensors were placed on the surgical scar (28.8%), which is a tissue that tends to overheat due to poor perfusion. The scar showed smaller ΔT 95% CI than other superficial tissue for all four parameters. We believe this is because sensors on other superficial tissue are distributed over a much wider treatment area with well vascularized tissue, while the scar is mostly concentrated in the middle of the treatment area and poorly vascularized, and thus shows less variation.
Our study was performed mainly with CFMA applicators with relatively large EFS (351–396 cm2). For applicators with smaller EFS, it is plausible to assume that less temperature sensors are required, though temperature gradients may also be larger within the EFS region of smaller applicators, thus requiring a higher spatial resolution. When comparing the 5 H (351 cm2) and 3 H applicator (396 cm2), we found that patients treated with the 3 H applicator had a wider ΔT 95% CI. We hypothesize that this is due to wider spacing of probes over the larger applicator aperture. Thus, the required minimum number of sensors to adequately monitor temperature parameters depends on applicator size and type. Furthermore, there will also be a tumor-specific, e.g., microscopic vs. macroscopic disease, and patient-specific component, e.g., presence of scars. It should be investigated whether the results of this study are valid for a wider range of applicators, devices and disease types. Nevertheless, this study indicates that there is a need for much higher spatial resolution of temperature sensors than is now general standard practice.
Conclusions
The quality assessment of superficial HT treatment delivery is dependent on temperature feedback from superficial and interstitial temperature readings. To this date, the minimum spatial coverage requirements have not been fully addressed. Based on our study, we conclude that to adequately monitor superficial temperature during superficial HT, >50 stationary sensors per 400 cm2 applicator are required. Although we advise >100 sensors on the skin to reduce the risk of missing a temperature peak. As an alternative to >50 sensors, the use of continuous thermal mapping with approximately 13 sensors would provide similar effective results in terms of temperature coverage. When only a lower number of sensors is available, the maximum temperature limit during HT should be decreased as a function of the number of sensors used, to minimize toxicity from unrecorded temperature peaks. Our findings indicate that the T90 and T10 parameters can be used to compare HT treatments between different HT centers or different sources in literature with varying number of sensors, provided a minimum of 20 stationary sensors is used.
Acknowledgements
This research did not receive any specific grant from funding agencies in the public, commercial, or not-for-profit sectors.
Disclosure statement
No potential conflict of interest was reported by the authors.
References
- Datta NR, Puric E, Klingbiel D, et al. Hyperthermia and radiation therapy in locoregional recurrent breast cancers: a systematic review and meta-analysis. Int J Radiat Oncol Biol Phys. 2016;94:1073–1087.
- Franckena M, van der Zee J. Use of combined radiation and hyperthermia for gynecological cancer. Curr Opin Obstet Gynecol. 2010;22:9–14.
- van der Zee J, González González D, van Rhoon GC, et al. Comparison of radiotherapy alone with radiotherapy plus hyperthermia in locally advanced pelvic tumours: a prospective, randomised, multicentre trial. Dutch Deep Hyperthermia Group. Lancet. 2000;355:1119–1125.
- Dobšíček Trefná H, Crezee H, Schmidt M, et al. Quality assurance guidelines for superficial hyperthermia clinical trials: I. Clinical requirements. Int J Hyperth. 2017;33:471–482.
- Dewhirst MW, Sim DA. The utility of thermal dose as a predictor of tumor and normal tissue responses to combined radiation and hyperthermia. Cancer Res. 1984;44:4772–4780.
- Engin K, Leeper DB, Tupchong L, et al. Thermoradiation therapy for superficial malignant tumors. Cancer. 1993;72:287–296.
- Franckena M, Fatehi D, Bruijne M. d, et al. Hyperthermia dose-effect relationship in 420 patients with cervical cancer treated with combined radiotherapy and hyperthermia. Eur J Cancer. 2009;45:1969–1978.
- Gabriele P, Ferrara T, Baiotto B, et al. Radio hyperthermia for re-treatment of superficial tumours. Int J Hyperth. 2009;25:189–198.
- Hand JW, Machin D, Vernon CC, et al. Analysis of thermal parameters obtained during phase III trials of hyperthermia as an adjunct to radiotherapy in the treatment of breast carcinoma. Int J Hyperth. 1997;13:343–364.
- Hiraoka M, Nishimura Y, Masunaga SIC, et al. Clinical evaluation of 430 MHz microwave hyperthermia system with lens applicator for cancer therapy. Med Biol Eng Comput. 1995;33:44–47.
- Jones EL, Oleson JR, Prosnitz LR, et al. Randomized trial of hyperthermia and radiation for superficial tumors. J Clin Oncol. 2005;23:3079–3085.
- Kapp DS, Cox RS, Fessenden P, et al. Parameters predictive for complications of treatment with combined hyperthermia and radiation therapy. Int J Radiat Oncol Biol Phys. 1992;22:999–1008.
- Oleson JR, Samulski TV, Leopold KA, et al. Sensitivity of hyperthermia trial outcomes to temperature and time: implications for thermal goals of treatment. Int J Radiat Oncol Biol Phys. 1993;25:289–297.
- Overgaard J, Gonzalez Gonzalez D, Hulshof MC, et al. Hyperthermia as an adjuvant to radiation therapy of recurrent or metastatic malignant melanoma. A multicentre randomized trial by the European Society for Hyperthermic Oncology. Int J Hyperth. 1996;12:3–20.
- Seegenschmiedt MH, Klautke G, Walther E, et al. Water-filtered infrared-A-hyperthermia combined with radiotherapy in advanced and recurrent tumors. Initial results of a multicenter phase I-II study. Strahlenther Onkol. 1996;172:475–484.
- Vujaskovic Z, Kim DW, Jones E, et al. A phase I/II study of neoadjuvant liposomal doxorubicin, paclitaxel, and hyperthermia in locally advanced breast cancer. Int J Hyperth. 2010;26:514–521.
- Bakker A, Kolff MW, Holman R, et al. Thermal skin damage during reirradiation and hyperthermia is time-temperature dependent. Int J Radiat Oncol Biol Phys. 2017;98:392–399.
- Howard GCW, Sathiaseelan V, Freedman L, et al. Hyperthermia and radiation in the treatment of superficial malignancy: an analysis of treatment parameters, response and toxicity. Int J Hyperth. 1987;3:1–8.
- Linthorst M, Van Geel AN, Baaijens M, et al. Re-irradiation and hyperthermia after surgery for recurrent breast cancer. Radiother Oncol. 2013;109:188–193.
- Linthorst M, Baaijens M, Wiggenraad R, et al. Local control rate after the combination of re-irradiation and hyperthermia for irresectable recurrent breast cancer: Results in 248 patients. Radiother Oncol. 2015;117:217–222.
- Yarmolenko PS, Moon EJ, Landon C, et al. Thresholds for thermal damage to normal tissues: an update. Int J Hyperth. 2011;27:320–343.
- Schooneveldt G, Bakker A, Balidemaj E, et al. Thermal dosimetry for bladder hyperthermia treatment. An overview. Int J Hyperth. 2016;32:417–433.
- Paulides MM, Bakker JF, Linthorst M, et al. The clinical feasibility of deep hyperthermia treatment in the head and neck: new challenges for positioning and temperature measurement. Phys Med Biol. 2010;55:2465–2480.
- Stauffer PR, Maccarini P, Arunachalam K, et al. Conformal microwave array (CMA) applicators for hyperthermia of diffuse chest wall recurrence. Int J Hyperth. 2010;26:686–698.
- Ben-Yosef R, Vigler N, Inbar M, et al. Hyperthermia combined with radiation therapy in the treatment of local recurrent breast cancer. Isr Med Assoc J. 2004;6:392–395.
- Egawa S, Tsukiyama I, Watanabe S, et al. A randomized clinical trial of hyperthermia and radiation versus radiation alone for superficially located cancers. J Japanese Soc Ther Radiol Oncol. 1989;1:135–140.
- Kouloulias VE, Dardoufas CE, Kouvaris JR, et al. Liposomal doxorubicin in conjunction with reirradiation and local hyperthermia treatment in recurrent breast cancer: a phase I/II trial. Clin Cancer Res. 2002;8:374–382.
- Gelvich EA, Mazokhin VN. Contact flexible microstrip applicators (CFMA) in a range from microwaves up to short waves. IEEE Trans Biomed Eng. 2002;49:1015–1023.
- Hand JW, Lagendijk JJ, Bach Andersen J, et al. Quality assurance guidelines for ESHO protocols. Int J Hyperthermia. 1989;5:421–428.
- Arunachalam K, Maccarini P, Juang T, et al. Performance evaluation of a conformal thermal monitoring sheet (TMS) sensor array for measurement of surface temperature distributions during superficial hyperthermia treatments. Int J Hyperth. 2008;24:313–325.
- Lee ER, Kapp DS, Lohrbach AW, et al. Influence of water bolus temperature on measured skin surface and intradermal temperatures. Int J Hyperth. 1994;10:59–72.
- Van der Gaag M, De Bruijne M, Samaras T, et al. Development of a guideline for the water bolus temperature in superficial hyperthermia. Int J Hyperth. 2006;22:637–656.
- Dewhirst MW, Viglianti BL, Lora-Michiels M, et al. Basic principles of thermal dosimetry and thermal thresholds for tissue damage from hyperthermia. Int J Hyperth. 2003;19:267–294.
- Fatehi D, Van Der Zee J, Wielheesen DHM, et al. Intra-luminal thermometry: is tissue type assignment a necessity for thermal analysis? Int J Hyperth. 2006;22:463–473.