
 ?Mathematical formulae have been encoded as MathML and are displayed in this HTML version using MathJax in order to improve their display. Uncheck the box to turn MathJax off. This feature requires Javascript. Click on a formula to zoom.
Abstract
Purpose: This study evaluates the effects of active electrode cooling, via internal fluid circulation, on the irreversible electroporation (IRE) lesion, deployed electric current and temperature changes using a perfused porcine liver model.
Materials and methods: A bipolar electrode delivered IRE electric pulses with or without activation of internal cooling to nine porcine mechanically perfused livers. Pulse schemes included a constant voltage, and a preconditioned delivery combined with an arc-mitigation algorithm. After treatment, organs were dissected, and treatment zones were stained using triphenyl-tetrazolium chloride (TTC) to demonstrate viability.
Results: Thirty-nine treatments were performed with an internally cooled applicator and 21 with a non-cooled applicator. For the constant voltage scenario, the average final electrical current measured was 26.37 and 29.20 A for the cooled and uncooled electrodes respectively (). The average final temperature measured was 33.01 and 42.43 °C for the cooled and uncooled electrodes respectively (
). The average measured ablations (fixed lesion) were 3.88-by-2.08 cm and 3.86-by-2.12 cm for the cooled and uncooled electrode respectively (
,
). Similarly, the preconditioned/arc-mitigation scenario yielded an average final electrical current measurement of a 41.07 and 47.20 A for the cooled and uncooled electrodes respectively (
). The average final temperature measured was 34.93 and 44.90 °C for the cooled and uncooled electrodes respectively (
). The average measured ablations (fixed lesion) were 3.67-by-2.27 cm and 3.58-by-2.09 cm for the cooled and uncooled applicators (
).
Conclusions: The internally-cooled bipolar applicator offers advantages that could improve clinical outcomes. Thermally mitigating internal perfusion technology reduced tissue temperatures and electric current while maintaining similar lesion sizes.
Introduction
Irreversible Electroporation (IRE) is a focal ablation technique used to treat patients with unresectable tumors. IRE relies on 1–2 mm diameter needle applicators to deliver high-amplitude, short-duration, pulsed electric fields to kill cells within a targeted volume of tissue [Citation1–3]. IRE outcomes are contingent on the generated electric field increasing the transmembrane potential, resulting in increased cell membrane permeability and loss of homeostasis, ultimately ensuing cell death. Consequently, IRE can be used to target malignancies adjacent to vital structures (major nerves, blood vessels, etc.) and is less influenced by convective effects due to local blood perfusion. These qualities make IRE an attractive treatment option for many difficult malignancies, including hepatocellular carcinoma and locally advanced pancreatic cancer, the second and fifth leading causes of cancer deaths in the United States, respectively [Citation4].
Although they are not the main cause of cell death, temperature and current variations during IRE treatment are critical [Citation5]. While studies have shown that higher delivered electrical energy can be associated with larger treatment zones, it also causes an increase in the protein denaturation region due to thermal side effects [Citation6]. This creates challenges in generating a sufficiently high pulsed electric field that concurrently covers the entire region of interest, while avoiding undesirable thermal effects. Another obstacle with current IRE treatments is that the treatment zone size is restricted by the amount of energy that can be delivered to the tissue by state-of-art generators. Contingent to the applied voltage, initial pulses can often be delivered to tissue without interruption. However, subsequent pulses can potentially cause the current to momentarily exceed the current limit of the generator as a result of the local increase in the tissue conductivity from the electroporation and heat effects. This brief spike in current may initiate internal safety features within the generator, pausing or, in some instances, terminating the treatment in an effort to prevent circuit damage [Citation7]. Therefore, thermal considerations and mitigation during IRE treatment is important to first avoid unwanted thermal damage and second reduce the electrical current and the risk of circuit damage. Some of the efforts in this direction include changing the protocol using shorter pulses or slowing the pulse delivery rate [Citation8] to reduce the amount of heat generation, or adopting techniques to absorb heat such as internal perfusion or using phase change material in the needle applicators [Citation9].
In this study, a comprehensive examination of IRE treatment with an internally perfused applicator is performed. The IRE treatments are performed on a previously validated perfused organ model [Citation6] and the outcomes are investigated in terms of ablation size, temperature, electrical current and generator failure.
Materials and methods
Numerical modeling was performed in parallel with experimental procedures to investigate the effects of active needle perfusion in liver tissue. The measured experimental data was fed into the numerical model, enabling the ability to capture what is physically happening, as well as predicting the occurrence of other aspects upon manipulation, which could then be tested further.
Numerical modeling of single insertion, bipolar applicators with and without internal cooling
A finite element model was generated and used to predict the electric field distribution in the tissue during treatment with single insertion bipolar applicator with and without internal cooling. The porcine liver tissue was modeled as an ellipsoid of dimensions 7.5 × 7.5 × 3.5 cm with liver tissue properties shown in . The cooled applicator model consisted of two hollow cylindrical stainless steel electrodes separated by a cylindrical insulating body between them. The uncooled applicator model was designed similarly but with solid cylindrical electrodes and an insulating body separating them. shows these points in detail. The numerical model was solved using a commercial finite element package (COMSOL Multiphysics, v.5.2; Stockholm, Sweden). The electric potential, at the end of a pulse was determined from EquationEquation (1)
(1)
(1) and the electric field,
from EquationEquation (2)
(2)
(2) .
(1)
(1)
(2)
(2)
Figure 1. Illustration the cooled and uncooled applicators and overview of the tetrahedral meshing of the model. The cooled applicator model includes a heat flux boundary condition placed on the inside of the hollowed out probe. The uncooled applicator does not include the heat flux boundary condition and is solid throughout.
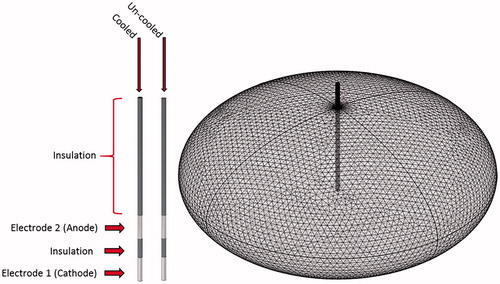
Table 1. Properties used within numerical model.
The electrical boundary condition along the tissue in contact with the source and sink was set to and
, respectively. The boundaries not in contact with an electrode were treated as electrically insulating. Prior studies by others [Citation11], have shown that the electric field evolution at the end of the first pulse can be accurately predicted when the electrical conductivity,
of the tissue is treated as dynamically changing with the electric field (due to electroporation-related effects). Thus, the sigmoidal conductivity versus electric field behavior, shown in EquationEquation (3)
(3)
(3) , was adapted from these findings [Citation11] and applied for all simulations presented within this work.
(3)
(3)
Here, is the baseline conductivity,
is the maximally permeabilized electrical conductivity,
and
are the empirically determined sigmoidal function parameters,
is the magnitude of the electric field vector, A and B are curve-fitting terms that depend on reversible electrical field threshold,
and IRE threshold,
(for eight pulses) and are given by
,
, where
= 460 V/cm and
= 700 V/cm for liver tissue. Parameters
and
were obtained by comparing the model current at the end of the first pulse to the recorded experimental values. The value of
was tested between physiologically relevant values of 0.05 and 0.12 S/m [Citation12] and
was tested between
and
, for a given value of
, as studies have shown that the maximum tissue conductivity change due to electroporation can be two to four times higher than the initial conductivity [Citation11,Citation13]. A comparison of the numerical model and actual experimental results for both the initial and final current was performed to determine a closeness of fit. The initial conductivity and max-conductivity were set to 0.12 and 0.42 S/m respectively to obtain the best possible fit. The model current was determined by integrating the normal current density over the sink electrode. Further, the root mean square error (RMSE) of the numerical and measured temperature trend over the 300 s treatment was determined for three different perfusion rates, illustrated within . details these comparisons.
Table 2. Comparison between the numerical model and actual experimental results for the initial and final current, as well as the root mean square error for the temperature trend throughout the 300 s treatment.
For consecutive pulses, studies on kidney tissue [Citation14,Citation15] have shown that the differential increase in the tissue conductivity at the end of each consecutive pulse is dominated by the temperature increase. To model the effect of multiple pulses, the static field was computed at the end of each consecutive pulse with the conductivity calculated using EquationEquation (4)(4)
(4) .
(4)
(4)
Here, is the thermal coefficient of conductivity, T the instantaneous temperature that was determined from the Bioheat equation (details below), and
the initial temperature of the tissue (26 °C, based off of measured results) [Citation11,Citation14].
Heating of the tissue during treatment was modeled using a modified Pennes’ bioheat equation that included a joule heating term. The modified equation is given in EquationEquation (4)
(4)
(4) .
(5)
(5)
where ρ is the density of the tissue,
is the specific heat of the tissue, k is the thermal conductivity,
is the blood perfusion,
is the blood density,
is the specific heat of the blood, and
is the perfusate temperature. The initial temperature of the electrodes and tissue were set to the tissue temperature of 26 °C for both the cooled and uncooled models. To simulate the effects of internal cooling, a heat flux boundary condition was applied to the inner core components of the cooled applicator. This is the primary difference between the cooled and uncooled models. A heat transfer coefficient of 30.01
was calculated and utilized within the model. The volumetric flow rate was calculated based on the flow rate of the internal cooling (35 ml/min), and the cross-sectional area of the perfusion inlet stream as shown in EquationEquation (6)
(6)
(6) . Then the Reynolds and Prandtl number were determined and applied to solve for the Nusselt number for turbulent flow within a pipe (Re > 4000) using EquationEquations (7)
(7)
(7) and Equation(8)
(8)
(8) . Lastly, the heat transfer coefficient was calculated using EquationEquation (9)
(9)
(9) . The coolant temperature was set to 28 °C within the model.
(6)
(6)
(7)
(7)
(8)
(8)
(9)
(9)
As proposed in prior studies [Citation14,Citation16], to significantly reduce the computation time, the Joule heating term was scaled according to the pulse on-time divided by the period between the pulses, which resulted in an average heating over the entire pulse duration. Further, the tissue boundaries were defined as adiabatic at the edge of the system domain to illustrate the maximum temperature increase within the tissue model. Finally, to predict thermal injury, the transient temperature field was applied to the thermal damage function. This function was derived from governing biochemical rate processes depicted in terms of an Arrhenius type relationship provided in EquationEquation (10)(10)
(10)
(10)
(10)
where Ω is defined as a non-dimensional damage parameter, ξ is described as the frequency factor (
), Ea as the activation energy (
), R is the universal gas constant, and T is the absolute temperature in Kelvin [Citation17,Citation18]. The total injury at any point within the targeted tissue can be obtained by integrating the damage rate function over the treatment period, as illustrated in EquationEquation (11)
(11)
(11) .
(11)
(11)
To better portray the effects of thermal damage, the numerically calculated thermal damage was converted into a thermal kill percentage and mapped across a 2 D geometry. EquationEquation (12)(12)
(12) defines the mathematical relationship between the thermal damage and the thermal kill percentage,
(12)
(12)
where TKP represents the thermal kill percentage, and
is the thermal damage as a function of time.
Perfused organ trials
Organ preparation
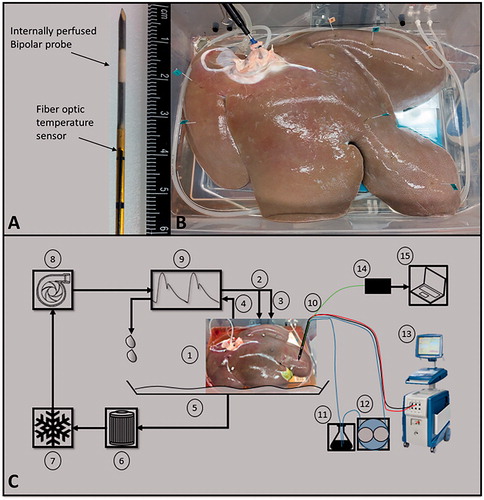
Porcine livers were procured from a local abattoir and immediately fitted with Luer–Lock connectors and flushed at a constant pressure of approximately 90 mmHg with 1 L of modified phosphate buffer solution (PBS) to mitigate potential thrombosis. Sucrose was added to the PBS (0.75 w/v) to reduce the solution conductivity in the range of physiologic blood, 0.85 S/m [Citation19]. Upon completion of the gravity flush, the tissue was then placed on ice until anastomosed to the normothermic organ preservation system (total time on ice no more than 120 min). The perfusate temperature was set and maintained at 30 °C using a heater/cooler system, providing a near physiologic temperature. Approximately 30–40 min (depending on tissue volume) were given to allow for the whole organ to warm as close to the set temperature as possible. After IRE treatments, organs were perfused on the system for an additional 90–120 min at hypothermic conditions, 4 °C, before sectioning/staining to allow for IRE changes to manifest, while also continuing to preserve the highly metabolic tissue. A total of nine livers were studied, with 8–10 treatments performed per liver. illustrates the perfused porcine liver on the organ preservation system, as well as all other external treatment and measurement systems. All animals were euthanized and handled in strict accordance with good animal practice as defined by the relevant national and local animal welfare bodies, and approved by Virginia Tech.
Figure 2. (A) An internally perfused bipolar applicator and the attached fiber optic temperature sensor. (B) A perfused porcine liver post treatment. Each treatment point was marked with stainless steel flags to serve as a guide during sectioning. (C) A representative schematic of the POM and pulse delivery system where, (1) perfused porcine liver, (2 and 3) hepatic artery and portal vein as inlets, (4) vena cava as outlet, (5) container, (6) filter, (7) heater/cooler system, (8) pump, (9) waveform generator, (10) IRE probe with fiber optic probe attached (shown as bipolar probe), (11) flask of deionized water, (12) peristaltic pump, (13) NanoKnife™ pulse generator, (14) fiber optic probe controller, (15) computer for temperature measurement acquisition. Overall, items 1–9 are integrated into the VasoWave™ organ preservation system, while items 10 and 13 are used for delivering IRE treatment, and 14, and 15 are for temperature measurement.
Electroporation pulse delivery
All IRE treatments were performed using the perfused organ model. About 8–10 treatments were delivered per liver using a single-insertion bipolar applicator constructed with internal channels that permit internal cooling [Citation7,Citation20]. Two separate sets of experiments were performed to determine the significance of internal electrode cooling under various pulse delivery schemes. The first was a direct comparison of the cooled and uncooled applicator using a constant voltage delivery. The second set of experiments incorporated a pre-conditioning process, which involved steadily increasing the voltage amplitude from 2700 V to the desired final voltage of 3000 V. It was hypothesized that this pre-conditioned method would aid in creating larger zones of treatment effects. Further, this second set of experiments included an arc-mitigation suite to facilitate treatment continuation in the events of high current, as described below ().
Table 3. Summary of the treatment parameters for the study of internal electrode cooling on electrical current, temperature, and treatment zone size.
Constant voltage delivery
A single-insertion bipolar applicator with the capacity for internal cooling was used to deliver pulsed electric fields. A BTX electroporation generator (Harvard Apparatus, Holliston, MA, USA) was set to deliver 300 pulses at a constant amplitude of 2700 V. The pulse frequency was set to 90 pulses per minute, and the pulse width to 100 µs. An oscilloscope (DPO2002B; Tektronix Inc., Beaverton, OR, USA) was used to view the output waveforms using a 50 MHz 1000 × high voltage probe (P5210A; Tektronix) and the current was measured using a 50 MHz current probe (TCP305; Tektronix). For this study, two livers were tested, with eight treatment regions per liver. Half of the treatment regions were created using internal electrode cooling, while the other half were not internally cooled (n = 8 for each subgroup). Deionized (DI) water at room temperature acted as the coolant for these experiments and was perfused as a rate of 35 ml/min using a peristaltic pump (AngioDynamics Inc., Latham, NY, USA). A fiber optic temperature sensor (Luxtron m3300; LumaSense, Santa Clara, CA, USA) was attached to the bipolar applicator 4 mm above the proximal electrode and the tissue temperature was measured during treatment at a rate of one sample per second (). Temperature data was plotted over time to illustrate that the cooled applicators maintained lower temperatures throughout treatment. Additionally, the measured current (first pulse and last pulse), initial and final temperatures, and ablation volume sizes across the long and short axes were all evaluated and compared for cooled and un-cooled scenarios.
Preconditioned voltage delivery and automated arc-mitigation algorithm
This study also utilized the internally cooled single-insertion bipolar applicator to deliver pulsed electric fields. A NanoKnife™ electroporation generator (AngioDynamics Inc., Latham, NY, USA) was set to deliver 400 pulses using a ‘pre-conditioning’ paradigm, where therapy was administered in a ramped amplitude sequence extending from 2700 to 3000 V. The pulse frequency was set to 90 pulses per minute and the pulse width to 100 µs. Once the treatment was initiated, the NanoKnife™ delivered the set pulse parameters. If three consecutive arcs were encountered at any point within the 400 pulse protocol, the generator autonomously reduced its amplitude by adjusting the voltage or pulse-width in a fixed manner and continued treatment. A total of seven livers were tested, treating 8–10 regions per liver; 39 zones of treatment were generated with internal electrode cooling and 21 treatment regions were generated without internal electrode cooling. DI water acted as the coolant for these experiments and was perfused as a rate of 35 ml/min using an AngioDynamic peristaltic pump (AngioDynamics Inc., Latham, NY, USA). The voltage administered and corresponding current measured during treatments were averaged and plotted as a function of time to visualize the effects of the pre-conditioning paradigm, as well as the arc-mitigation algorithm. The power was also calculated and plotted over time. A fiber optic temperature sensor was attached to the bipolar applicator 4 mm above the proximal electrode and the tissue temperature was measured during treatment at a rate of one sample per second (). Further, the measured current (first pulse and last pulse), initial and final temperatures, and ablation volume sizes across the long and short axes were all evaluated and compared for cooled and un-cooled scenarios. Lastly, the total amount of current and energy delivered to the tissue was evaluated by calculating the area beneath the curve.
Morphologic analysis
Sectioning was performed 90–120 min after the last ablation performed to allow for IRE changes to manifest (as previously demonstrated) [Citation21]. The tissue was sectioned and sliced through the mid-plane of the treatment regions for gross evaluation. These sections were stained with TTC (MP Biomedicals, LLC Santa Ana, CA, USA) in PBS (15 gr/L) for 5–10 min without light exposure. Following staining, the treatment zones were photographed and measured along the long and short axis to determine the overall volume of the treatment region. Samples were fixed in formalin overnight and measured once more 12 h later. No statistical difference in ablation size was found when comparing the long and short axis measurements pre- and post-formalin. Thus, the post formalin measurements were used to represent ablation size throughout the manuscript.
Results
Numerical model validation
shows the numerical results for the comparison of an internally cooled and un-cooled applicator model at the end of an IRE treatment. The internally cooled and un-cooled models have a similar electric field distribution (). Conversely, the temperature distribution and thermal damage zone is greater for the uncooled model (), although notably both remain well below the temperature thresholds for protein denaturation of ∼70 °C. illustrates temperature as a function of time for both the model and experimental results measured approximately 4 mm above the proximal electrode for three different perfusion rates (,
, and
[1/s]). provides a comparison of initial current, final current, and the RMSE of temperature as a function of time between the numerical model and the experimentally measured results. The calculated RMSE between the numerical and measured transient temperature data was least for the perfusion rate of 3.575e−3 [1/s]. Further, the numerical simulation at this perfusion rate provided both an initial and final current within one standard deviation of the measured results indicating an acceptable fit between the model and measured results.
Figure 3. The (A, D) electrical field [V/cm], (B, E) temperature distribution [°C], and (C, F) thermal damage [%] for an IRE treatment in liver with solid un-cooled bipolar electrodes (top), and internally cooled bipolar electrodes at 26 °C (bottom). The results are shown in the z–x plane after 300 pulses were applied at 2700 V and a pulse with of 100 μs. The electrode exposure and spacing was 1 cm and 0.8 cm, respectively.
![Figure 3. The (A, D) electrical field [V/cm], (B, E) temperature distribution [°C], and (C, F) thermal damage [%] for an IRE treatment in liver with solid un-cooled bipolar electrodes (top), and internally cooled bipolar electrodes at 26 °C (bottom). The results are shown in the z–x plane after 300 pulses were applied at 2700 V and a pulse with of 100 μs. The electrode exposure and spacing was 1 cm and 0.8 cm, respectively.](/cms/asset/85629e64-d723-47d6-bc43-6f68466f28d1/ihyt_a_1473893_f0003_c.jpg)
Figure 4. Illustrates the average measured thermal disparity (n = 5) for the cooled and un-cooled applicators over the course of treatment and compares to the numerically calculated temperature sequence for the same treatment protocol. Three different values of perfusion were modeled and the RMSE was taken to help quantify a closeness of fit between the measured and modeled results. (A) Shows perfusion at a physiologic level, ωb = 7.15e−3[1/s], and which illustrated an under-estimation of the measured temperature trend (. (B) Perfusion at 50% of the physiologic level, ωb = 3.575e−3 [1/s], and results in a close approximation
. (C) Shows perfusion at 20% of the physiologic level, ωb = 1.43e−3 [1/s], and provided an over-estimation of the temperature trend
. Interestingly, varying the perfusion within the numerical model had little effect on the cooled applicator scenario.
![Figure 4. Illustrates the average measured thermal disparity (n = 5) for the cooled and un-cooled applicators over the course of treatment and compares to the numerically calculated temperature sequence for the same treatment protocol. Three different values of perfusion were modeled and the RMSE was taken to help quantify a closeness of fit between the measured and modeled results. (A) Shows perfusion at a physiologic level, ωb = 7.15e−3[1/s], and which illustrated an under-estimation of the measured temperature trend (RMSEcooled=2.15 °C,RMSEuncooled=1.6 °C). (B) Perfusion at 50% of the physiologic level, ωb = 3.575e−3 [1/s], and results in a close approximation (RMSEcooled=2.3 °C,RMSEuncooled=0.88 °C). (C) Shows perfusion at 20% of the physiologic level, ωb = 1.43e−3 [1/s], and provided an over-estimation of the temperature trend (RMSEcooled=2.5 °C, RMSEuncooled=1.74 °C). Interestingly, varying the perfusion within the numerical model had little effect on the cooled applicator scenario.](/cms/asset/89b21d76-5f9e-497a-8ac0-f017ddf4216c/ihyt_a_1473893_f0004_c.jpg)
Active cooling effects at constant voltage
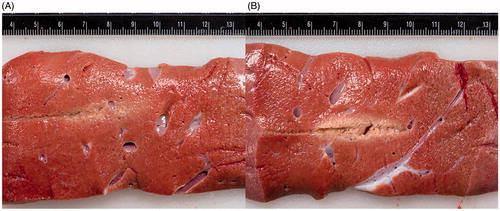
shows the comparison between the temperatures at the point of measurement (approximately 4 mm above the proximal electrode) for the internally cooled applicator and the un-cooled applicator. The experimental data are presented as an average of n = 5 trials. The internally cooled applicator operates at a significantly lower temperature (than the uncooled) during the treatment, reaching a maximum of 33.01 ± 1.7 °C. The un-cooled applicator reached a maximum temperature of 42.43 ± 3.1 °C (). shows the treatment zones for both a cooled and un-cooled applicator. Although we observe some coagulation of tissue (particularly for the non-cooled applicator), this amount of tissue change (which does not represent coagulation of every protein) did not sufficiently change the tissue properties to alter our tight correlation between modeling and experimentally obtained results. Thermally damaged regions were identified by the pale discoloration observed grossly [Citation7], indicating regions of intracellular thermal damage [Citation22], which is relatively safe for the ductal/tissue structures to remain functional (vessels, bile duct, etc.). While both illustrate zones of thermal damage, the uncooled applicator produced a much more defined and larger thermally affected region relative to the cooled applicator.
Figure 5. A comparison of gross pathology of treatment zones using (A) an internally cooled bipolar applicator and (B) an un-cooled applicator during the same IRE treatment protocol. clearly presents a centrally located white coagulated region as a result of thermal damage to the tissue, while shows much less thermally damaged tissue. Both images were taken prior the use of any staining.
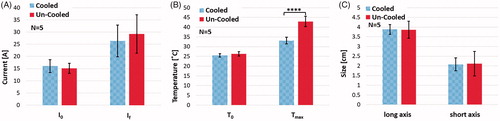
The outcomes of applicator cooling in constant voltage experiments are summarized in for electrical current, temperature and ablation size. The final electrical currents are 26.32 ± 6.54 A for the cooled applicator and 29.20 ± 7.91 A for the un-cooled applicator, as shown in (. Comparison of the final temperatures () also show a statistically significant warmer tissue in the case of no cooling (
). Despite the differences in the electrical current and tissue temperature near the treated region, no significant difference was observed in the produced treatment zone sizes using cooled and un-cooled applicators as shown in . The cooled applicator yielded an average treatment zone size of 3.88 ± 0.25 cm by 2.08 ± 0.33 cm, while the uncooled applicator generated zones of treatment with the dimensions of 3.86 ± 0.44 cm by 2.12 ± 0.63 cm (
, width
).
Figure 6. The effect of internal electrode cooling for fixed-amplitude IRE treatments. (A) A comparison of the initial and final electrical current measurements for cooled and un-cooled applicator designs shows an overall increase in current throughout treatment. Focusing on the final current measurement taken after the last pulse of treatment, the internally cooled applicator generated 26.32 ± 6.54 A, while the un-cooled generated 29.20 ± 7.91 A on average. (B) Initial and final temperature measurements were also compared to show the overall increase in tissue temperature throughout the treatments. The final temperature measurement differed by between the cooled and un-cooled applicator by 9.42 ± 1.4 °C (cooled 33.01 ± 1.7 °C, un-cooled 42.43 ± 3.1 °C) (). (C) Both the long and short axes were measured and compared for the cooled and un-cooled applicators, generating an average treatment zone size of 3.88 ± 0.25 cm by 2.08 ± 0.33 cm for the cooled applicator and a 3.86 ± 0.44 cm by 2.12 ± 0.63 cm treatment zone for the uncooled applicator.
Active cooling effects when employing arc-mitigation algorithm
To more clearly illustrate the step down method and indicate where step-downs occur for a specific treatment, a plot of the voltage and current output from the NanoKnife generator post treatment was generated (). This plot highlights the time at which point the arc-mitigation algorithm was implemented during this specific treatment. illustrates the average voltage, current and power for all cooled and un-cooled treatments when employing the arc mitigation algorithm. The administrated voltage is increased in four steps from 2700 to 3000 V. The arc mitigation algorithm acts in the occasion of arcing and reduces the voltage amplitude or pulse width.
Figure 7. This plot illustrates the measured voltage and current for a specific un-cooled treatment. The arrow denotes where the voltage was stepped down from 3000 to 2900 V, approximately 150 s into the treatment.
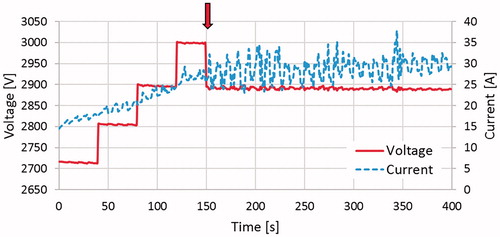
Figure 8. Comparison of average (a) voltage amplitude, (b) electric current, and (c) delivered electric power during the treatments with cooled and un-cooled bipolar applicators. Upon reaching the target amplitude of 3000 V, the un-cooled applicators showed an immediate declination in voltage amplitude, descending to 2900 V only 100 pulses later and finishing at 2834 V due to electrical arching. The internally cooled electrical applicators maintained the target amplitude of 3000 V for a while longer before experiencing more significant arching, and eventually finishing at 2880 V. In response to the arc-mitigation software, the average electrical current and power generated are maintained at a suitable level, though the internally cooled applicators consistently showed less current and power, while still delivering pulsed electric fields at a higher voltage.
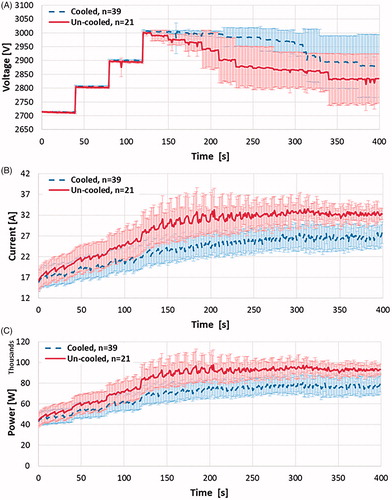
It is shown that during the treatment with un-cooled applicators voltage amplitude decreased much more in comparison to the cooled applicators, on average (). Further, while maintaining a higher voltage amplitude, the internally cooled applicators showed a reduction in the current and power delivered to the tissue ().
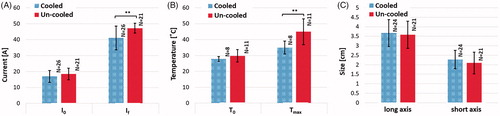
The outcomes of applicator cooling in arc mitigation experiments are summarized in for electrical current, temperature and ablation size. Internal cooling of the applicator reduced the temperature at the vicinity of the charged electrodes and thus lessened the thermally induced rise in electric current during pulse delivery (). The experimental data shows a significantly lower electrical current and tissue temperature ( respectively), while the long and short axis treatment zone measurements, although not statistically significant, showed a 2.5% and 8% increase in zone of treatment effect, respectively, for the internally cooled applicator (). This outcome is in agreement with the higher voltage during the cooled experiments which also results in a higher electric field distribution in the tissue.
Figure 9. The effect of internal electrode cooling for ramped-amplitude IRE treatments using the NanoKnife™ arc-mitigation system. (a) A comparison of the initial and final electrical current measurements for cooled and un-cooled applicator designs, shows an overall increase in current throughout treatment. Focusing on the final current measurement taken after the last pulse of treatment, the internally cooled applicator generated 41.07 ± 7.48 A, while the un-cooled applicator generated 47.20 ± 3.12 A on average (). (b) Initial and final temperature measurements were also compared to show the overall increase in tissue temperature throughout the treatments. The final temperature measurement differed between the cooled and un-cooled applicator by 9.97 ± 3.98 °C (cooled 34.93 ± 4.06 °C, un-cooled 44.9 ± 8.04 °C) (
). (c) The average treatment zone dimensions were 3.67 ± 0.71 cm by 2.27 ± 0.48 cm for the cooled applicator and 3.58 ± 0.72 cm by 2.09 ± 0.57 cm for the uncooled applicator.
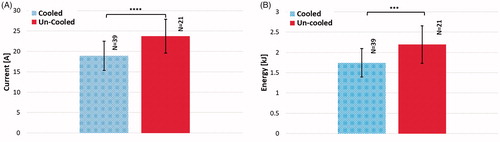
shows the overall electrical current generated and total energy delivered at these prescribed pulse parameters with a cooled and un-cooled applicator. The electrical current generated was 23.76 ± 4.17 A and 18.93 ± 3.58 A for an un-cooled and cooled applicator respectively, (). The total energy delivered was derived by calculating the average of the integral (area under the curve) for the voltage and current over time for each treatment output by the Nanoknife generator. These average values were then multiplied to calculate the average total energy experienced by the tissue. The resulting energy delivered was 2.19 ± 0.46 kJ and 1.74 ± 0.35 kJ for an un-cooled and cooled applicator respectively (
).
Figure 10. Comparison of (A) average current and (B) average delivered energy during treatments with cooled and un-cooled applicators (,
).
Discussion
In this study, the effects of internally cooled electrodes on treatment zone size, temperature, and current draw were investigated. The ability to produce large IRE treatment volumes (>3 cm diameter), using single bipolar applicator and the commercially available generators, is difficult due to the high likelihood of electrical arcing. Due to the risks of thermal damage and thermally induced electric current rises increasing electric arching risk during therapy, thermal mitigation strategies may improve IRE therapies. Such mitigation strategies include: pre-cooling/heating the tissue prior to treatment, monitoring current and temperature rise, the use of phase change materials, and strategic pulsing paradigms [Citation7,Citation23–25]. However, active internal cooling is a preeminent approach that could have major impact IRE therapy. Internal electrode cooling was previously described for a single-insertion, bipolar application [Citation7]. The bipolar applicator contained both the source and sink electrodes on a single needle separated by a non-conductive spacer (0.8 cm in length). Our studies indicate that internal cooling reduced overall spikes in the delivered current and subsequent generator crashes, while producing similar treatment zone sizes to non-cooled applicators. Another strategy investigated was the maintenance of the current amplitude below a critical threshold of 50 A by appropriately adjusting the voltage and pulse-width in a fixed manner. Should the current exceed the set threshold, the voltage generator autonomously ‘stepped-down’ the voltage or pulse-width to systematically reduce the current amplitude. This mitigation strategy was primarily designed to control the current, but also helps to reduce undesirable tissue heating.
The desirable effects of IRE treatments are not dependent on thermal events, but thermal damage can still occur due to Joule heating. The combination of a thermally mitigating applicator and an arc-mitigating algorithm could improve IRE treatment by limiting thermal tissue damage, preventing generator crashes, and enhancing electrical energy delivery to the tissue.
This study demonstrated that the use of internally cooled electrodes can reduce the effects of Joule heating while effectively maintaining IRE treatment zones of similar dimensions to those administered traditionally (non-cooled) at the same pulse parameters. We have verified the effects of using an actively cooled applicator on electrical current, tissue temperature, and tissue treatment zone size for two different pulse generators and several treatment schemes. The first treatment protocol incorporated a constant voltage delivery, while the second treatment protocol incorporated a pre-conditioning ramped voltage delivery and an autonomous arc-mitigation algorithm specifically designed for the IRE system used. While the treatment zone dimensions were not significantly different statistically, the internally cooled applicator showed larger treatment zone sizes on average than the uncooled applicator. Further, both delivery methods demonstrated that internal electrode cooling allows for energy delivery at a lower electrical current, a reduced thermal imprint, and potentially creating a more replete IRE treatment.
Finite element analysis provided insight into the effects of internal cooling on the electric field, temperature distribution, and thermal injury distribution. More specifically, it was found that in an idealistic setting, the thermal ablation zone for the uncooled applicator could reach up to a size of 1 cm by 3 cm using the pulse parameters previously described, while the cooled applicator showed little to no thermal damage.
Though, this work was not without limitations. The numerical models included in this work simulated both solid and internally perfused single-needle, dual-electrode applicators within liver tissue. The model illustrated throughout this work defines tissue perfusion as a constant value. Though it is well known that tissue mediated cooling plays a dynamic role throughout treatment, it is still unclear at what capacity while using this perfused organ model. Additional parameters will need to be studied in the future. A more representative model might express perfusion as a function of electroporation, heating, and thermal damage [Citation26–28]. Another limitation of this work is that it was only performed on explanted, actively perfused porcine liver tissue and the thermal response for these mitigation strategies should be verified for other tissue types. Further, all liver tissue used was from healthy animals and the presence of significant liver pathology (e.g. steatohepatitis, cirrhosis, or tumors) may alter IRE effects. We also appreciate that the additional pumping system needed for operation of internally cooled applicator could potentially add more intricacy to the procedure in clinical setting. Thus, work should be performed to test alternative methods that reduce thermal damage, current rise, as well as treatment protocol complexity. Future thermal mitigation studies may investigate the use of varied pulse timing paradigms for multiple monopolar applicator conditions, the use of phase change materials or a combination of the like.
In conclusion, this study tested the effects of using an actively cooled applicator on electrical current, tissue temperature, and tissue treatment zone size for both a constant voltage delivery and a pre-conditioned voltage delivery system, including an arc-mitigating ‘step-down’ sequence. This work successfully shows that internal electrode cooling reduces both the electrical current draw and tissue temperature while maintaining similar treatment zone sizes to non-cooled electrodes throughout IRE therapy in an ex vivo perfused porcine liver model. Internal cooling may hold promise for enhancing the efficacy of IRE application in clinical practice. In addition to reducing tissue temperatures by nearly 10 °C, the bipolar applicator reduces the complication of a multi-applicator procedure, while effectively maintaining significant zone of treatment size and enabling the potential to perform laparoscopic IRE surgery. This technology could lead to better overall outcomes for patients.
Disclosure statement
Robert E. Neal II, Rafael V. Davalos, John L. Robertson, Charles H. Aardema Jr., and Mohammd Bonakdar all have pending and issued patents in the area of irreversible electroporation and may receive royalties. Robert E. Neal II is an employee of Angiodynamics (Marlborough, MA). Further, S. Nahum Goldberg is a consultant to Angiodynamics (Marlborough, MA), Cosman Company (Cambridge, MA), and XACT Robotics (Caesaria, Israel).
Additional information
Funding
References
- Davalos RV, Mir LM, Rubinsky B. Tissue ablation with irreversible electroporation. Ann Biomed Eng. 2005;33:223–231.
- Al-Sakere B, André F, Bernat C, et al. Tumor ablation with irreversible electroporation. PLoS One. 2007;2:1–8.
- Weaver JC. Electroporation: a general phenomenon for manipulating cells and tissues. J Cell Biochem. 1993;51:426–435.
- Siegel RL, Miller KD, Jemal A. Cancer statistics. CA Cancer J Clin. 2016;66:7–30.
- Davalos RV, Rubinsky B. Temperature considerations during irreversible electroporation. Int J Heat Mass Transf. 2008;51:5617–5622.
- Bhonsle S, Bonakdar M, Neal RE, et al. Characterization of irreversible electroporation ablation with a validated perfused organ model. J Vasc Interv Radiol. 2016;27:1913–1922.e2.
- Wandel A, Ben-David E, Ulusoy BS, et al. Optimizing irreversible electroporation ablation with a bipolar electrode. J Vasc Interv Radiol. 2016;27:1441–1450.e2.
- Jiang C, Shao Q, Bischof J. Pulse timing during irreversible electroporation achieves enhanced destruction in a hindlimb model of cancer. Ann Biomed Eng. 2015;43:887–895.
- Arena CB, Mahajan RL, Rylander MN, et al. Phase change electrodes for reducing Joule heating during irreversible electroporation. 2012;(44809):473–474.
- Hasgall P, Di Gennaro F, Baumgartner C, et al. IT’IS Database for thermal and electromagnetic parameters of biological tissues, Version 3.0. 2015. [Online]. Available from: www.itis.ethz.ch/database
- SelCukjati D, Batiuskaite D, Slivnik DT, et al. Sequential finite element model of tissue electropermeabilisation. 26th Annu Int Conf IEEE Eng Med Biol Soc. 2004;4:3551–3554.
- Gabriel C, Peyman a, Grant EH. Electrical conductivity of tissue at frequencies below 1 MHz. Phys Med Biol. 2009;54:4863–4878.
- Ivorra A, Al-Sakere B, Rubinsky B, et al. In vivo electrical conductivity measurements during and after tumor electroporation: conductivity changes reflect the treatment outcome. Phys Med Biol. 2009;54:5949–5963.
- Neal RE, Garcia PA, Robertson JL, et al. Experimental characterization and numerical modeling of tissue electrical conductivity during pulsed electric fields for irreversible electroporation treatment planning. IEEE Trans Biomed Eng. 2012;59:1076–1085.
- Neal RE, Garcia PA, Kavnoudias H, et al. In vivo irreversible electroporation kidney ablation: Experimentally correlated numerical models. IEEE Trans Biomed Eng. 2015;62:561–569.
- Arena CB, Sano MB, Rossmeisl JH, et al. High-frequency irreversible electroporation (H-FIRE) for non-thermal ablation without muscle contraction. Biomed Eng Online. 2011;10:102.
- Chang IA, Nguyen UD. Thermal modeling of lesion growth with radiofrequency ablation devices. Biomed Eng Online. 2004;3:27.
- Kim B-, Jacques M, Rastegar S, Thomsen SS, Motamedi M. The role of dynamic changes in blood perfusion and optical properties in thermal coagulation of the prostate. IEEE J Sel Top Quantum Electron. 1996;2391:443–450.
- Gabriel C. Compilation of the dielectric properties of body tissues at RF and microwave frequencies. Environ Heal. 1993;AFOSR-TR96:271.
- Bhonsle SP, Arena CB, Sweeney DC, et al. Mitigation of impedance changes due to electroporation therapy using bursts of high-frequency bipolar pulses. Biomed Eng Online. 2015;14(Suppl 3):S3.
- Lee EW, Chen C, Prieto VE, et al. Advanced hepatic ablation technique for creating complete cell death: irreversible electroporation. Radiology. 2010;255:426–433.
- Thomsen S, Pearce JA. Thermal damage and rate processes in biologic tissues. In: Welch AJ and van Gemert MJC, editors. Optical-thermal response of laser-irradiated tissue. Dordrecht: Springer Netherlands; 2011. p. 487–549.
- Daniels CS, Rubinsky B. Temperature modulation of electric fields in biological matter. PLoS One 2011;6:1–9.
- Arena CB, Mahajan RL, Rylander MN, et al. Towards the development of latent heat storage electrodes for electroporation-based therapies. Appl Phys Lett. 2012;101:1–5.
- Arena CB, Mahajan RL, Nichole Rylander M, et al. An experimental and numerical investigation of phase change electrodes for therapeutic irreversible electroporation. J Biomech Eng. 2013;135:111009.
- Kos B, Voigt P, Miklavcic D, et al. Careful treatment planning enables safe ablation of liver tumors adjacent to major blood vessels by percutaneous irreversible electroporation (IRE). Radiol Oncol. 2015;49:234–241.
- Jarm T, Cemazar M, Miklavcic D, et al. Antivascular effects of electrochemotherapy: implications in treatment of bleeding metastases. Expert Rev Anticancer Ther. 2010;10:729–746.
- Haemmerich D, Wood BJ. Hepatic radiofrequency ablation at low frequencies preferentially heats tumour tissue. Int J Hyperthermia. 2006;22:563–574.