
 ?Mathematical formulae have been encoded as MathML and are displayed in this HTML version using MathJax in order to improve their display. Uncheck the box to turn MathJax off. This feature requires Javascript. Click on a formula to zoom.
Abstract
Complete ablation of liver tumors is vital for minimizing the risk of local tumor recurrence. Accurately identifying the hallmarks of tissue necrosis during thermal ablative therapies may significantly increase the efficacy of ablation, while minimizing unnecessary damage to the surrounding normal tissues or critical structures. Light propagation in biological tissues is sensitive to the tissue microstructure and chromophore concentrations. In our previous studies, we found that the wavelength (λ) averaged liver tissue absorption coefficient (µa) and reduced scattering coefficient (µs′) change significantly upon heating which may be used for assessment of tissue damage during thermal ablation of solid tumors. Here, we seek to demonstrate the use of an integrated fiber-optic probe for continuous monitoring of the local tissue temperature (T), µa(λ) and µs′(λ) during thermal ablation of ex vivo porcine livers. The wavelength-averaged (435–630 nm) tissue absorption and scattering (µa and µs′ ) increased rapidly at 45 °C and plateaued at 67 °C. The mean µa and µs′ for liver tissue at 37 °C (n = 10) were 8.5 ± 3.7 and 2.8 ± 1.1 cm−1, respectively. The relative changes in µa and µs′ at 37, 55, and 65 °C were significantly different (p < .02) from each other. A relationship between the relative changes in µa and µs′ and the degree of tissue damage estimated using the temperature-based Arrhenius model for porcine liver tissues was established and studied.
Introduction
Hepatocellular carcinoma (HCC) is the sixth most common cancer and the third most common cause of cancer-related deaths worldwide. In 2012, 782,000 new cases and 745,000 deaths related to HCC were reported worldwide [Citation1]. HCC is also the fastest growing cause of cancer-related deaths in the USA [Citation2]. Surgical resection and/or liver transplantation are the only options for curative intent; however, less than 20% of patients with HCC are candidates for surgery [Citation3]. Percutaneous ablative therapies, such as radiofrequency ablation (RFA) and microwave ablation (MWA), are considered as an alternative treatment for unresectable early stage HCC [Citation4]. To be considered a desirable alternative, outcomes should be comparable to those achieved with surgical resection. However, the reported rate of complete response after a single session of RFA of HCC varies from 48% to 97% [Citation5–11]. Similarly, the rate of complete response for MWA ranges from 69% to 100%, depending on tumor size [Citation12].
The risk of local tumor recurrence after RFA or MWA therapy depends on the extent of thermal damage, which is often affected by the size and location of the tumor(s), adjacent structures, ablation technique used, and availability and effectiveness of intra-operative monitoring. The extent of thermal tissue damage is a function of the temperature and duration of heating to the tissue. Ideally, assessment of tissue damage should be done in real-time to avoid under or over treatment of the target tissue. Real-time monitoring is critical to regulate the ablation zone, in order to minimize heat exposure to surrounding critical structures (blood vessels, bile ducts, nerves, etc.). Histological assessment is the current gold standard for assessing thermal tissue damage, but is not a practical or generalizable way to monitor ablation zones. Therefore, real-time monitoring of tissue during thermal ablation is critical to ensure complete destruction of tumor mass while avoiding tissue charring and excessive damage to surrounding normal tissues.
Temperature-based methods, such as the Arrhenius model [Citation13,Citation14], are commonly used to assess thermal tissue damage in real-time during tumor ablation [Citation15–17]. However, temperature-based methods do not account for tissue heterogeneity, and require prior knowledge of tissue properties to determine the extent of thermal damage. Light propagation within a biological tissue is sensitive to the tissue morphology and physiology. Specifically, quantitative optical spectroscopy can determine the optical properties of normal vs. coagulated tissue, with higher µa(λ) and µs′(λ) seen in coagulated tissues [Citation18–20]. Although changes in tissue optical properties are due to denaturation, the correlation between tissue absorption and reduced scattering coefficient and true tissue damage are yet to be established. Quantitative optical spectroscopy could therefore be performed to predict complete tissue ablation.
In our previous study [Citation13,Citation18], we have shown that µa and µs′ in porcine muscle tissues measured by diffuse reflectance spectroscopy (DRS), at selected temperature points, correlated with the degree of denaturation (Fd) derived from the Arrhenius damage model. In addition, we determined that continuous monitoring of µa and µs′ is necessary to achieve the endpoint for ablation. In this paper, we report the use of a DRS system with an integrated fiber-optic temperature sensor to continuously record the µa, µs′ and local tissue temperature during heating of ex vivo liver and compare the changes in tissue optical properties with Fd.
Materials and methods
DRS instrument
The integrated DRS system, as illustrated in , consists of a home-made needle-based fiber-optic probe, two visible spectrometers (Avantes BV, The Netherland) with a white light-emitting diode (LED), one near-infrared (NIR) spectrometer with an 820 nm LED and a laptop computer loaded with custom software. The fiber-optic probe includes two side-firing fibers (200/220 µm), spaced apart by 1 mm for DRS, a homemade extrinsic Fabry–Perot interferometric (EFPI) temperature sensor [Citation21] and two forward firing fibers (200/220 µm) for self-calibration [Citation22,Citation23], all housed into a 17G hypodermic needle. One of the two side-firing fibers is connected to the white LED to illuminate the target tissue and the other to the visible spectrometer A (Vis Spec A) for detection of diffuse reflectance from the tissue. The self-calibration fibers, as shown in , loop the light from the white LED back to visible spectrometer B (Vis Spec B) before it reaches the tissue using a diffusely reflective medium. The self-calibration records a calibration spectrum in concurrent with DRS measurement which is used to correct for instrument fluctuations and probe bending loss [Citation22,Citation23].
Figure 1. Schematics of the experimental setup: (a) the integrated DRS system and experiment setup for measuring the local optical properties and temperature of porcine liver tissues during heating; (b) the self-calibration channel and (c) the EFPI temperature sensor.
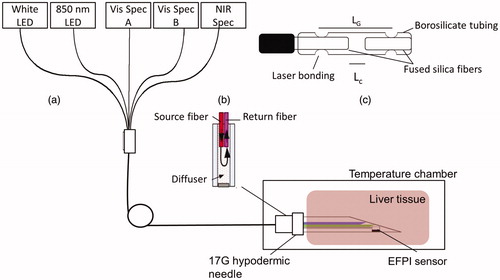
The EFPI sensor head was fabricated by laser fusion bonding of two multimode fibers, separated by a small air gap (Lc), to a borosilicate capillary tube with an outer diameter of 400 μm (). The distance between the two bonding points, the gage length (LG), is 2.0 mm. The EFPI sensor head is connected to the sensing arm of a 2 × 2 50/50 fiber-optic coupler. The 820 nm LED was used to interrogate the EFPI sensor and the returned interferogram was collected by the NIR spectrometer (NIR Spec). Thermal expansion of the borosilicate tubing alters the optical path difference between the two interfering waves that are reflected by the end-faces of the two fiber tips, shifting the peak positions of the interferogram. The temperature is determined by tracking the temperature-dependent wavelength shift in the interferogram [Citation23]. The temperature sensor was calibrated in a water bath and was found to have an accuracy of 1 °C between 20 and 95 °C. A laptop computer with a custom LabVIEW program and embedded MATLAB scripts was used for instrument control and data acquisition and analysis.
Phantom experiment
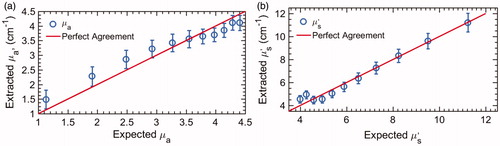
Tissue-mimicking phantoms consisting of a mixture of human hemoglobin powder (H0267, Sigma-Aldrich Co. LLC, St. Louis, USA), as the absorber, and 1-µm polystyrene beads (07310-15, Polysciences Inc., Warrington, USA) as the tissue scatterer, was used for evaluating the probe performance and instrument calibration [Citation24]. Eleven phantoms covering a hemoglobin concentration of 14–54.9 µM, in water were created by fixing the number of scatterers and titrating the absorbers. The absorption coefficient µa(λ) of stock hemoglobin solution was independently determined with a spectrophotometer (Lambda 35, PerkinElmer Inc., Waltham, USA). For all phantoms, the µa ranged from 1.2 to 4.9 cm−1. The reduced scattering µs′(λ) of the phantoms was calculated using the Mie theory for known size, density and refractive index of scatterers. The µs′ decreased from 11.4 to 4 cm−1 due to titration, representing the typical scattering properties of native and coagulated liver tissues. Diffuse reflectance spectra (435–630 nm) for each of the 11 phantoms were collected using the DRS instrument.
Tissue sample preparation
Fresh porcine livers from three healthy pigs were obtained less than 2 min post-slaughtering from a local slaughterhouse and transported to the laboratory in an iced physiological saline solution. The average transport time was about 30 min. Upon arrival, the liver tissues were stored in a saline solution at 4 °C until use. Liver tissues were used within 1–2 days of purchase. A total of 10 liver samples were used, each of which was cut to ∼20 × 20 × 18 mm tissue blocks.
Measurement and data analysis
The needle probe was placed at the center of each tissue sample, as illustrated in , and the sample was heated for 30 min in a temperature chamber (Tenny Jr, Thermal Product Solutions, White Deer, Pennsylvania, USA) that was preheated to 100 °C. Diffuse reflectance spectra and T of the ex vivo tissues were continuously recorded during heating. In addition, for each DRS measurement, a concurrent self-calibration spectrum was recorded. Each tissue spectrum was divided by the calibration spectrum to obtain a normalized spectrum. The µa(λ) and µs′(λ) were extracted from the normalized DRS spectrum using the reference phantom spectrum and an inverse Monte-Carlo method for diffuse reflectance [Citation25]. The tissue damage index Fd was calculated using an activation energy (Ea) of 66.18 Kcal/mol, a pre-exponential factor (A) of 5.51 × 1041 s−1 [Citation26] for liver, and EquationEquations (1)(1)
(1) and Equation(2)
(2)
(2) [Citation13,Citation14].
(1)
(1)
(2)
(2)
where Fd = 1 signifies complete tissue denaturation, whereas, Fd = 0 indicates no thermal denaturation, or native tissue.
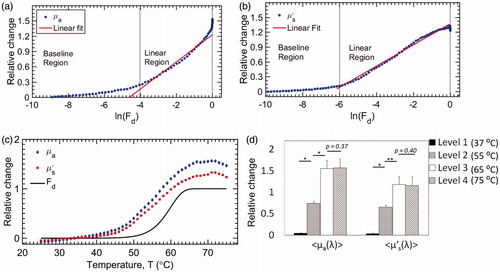
The liver tissue µa and µs′ observed between 20 °C (room temperature) and 37 °C were averaged to obtain a baseline measurement. The relative changes in µa and µs′ (), from the baseline measurements (native tissues), at 37 °C (level 1), 55 °C (level 2), 65 °C (level 3) and 75 °C (level 4) were statistically compared with the calculated Fd at the corresponding T using a paired t-test. Also, the relationship between the relative changes in µa and µs′ and Fd have been established and studied. Pearson’s correlation was used to compare relative changes in µa and µs′ to Fd.
Results
Phantom experiment
The µa(λ) and µs′ (λ) of the 11 phantoms were extracted using the inverse Monte-Carlo model, and the wavelength-averaged values (µa and µs′) are plotted against the expected values in , respectively. The overall errors for extracting µa and µs′ the tissue-mimicking phantoms were 10.2% and 6.7%, respectively. Error bars in all the figures are standard deviations of the mean obtained by using each of the phantoms as a reference.
Figure 2. The measured vs. expected (a) µa and (b) µs′ of the tissue mimicking phantoms.
Ex vivo liver tissue
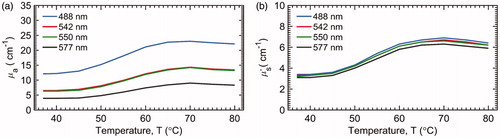
The mean liver tissue temperature vs. time is plotted in . It takes approximately 4.5 min for the tissue at the probe tip to reach 50 °C. The mean and standard deviation (n = 10) for µa and µs′ recorded during heating of the ex vivo liver tissue are present in . The mean µa and µs′ for liver tissue were 8.5 ± 3.7 and 2.8 ± 1.1 cm−1, respectively. Both µa and µs′ began to increase rapidly at about 45 °C and plateaued at about 67 °C, following a sigmoidal trend. The relative changes in µa and µs′ of the liver tissues during heating are shown in , respectively. In addition, the mean µa(λ) and µs′(λ) at some characteristic wavelengths 488 nm (argon laser line), 542 nm (absorption peak for oxyhemoglobin), 550 nm (absorption peak for deoxyhemoglobin) and 594 nm (absorption peak for oxyhemoglobin) are plotted with the mean µa and µs′ in . The µa(λ) and µs′(λ) at these four wavelengths showed similar general trends as that of the wavelength-averaged values (µa and µs′), and therefore, only the µa and µs′ are used for further analysis in the report.
Figure 3. The mean tissue temperature vs. time during heating of ex vivo porcine liver samples.
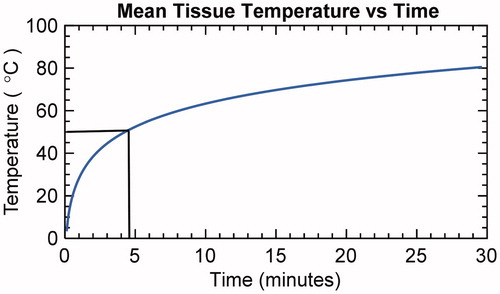
Figure 4. Absolute change in the liver tissue (a) µa and (b) µs′ and relative change in (c) µa and (d) µs′ (n = 10).
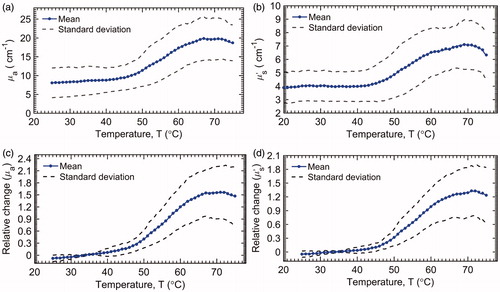
Figure 5. Absolute changes in (a) µa and (b) µs′ at selected wavelengths during tissue heating.
The relative changes in mean µa and µs′ are plotted against the natural logarithm of Fd in . Three different regions were identified: baseline, linear increase and peak. The liver tissue experienced no noticeable damage (In(Fd) ≪ 0) in the baseline region. The transition from the baseline to a linear region occurs at a threshold Fd. The threshold Fd for µa and µs′ were 0.018 (∼48 °C) and 0.024 (∼48.5 °C), respectively. The slope in the linear region for µa and µs′ (liver tissues) were 0.27 and 0.21, respectively. These slopes represent the temperature-dependent relative change in µa and µs′ per unit In(Fd), which reflect the tissue-specific sensitivity of change in µa and µs′ to tissue denaturation (Fd). Finally, the maximum relative change in µa and µs′ within the peak region were found to be 1.5 (66 °C) and 1.3 (67 °C), respectively. The Fd values corresponding to the observed peak positions for both µa and µs′ were 1, indicating complete denaturation. The relative changes in µa and µs′ as a function of T were also compared with the theoretically calculated Fd for liver tissues in . The relative changes in mean µa and µs′ follow closely and are highly correlated with Fd. The Pearson’s correlation coefficient for both µa and µs′, compared to Fd, was 0.96. Furthermore, no significant changes in the optical properties were observed after plateauing of Fd (>67 °C). Finally, the relative changes in µa and µs′, at four different temperatures (37, 55, 65 and 75 °C), representative of different damage levels (1 – baseline, 2 – mid-transition, 3 – onset of plateau and 4 – steady-state), were statistically compared using a paired-t-test, and the results are present in . The relative changes in damage levels 1, 2 & 3 were significantly different from each other (p < .02). However, damage levels 3 & 4 were not significantly different for both µa (p = .37) and µs′ (p = .40), implying that the increases in relative changes in µa and µs′, follow a sigmoidal trend and are correlated (Pearson’s correlation coefficient =0.96) with thermal tissue damage.
Figure 6. Relative changes in (a) µa and (b) µs′ compared with the natural logarithm of Fd; (c) continuous measurement of relative changes in µa and µs′, and Fd at different temperatures; (d) comparison of relative changes in µa and µs′ at Level 1 (37 °C), 2 (55 °C), 3 (65 °C) and 4 (75 °C), respectively. For both parameters, levels 1, 2 & 3 were significantly different from each other. Levels 3 & 4 were not statistically different from each other. (* indicates p < .0003 and ** indicates p < .001).
Discussions
In this paper, an integrated fiber-optic spectroscopic system was developed to record continuous changes in µa, µs′ and local tissue temperature (T) during heating of ex vivo liver. The system was first calibrated using tissue mimicking phantoms, and later, used to study the continuous changes in µa and µs′ of ex vivo liver during heating by comparing them with fractional damage, Fd, calculated using the Arrhenius damage model, EquationEquations (1) and (2)(2)
(2) . The mean photon travel depth in liver (435–630 nm), estimated using source-detector separation (1 mm) and effective attenuation coefficient [Citation27], was 0.5 mm. The temperature variations within 0.5 mm were assumed to be less than our temperature measurement accuracy of 1 °C. The tissue optical properties began to increase rapidly at about 45 °C and plateaued at about 67 °C. From , the overall trend in the continuous changes of mean µa and µs′ follows a sigmoidal trend. From , we observed that at the selected four wavelengths, µa at 80 °C is approximately twofold higher than µa at 37 °C. Similarly, µs′ at 80 °C is about twofold higher than µs′ at 37 °C. The change in mean µa(λ) and µs′(λ) at each of the four wavelengths followed a similar sigmoidal trend.
Increases in tissue µa and µs′ due to heating have also been reported by many groups in different types of soft tissues [Citation18–20] and our observation is in accordance with previously reported studies. Tissue µa(λ) and µs′(λ) are indicative of both the structural and physiological state of the tissue. During heating, temperature-induced microscopic changes in the tissue structure, such as cell membrane rupture or protein denaturation, can alter light propagation within the tissue [Citation28,Citation29], and subsequently, the tissue µa(λ) and µs′(λ) change. Coagulation of structural proteins (e.g., nucleus, mitochondrial etc.), refractive index mismatch, and loss of extracellular fluids or formation of new particles can significantly affect the tissue scattering properties [Citation12,Citation30]. Similarly, denaturation of tissue chromophores alters the absorption characteristics of chromophores, thereby, affecting the µa(λ). From , we can deduce that, during heating, tissue coagulation travels inwards toward the probe. The stresses developed within the coagulum and tissue shrinkage may force highly absorptive tissue fluid (primarily blood mixed with bile) towards the probe which could form a bilayer consisting of highly scattering tissue and highly absorbing aggregation of tissue fluid, around the probe. Such a bilayer could have resulted in the increase of both µa and µs′. Nilsson et al. demonstrated an aggregation of erythrocytes in coagulated rat liver, which they believed to be the cause for an increased µa in coagulated tissues [Citation19]. Therefore, the aggregation of fluids containing highly absorptive chromophore may have caused increases in µa, in our study.
Tissue shrinkage and dehydration are also important factors that can affect the tissue optical properties during thermocoagulation. Jacques et al. [Citation31] and Chan et al. [Citation32] observed that tissue absorption and scattering increases during tissue compression and that such changes are irreversible. Cilesiz et al. [Citation33] observed that dehydration increases tissue µa and µs′. Other factors such as thawing, tissue denaturation et cetera are also known to affect µa and µs′. Salomatina et al. [Citation34] compared optical properties in an ex vivo and in vivo mouse ear model and found that in ex vivo tissues µa and µs′ decreases gradually over time due to loss of blood. In this study, liver samples were kept in saline solution until measurement. The changes in µa and µs′, reported in this study, include the effect of local thermal stress and tissue dehydration. Most of our measurements were made within 15 min, as shown in . Thus, we believe that the effect of tissue dehydration on our measurements was minimal.
There are several limitations to the current study. Specifically, in the present study, only non-cancerous ex vivo tissues were used. It is known that tumor cells are more sensitive to heat than normal tissue [Citation35]. Therefore, future studies will seek to evaluate changes in hepatic tumors’ µa and µs′. We anticipate that tumor tissue will mimic changes seen normal tissue, as reported in the current study. Due to the lack of histological assessment, the true tissue damage was unknown and, therefore, the calculated tissue damage index Fd was used. In future studies, evaluation of the integrated DRS technique will use a histological thermal damage index as the gold standard. Another major limitation in this study is that the measured liver µa and µs′ went beyond the calibration range at higher temperatures, which could have resulted in higher errors. Nevertheless, such measurement errors are systematic in nature and the reported relative changes in µa and µs′ are still valid and reproducible.
Conclusion
In conclusion, an integrated fiber-optic spectroscopic system was developed to continuously measure local temperature and optical properties of ex vivo liver tissues during heating. The observed changes in the liver absorption and scattering (µa and µs′) followed a sigmoidal trend and strongly correlated with the calculated thermal damage (Fd). This study demonstrated the potential of the integrated DRS probe for real-time monitoring of tissue coagulation during thermal ablation of liver tumors. Comparing to the Arrhenius model, which assesses tissue damage indirectly and requires a priori information, the integrated DRS probe provides a direct and potentially more accurate way for continuously monitoring temperature-induced changes (volumetrically) in target tissues. Successfully relating true thermal damage to changes in tissue µa and µs′ during thermal therapy allows for a self-contained cost-effective real-time ablation monitoring system. To further evaluate the feasibility of the technology, future studies should focus on relating temperature-dependent changes in µa and µs′ to the true tissue damage obtained through histological assessment, which can provide more insight on the accuracy and clinical value of the integrated device.
Disclosure statement
No potential conflict of interest was reported by the authors.
Related Research Data
References
- Ferlay J, Soerjomataram I, Dikshit R. Cancer incidence and mortality worldwide: sources, methods and major patterns in GLOBOCAN 2012. Int J Cancer. 2015;136:E359–E386.
- El-Serag HB, Kanwal F. Epidemiology of hepatocellular carcinoma in the United States: where are we? Where do we go? Hepatology. 2014;60:1767–1775.
- Llovet JM, Fuster J, Bruix J, et al. The Barcelona approach: diagnosis, staging, and treatment of hepatocellular carcinoma. Liver Transpl. 2004;10:S115–S120.
- Chen M-S, Li J-Q, Zheng Y, et al. A prospective randomized trial comparing percutaneous local ablative therapy and partial hepatectomy for small hepatocellular carcinoma. Ann Surg. 2006;243:321–328.
- Curley SA, Izzo F, Ellis LM, et al. Radiofrequency ablation of hepatocellular cancer in 110 patients with cirrhosis. Ann Surg. 2000;232:381–391.
- Dou JP, Liang P, Yu J. Microwave ablation for liver tumors. Abdom Radiol. 2016;41:650–658.
- Hori T, Nagata K, Hasuike S, et al. Risk factors for the local recurrence of hepatocellular carcinoma after a single session of percutaneous radiofrequency ablation. J Gastroenterol. 2003;38:977–981.
- Livraghi T, Goldberg SN, Lazzaroni S, et al. Hepatocellular carcinoma: radio-frequency ablation of medium and large lesions. Radiology. 2000;214:761–768.
- Llovet JM. Increased risk of tumor seeding after percutaneous radiofrequency ablation for single hepatocellular carcinoma. Hepatology. 2001;33:1124–1129.
- Poon RTP, Ng KKC, Lam C-M, et al. Effectiveness of radiofrequency ablation for hepatocellular carcinomas larger than 3 cm in diameter. Arch Surg. 2004;139:281–287.
- Raut CP, Izzo F, Marra P, et al. Significant long-term survival after radiofrequency ablation of unresectable hepatocellular carcinoma in patients with cirrhosis. Ann Surg Oncol. 2005;12:616–628.
- Thomsen S, Jacques S, Flock S. Microscopic correlates of macroscopic optical property changes during thermal coagulation of myocardium. Proceedings of Laser-Tissue Interaction, 1990. 1202, p. 2–11.
- Nagarajan VK, et al. Changes in optical properties during heating of ex vivo liver tissues. Proceedings of SPIE, Vol. 2017.
- Arrhenius S. Über die Reaktionsgeschwindigkeit bei der Inversion von Rohrzucker durch Säuren. Zeitschrift Für Physikalische Chemie. 1889;4:226–248.
- Vogl TJ, Freier V, Nour-Eldin N-EA, et al. Magnetic resonance-guided laser-induced interstitial thermotherapy of breast cancer liver metastases and other noncolorectal cancer liver metastases an analysis of prognostic factors for long-term survival and progression-free survival. Invest Radiol. 2013;48:406–412.
- Vogl TJ, Farshid P, Naguib NNN, et al. Thermal ablation therapies in patients with breast cancer liver metastases: a review. Eur Radiol. 2013;23:797–804.
- Carpentier A, Chauvet D, Reina V, et al. MR-guided laser-induced thermal therapy (LITT) for recurrent glioblastomas. Lasers Surg Med. 2012;44:361–368.
- Nagarajan VK, Yu B. Monitoring of tissue optical properties during thermal coagulation of ex vivo tissues. Lasers Surg Med. 2016;48:686–694.
- Nilsson AMK, Sturesson C, Liu DL, et al. Changes in spectral shape of tissue optical properties in conjunction with laser-induced thermotherapy. Appl Opt. 1998;37:1256–1267.
- Ritz JP, Roggan A, Isbert C, et al. Optical properties of native and coagulated porcine liver tissue between 400 and 2400 nm. Lasers Surg Med. 2001;29:205–212.
- Wang A, Xiao H, Wang J, et al. Self-calibrated interferometric-intensity-based optical fiber sensors. J Lightwave Technol. 2001;19:1495.
- Yu B, Fu H, Bydlon T, et al. Diffuse reflectance spectroscopy with a self-calibrating fiber optic probe. Opt Lett. 2008;33:1783–1785.
- Yu B, Shah A, Nagarajan VK, et al. Diffuse reflectance spectroscopy of epithelial tissue with a smart fiber-optic probe. Biomed Opt Express. 2014;5:675–689.
- Yu B, Pickrell G, Wang A. Thermally tunable extrinsic Fabry–Pérot filter. IEEE Photon Technol Lett. 2004;16:2296–2298.
- Palmer GM, Ramanujam N. Monte Carlo-based inverse model for calculating tissue optical properties. Part I: Theory and validation on synthetic phantoms. Appl Opt. 2007;46:6847.
- Jacques SL, Newman C, He XY. Thermal coagulation of tissues: liver studies indicate a distribution of rate parameters not a single rate parameter describes the coagulation process. Proceedings of Annual Winter Meeting of the American Society of Mechanical Engineers, 1991.
- Patterson MS, Andersson-Engels S, Wilson BC, et al. Absorption spectroscopy in tissue-simulating materials: a theoretical and experimental study of photon paths. Appl Opt. 1995;34:22–30.
- Nikfarjam M, Muralidharan V, Christophi C. Mechanisms of focal heat destruction of liver tumors. J Surg Res. 2005;127:208–223.
- Chu KF, Dupuy DE. Thermal ablation of tumours: biological mechanisms and advances in therapy. Nat Rev Cancer. 2014;14:199–208.
- Thomsen S. Pathological analysis of photothermal and photomechanical effects of laser–tissue interactions. Photochem Photobiol. 1991;53:825–835.
- Jacques SL, et al. Pressure effects on soft tissues monitored by changes in tissue optical properties. Proceedings of Laser–Tissue Interaction IX; 1998, Vol. 3254. p. 366.
- Chan EK, Sorg B, Protsenko D, et al. Effects of compression on soft tissue optical properties. IEEE J Sel Topics Quantum Electron. 1996;2(4):943–950.
- Çilesiz I, Welch AJ. Light dosimetry: effects of dehydration and thermal damage on the optical properties of the human aorta: errata. Appl Opt. 1994;33:3571.
- Salomatina E, Yaroslavsky AN. Evaluation of the in vivo and ex vivo optical properties in a mouse ear model. Phys Med Biol. 2008;53:2797–2807.
- Cavaliere R, Ciocatto EC, Giovanella BC, et al. Selective heat sensitivity of cancer cells. Biochemical and clinical studies. Cancer. 1967;20:1351–1381.