
 ?Mathematical formulae have been encoded as MathML and are displayed in this HTML version using MathJax in order to improve their display. Uncheck the box to turn MathJax off. This feature requires Javascript. Click on a formula to zoom.
Abstract
Purpose: To improve the computer modelling of radiofrequency ablation (RFA) by internally cooled wet (ICW) electrodes with added clinically oriented features.
Methods: An improved RFA computer model by ICW electrode included: (1) a realistic spatial distribution of the infused saline, and (2) different domains to distinguish between healthy tissue, saline-infused tumour, and non-infused tumour, under the assumption that infused saline is retained within the tumour boundary. A realistic saline spatial distribution was obtained from an in vivo pig liver study. The computer results were analysed in terms of impedance evolution and coagulation zone (CZ) size, and were compared to the results of clinical trials conducted on 17 patients with the same ICW electrode.
Results: The new features added to the model provided computer results that matched well with the clinical results. No roll-offs occurred during the 4-min ablation. CZ transversal diameter (4.10 ± 0.19 cm) was similar to the computed diameter (4.16 cm). Including the tumour and saline infusion in the model involved (1) a reduction of the initial impedance by 10 − 20 Ω, (2) a delay in roll-off of 20 s and 70 − 100 s, respectively, and (3) 18 − 31% and 22 − 36% larger CZ size, respectively. The saline spatial distribution geometry was also seen to affect roll-off delay and CZ size.
Conclusions: Using a three-compartment model and a realistic saline spatial distribution notably improves the match with the outcome of the clinical trials.
1. Introduction
Radiofrequency ablation (RFA) is a minimally invasive procedure that destroys tumours by selective heating with radiofrequency (RF) electrical current [Citation1,Citation2]. RF current produces ionic agitation in the tissue next to the electrode, which is transformed into heat and propagated in the tissue by thermal conduction [Citation3]. A few seconds after the tissue reaches a temperature over 50 °C, the cell proteins are denatured and the cell dies by coagulative necrosis [Citation4,Citation5]. To guarantee the destruction of tumour cells, RFA must produce a successful coagulation zone (CZ) around the tumour with a 5–10 mm surgical margin recommended for inhibition of local recurrence caused by residual untreated single tumour cells [Citation6]. Although tissue impedance is reduced when heating starts, the dehydration around the electrode due to the liquid-to-vapour phase change causes a sudden rise in electrical impedance (roll-off). This phenomenon seriously limits energy deposition in the tissue and reduces CZ size. Changes in the power delivery protocol and electrode design have been the primary ways of overcoming this limitation.
Internally cooled wet (ICW) electrodes, with combined saline infusion and internal electrode cooling, have arisen as an alternative method of increasing the CZ size obtained separately by cooled electrodes and wet electrodes [Citation7]. The combination of tissue hydration and higher tissue electrical conductivity by infused hypertonic saline, together with the effect of internal cooling, keeps impedance low for longer and may even eliminate roll-off [Citation8–10]. This increases CZ size, and hence the ability to treat larger tumours. Previous experimental and computational results have shown that larger CZs can be obtained by ICW electrodes than by cooled electrodes and wet electrodes separately [Citation11–13], while even larger CZs can be obtained if saline is infused 2 mm from the mid-point of the electrode tip [Citation14]. This “remote” infusion is physically implemented by expandable infusion needles. Unfortunately, saline infusion may involve potential risks, such as uncontrolled saline migration in tissue (although this is less likely in the case of encapsulated tumours) or irregular CZs [Citation15]. Accidental perforation of the tumour wall by expandable infusion needles could also damage nearby organs by saline leakage or undesirable tumour cell seeding.
Computational modelling can provide a comprehensive and detailed biophysical description of the electrical and thermal performance of ICW electrodes during RFA, and thus can be used to improve their use in clinical practice. However, as far as we know, there is still a gap between the modelling studies in this field and their transfer to clinical practice [Citation8,Citation13,Citation16–18]. Demazumder et al. [Citation16] and Antunes et al. [Citation18] built computational models of wet electrodes for cardiac and hepatic RFA, respectively, while Romero-Méndez et al. [Citation8] compared the electrical and thermal behaviour of wet electrodes with ICW electrodes. However, all the phenomena associated with saline infusion have not yet been thoroughly studied. Although Qadri et al. [Citation17] proposed a computational model of ICW electrodes that included saline transport through the tissue, neither the ICW electrode model nor the ablation protocol (10 min-RFA at constant 90 °C by varying input voltage) matched the real conditions of clinical practice.
As an alternative to the formulation proposed by Qadri et al. [Citation17], we recently conducted a study of the influence on CZ size of all the phenomena involved in RFA by ICW electrodes and how they could be included in a computational model [Citation13]. The results showed that the higher electrical conductivity due to saline infusion was mainly responsible for the better performance of ICW electrodes over internally cooled (IC) electrodes, especially as regards CZ size and delaying roll-off. However, this model had two limitations which prevented the computational results being extrapolated to clinical practice: (1) the spatial distribution of infused saline was assumed to be spherical, which does not always actually occur; and (2) the electrical, thermal and perfusion characteristics of healthy and tumour tissue were assumed to be identical, even though electrical conductivity is known to be much higher in tumours than in healthy tissue, and blood perfusion in tumours varies as they grow.
Our aim was thus to improve the previous computational model [Citation13] and set up a clinically oriented model which would include: (1) a more realistic pattern of infused saline distribution at the centre of the tumour based on the results of an ad hoc in vivo experiment, and (2) three compartments for the different zones of saline-infused tumour, non-infused tumour and healthy tissue. The computer results (CZ size and evolution of impedance) were compared to those obtained from a clinical trial with an ICW electrode with identical characteristics to those of the modelled electrode.
2. Materials and methods
2.1. Clinical trial
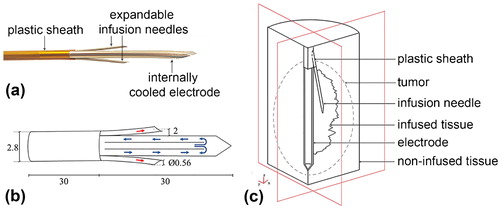
A randomised clinical trial comparing RF ablation (with ICW electrode) vs. microwave ablation (European Registry ISRCTN73194360) is currently under way in the Hospital del Mar (Barcelona, Spain). In the context of our modelling study, we selected and analysed only those nodules treated with a single RF ablation from May 2014 to April 2017, which involved 17 patients and a total of 19 nodules measuring 17.9 ± 0.8 mm in major diameter and 14.8 ± 0.8 mm and 12.8 ± 0.7 mm in minor diameters. RFA was performed using an ICW electrode comprised of a single 2.8 mm diameter and 30-mm long internally cooled electrode with two electrically isolated expandable needles (0.65 mm outer diameter) to infuse hypertonic (20% NaCl) saline at 2 mm from the electrode surface [Citation19] (see ). The electrode temperature was kept under 10 °C by cooled saline circulating through the electrode at 100 mL min−1. RF energy was delivered for 4 min by a CC-1 generator (Radionics, Burlington, MA). The impedance control mode used consisted of a 1-min ramp-up phase followed by 3 min at maximum power (∼140 W). Power was supplied from the ICW electrode to four dispersive electrodes.
Figure 1. (a) Internally cooled-wet (ICW) electrode used in the clinical trial. (b) Electrode scheme and dimensions (in mm, out of scale). Blue arrows indicate the internal flow of cooling liquid while red arrows show the outflow of hypertonic saline through expandable needles. (c) Geometry of the three-compartment model used in the computational study. Note that the geometry of infused tissue is for illustrative purposes only, i.e. it does not coincide with the contour geometry of saline-infused tissue computed from the “generic pattern” (shown in Figure 2(b,c), respectively).
As saline is normally infused during RFA with ICW electrodes, this demands that the optimal volume of injected saline must be used, as an excess can lead to leaks, irregular morphology of the ablated zones (due to hot saline) or seeding of tumour cells carried by the saline [Citation20]. Alternatively, pre-treatment with a hypertonic saline bolus (instead of continuous infusion) could provide a controlled dose of fluid and hence would reduce the risk of complications. The clinical trial thus employed two boluses of 0.5 mL of saline each infused simultaneously through both expandable needles just before RFA. Two additional boluses were administered for <15 s after 90 s of RFA for additional rehydration of the overheated tissue to prevent any potential rise in tissue impedance. Both impedance and power evolution were recorded throughout the ablation. After the procedure computer tomography scans were used to measure the diameters of the coagulation zones, which were “corrected” by taking the shrinkage phenomenon into account prior to comparing the measurements with the computer results (see 2.3. Computational model).
2.2. Spatial distribution of infused saline measured by in vivo study
The spatial distribution of the saline infused into the tissue by the boluses was analysed by means of an in vivo experimental study on two female pigs. The study was approved by the Animal and Human Experimentation Ethics Committee of the Universitat Autònoma de Barcelona (protocol numbers CEEAH 3336 and DMAH 8904). Both animals underwent a laparotomy to expose the liver for direct infusion. Iopamidol, a non-ionic contrast agent (G.E.S., Madrid, Spain), was added to the infused saline. The boluses were introduced into different sections of each lobe through the two expandable needles of an ICW electrode identical to that used in the clinical study. Six sets of infusions were made, each consisting of two 0.5 mL boluses injected at 0 s and 90 s, which gives 2 mL total volume injected per set. Each infusion took ∼15 s. The spatial distribution of infused saline was mapped by a GE OEC Fluorostar fixed X-ray image intensifier system (GE OEC Medical Systems, Salt Lake City, USA) without applying RF, since the aim was to determine the spatial distribution of the saline bolus just before RFA. The images were first preprocessed with Image J Software (open source available at https://imagej.net), adjusting brightness and contrast in order to reduce noise and enhance image quality. As the images from the first and second infusion of the same set were seen to have an almost identically shaped and sized distribution (see Results section for further details), they were overlapped to create a “generic distribution” for each set. The margins of the infused areas were then segmented by thresholding each 8-bit greyscale image [Citation21], preceded by the background subtraction operation for increased effectiveness. The segmented margins were then merged with the original images, converted into binary format and mounted together to create one greyscale image in which each image made up 16.6% of the total greyscale intensity, so that 67% greyscale was considered as the “generic pattern” of saline infusion and hence was used to build the computer model.
2.3. Computational model
2.3.1. Geometry
The computational model mimicked an RF hepatic ablation by ICW electrode, as shown in . The dispersive electrode was modelled as an electrical condition on the boundaries parallel to the active electrode axis. The area of these boundaries coincided with those of four dispersive electrodes (∼132 cm2 each). shows the model geometry, which consisted of five domains with different characteristics: healthy tissue, non-infused tumour, saline-infused tumour, metallic components (electrode, expandable infusion needles) and plastic component (sheath). The outer boundaries of the healthy tissue domain formed a 60-mm radius and 150-mm long cylinder. These dimensions, obtained from a sensitivity analysis, guaranteed an adequate distance between the ICW electrode and the boundary condition (mimicking the dispersive electrodes) to avoid any effects on the simulation results. The reference parameter for the sensitivity analysis was the maximum temperature (Tmax) reached after 240 s at five points at <1 mm from the ICW electrode. The former dimensions were used in the model for differences in electrode Tmax of <0.5% between two subsequent simulations. As the three-dimensional geometry presented two symmetry planes (see ), the computer model only considered one-quarter of the complete geometry. The tumour dimensions were based on the nodule size reported in the clinical study (see Section 2.1 Clinical trial). The tumour was assumed to be an ellipse with major axis (axial diameter) of 18.7 mm and with minor axis (transversal diameter) of 15.6 mm. The geometry of the spatial distribution of infused saline matched with the “generic pattern” obtained from the experimental in vivo study (see Section 3.2. Saline spatial distribution) and was centred and enclosed inside the tumour. This correlated with the assumption that saline accumulates inside a tumour with a limited volume due to the surrounding fibrous capsule. Any excess saline injected into a tumour could result in saline reflux and leakage around the infusion needle [Citation20,Citation22,Citation23].
2.3.2 Governing equations and conditions
The model was based on a coupled electric-thermal problem, which was solved numerically on COMSOL Multiphysics software (COMSOL, Burlington, MA). The governing equation for the thermal problem was the Bioheat equation [Citation24] modified by the enthalpy method to include water vaporisation [Citation25]:
(1)
(1)
where ρ is tissue density, h enthalpy, T temperature, t time, k thermal conductivity, q heat source produced by RF power, Qp heat loss by blood perfusion and Qm the metabolic heat generation. Qm was not considered since it is negligible in RFA. No convection term associated with saline motion was considered since its effect is negligible [Citation13].
The heat source produced by RF power (Joule losses) was given by q = σ|E | 2, where E is the electric field. E = −∇V was obtained from the governing equation of the electrical problem ∇·(σ(Τ)∇V)=0, σ being the electrical conductivity and V the voltage. The electrical conductivity of the tissues was assumed to be a temperature-dependent piecewise function: an exponential increase by +1.5%/°C up to 99 °C, the value was kept constant between 99 and 100 °C, then reduced two orders for five degrees, and remained constant for temperatures above 105 °C. The value of σ was specified for all the tissue subdomains considered at a reference temperature (see Tissue characteristics subsection). We used a quasi-static approach as it is known that the resistive current at RF (≈500 kHz) is much lower than the displacement current [Citation26].
The blood perfusion term Qp was obtained from:
(2)
(2)
where ωb is the blood perfusion coefficient, ρb and cb are the blood density and specific heat, respectively, Tb is the temperature of the arterial blood (37 °C) and β is a coefficient that modifies blood perfusion with tissue damage. The thermal damage was assessed by the Arrhenius damage model [Citation27], which associates temperature with exposure time by a first-order kinetics relationship:
(3)
(3)
where Ω is the damage function, R is the universal gas constant, A is a frequency factor and ΔE is the activation energy for the irreversible damage reaction. The value of Ω = 4.6 corresponding to a 99% probability of cell death [Citation28] was used to define the coagulation zone. Accordingly, blood perfusion rate was defined as follows: β = 0 for Ω ≥ 4.6, and β = 1 for Ω < 4.6.
Considering tissue hydration due to saline infusion and vaporisation at temperatures above 100 °C, the first term in EquationEquation (1)(1)
(1) can be expressed in biological tissues as [Citation13,Citation25]:
(4)
(4)
where ρ and c are tissue density and specific heat respectively at temperatures of 100 °C (i = l refers to water in liquid phase) and above (i = g refers to water in gas phase), and hfg is the product of water latent heat and water density at 100 °C, C is tissue water content, and F is a factor previously proposed by the authors which expresses the requirement for more energy at the phase change when considering saline infusion, in addition to the water already contained in the tissue [Citation13].
The thermal boundary conditions were: initial tissue temperature and temperature at all the outer boundaries of 37 °C, and null heat flux on the two symmetry planes. The cooling effect of the liquid circulating inside the electrode was modelled using a thermal convection coefficient h with a value of 2,800 W K−1 m−2 and a coolant temperature of 10 °C. The value of h was calculated for a flow rate of 100 mL min−1 through an area estimated as half of the internal area of the active electrode (see ). Electrical boundary conditions were: no current flow in the symmetry planes and on the top and bottom liver boundaries, and voltage set to zero on the remaining boundary to model the dispersive electrode. Power application mimicked the clinical protocol as far as possible: the voltage of the ICW electrode was linearly increased from 0 to 74 V during the first 60 s and was then kept constant for the remaining 3 min, which corresponded with ∼140 W power.
2.3.3. Solver
The model mesh size was predefined by COMSOL at 9.38 mm, although additional refinement with 0.6 mm element size was used next to the ICW electrode, where the maximal electric and thermal gradients occur. The sensitivity study (as previously described for model dimensions) was performed on mesh size to find an adequate spatial discretization and minimise its effect on the numerical solution. An adaptively changing time step was used. Again, we assessed the time-step suitability by an analogous sensitivity analysis.
2.3.4. Tissue characteristics
shows the parameter values used in the model [Citation29–41]. Healthy liver electrical conductivity (σ) was set to 0.2 S m−1 at a reference temperature of 37 °C, within the range of values reported in the literature: 0.132 S m−1 [Citation29], 0.143 S/m [Citation30] and 0.260 S m−1 [Citation42]. Although a tumour electrical conductivity value of 0.5 S m−1 had been used previously [Citation20,Citation30,Citation31,Citation42,Citation43], 0.45 S m−1 was chosen so that the computed initial impedance evolution matched the values found in the clinical trials (Section 3.1 Clinical results).
Table 1. Characteristics of the materials used in the computational model (references in brackets).
Saline-infused tumour was characterised by higher electrical conductivity due to the increased concentration of ions in the saline, which carry the electric charge. According to Goldberg et al. [Citation23], tissue “doped” with 18% hypertonic saline showed almost half the impedance measured before the injection (∼110 Ω before and ∼64 Ω after). This can only be due to higher electrical conductivity, and so the electrical conductivity was twice that of non-infused tissue: 0.4 S m−1 for saline-infused healthy liver and 0.9 S m−1 for saline-infused tumour. This assumption led to lower initial tissue impedance and matched the clinical values (see Section 3.1 Clinical results).
Values of tumour density (ρ) and specific heat (c) when its water content is in the liquid phase (T < 100 °C) were taken from [Citation29] and [Citation31]. However, as to our knowledge there are no references for the value of tumour density and specific heat when its water content is in the gas phase in EquationEquation (4)(4)
(4) , we assumed the same values as liver, due to their similarity in this state and their slight influence on the results [Citation44].
As tumour blood perfusion coefficient (ωb) has been reported within a wide range of values: 0.0027 s–1 [Citation32], 0.0053 s–1 [Citation43], 0.0069 s–1 [Citation45], 0.0096 s–1 [Citation33], 0.011 s–1 (63.8 mL/100g min−1, [Citation46]) and 0.009 s–1 (510 mL kg−1 min−1, [Citation30]), we chose a value of 0.009 s–1 as it was the reference we used for healthy tissue and agreed with Aramburu et al. [Citation45], who suggested that perfusion in healthy tissue is different from that of tumour tissue. While healthy tissue is supplied through the portal vein and hepatic artery, a tumour is exclusively supplied from the hepatic artery, which could mean the blood perfusion rate is higher in healthy tissue than in the tumour. We therefore used a value of 0.016 s–1 for healthy tissue, which has also been also reported in the literature [Citation30]. According to Hall et al. [Citation44] the perfusion coefficient has a strong impact on the model results, so we decided to conduct a sensitivity analysis of ωb values for tumour (Case F) ranging from 0.0027 s–1 to 0.011 s–1.
Factor F in EquationEquation (4)(4)
(4) was set to 1 for both non-infused liver and tumour. For the saline-infused tumour we used a value of F = 3 obtained by a sensitivity analysis, as suggested in [Citation13], which related the given value with the process of tissue hydration. F was an adjusting parameter for energy at the phase change during water evaporation when considering saline infusion, as it is assumed that additional tissue hydration increases the tissue’s heat capacity. As the only references for characterising saline-infused tumour, deal with its electrical conductivity, we used the same material characteristics as for non-infused tumour.
2.3.5. Cases analysed
The aim of this study was to improve a previously proposed computational model [Citation13] by including two clinically oriented characteristics: (1) a more realistic spatial distribution of infused saline, and (2) new geometry with three separate compartments for healthy liver, noninfused tumour and saline-infused tumour. To assess the influence of these two characteristics on the results, the following five cases were solved and their results compared:
- Case A: One-compartment model considering only noninfused healthy tissue (for an IC electrode).
- Case B: Two-compartment model consisting of noninfused and infused zones of healthy tissue, assuming spatial distribution to be spherical [Citation13].
- Case C: Two-compartment model as in B but using the “generic pattern” of saline distribution obtained from the in vivo experiments.
- Case D: Two-compartment model consisting of non-infused healthy liver and tumour tissue.
- Case E: Three-compartment model consisting of healthy tissue, non-infused and infused tumour with the spherical saline distribution as in Case B.
- Case F: Three-compartment (full) model consisting of healthy tissue, noninfused tumour and infused tumour with the “generic pattern” of saline infusion obtained from the in vivo experiments.
2.3.6. Outcomes
Impedance evolution throughout ablation was analysed for each case, as was transverse CZ diameter at roll-off or otherwise at 240 s. The CZ computed by the Arrhenius damage model at 4 min produced a “very noisy” contour. According to Schutt et al. [Citation28], when computing the lesion dimension contour, the 48 – 50 °C isotherm correlates with the D99 thermal damage contour, which corresponds to Ω = 4.6 (99% probability of cell death) after a 12 min protocol. In the present study we verified that after 4 min of ablation the 50 °C isotherm matched with Ω = 4.6 (with variations <2 mm) but the isotherm traced a more regular line, so that the 50 °C isotherm was used to measure CZ diameter. Obviously, the use of the isotherm impedes computing the thermal damage accumulated during the cooling phase (just after RF power is switched off), although it is known that the difference in CZ size before and after the cooling phase is negligible in long ablations [Citation47]. Because of the shrinkage associated with RFA, CZ size as measured in clinical practice could be up to 12–20% smaller [Citation48,Citation49]. According to Schutt et al. [Citation28] and Rossmann et al. [Citation48], it is preferable to compare computational results with those obtained in the clinical trials before shrinkage. We therefore established a 20% bigger CZ size margin than the clinical trial when comparing the computer model results.
3. Results
3.1. Clinical results
A maximum output power (140 W) was applied to the tissue after a 1 min ramp-up, which implied ∼30 kJ of total energy deposited. The initial impedance value was ∼55 Ω, and dropped to a value of 46 ± 6 Ω just after saline infusion and kept more or less constant throughout the ablation (plateau phase). No roll-off was registered in the whole period. The measured CZ diameters were 3.42 ± 0.16 cm and 2.81 ± 0.16 cm (maximum and minimum transverse diameters, respectively) and 4.71 ± 0.19 cm (axial diameter). After discarding the shrinkage effect and considering 20% larger diameters, these values were: 4.10 ± 0.19 cm and 3.37 ± 0.19 cm (maximum and minimum transverse diameters, respectively) and 5.65 ± 0.23 cm (axial diameter).
3.2. Saline spatial distribution
The six sets of infusions gave a total of 12 saline distributions (one per each infusion needle). In most cases (10/12), during the injection of the first bolus, X-ray images showed the saline gradually occupying the space around the needle outlet, until a volume of infused tissue was formed. After the injection, the intensity of the contrast agent associated with the saline presence was seen to drop steadily for 90 s, but did not completely disappear. The shape of the infused volume remained unchanged during this period. During the administration of the second bolus, the intensity was gradually restored and the shape contour expanded slightly, after which the intensity and shape evolution were similar to those of the first injection.
In a few cases (2/12) the X-ray images showed that the infused saline escaped through preferential paths and could not accumulate around the infusion needle. These paths corresponded with nearby vessels, whose presence significantly weakened the intensity associated with the contrast agent. As the same procedure occurred after the second bolus both cases were discarded in the analysis. In the remainder (10/12) the saline distribution was irregular and mostly accumulated close to the expandable needle outlet. shows the overlapped images of saline distribution obtained from the six sets of saline injections used to obtain the “generic pattern” shown in .
Figure 2. (a) Images of saline spatial distribution from the six saline injection trials (1 – 6) conducted on the in vivo model. Saline presence is shown in white, while electrode, infusion needles and noninfused tissue are in black. (b) “Generic pattern” of saline spatial distribution derived from the six images from (a) by thresholding and merging them into one greyscale image. (c) Contour geometry of saline-infused tissue derived from the “generic pattern” in (d) and used in the computer model.
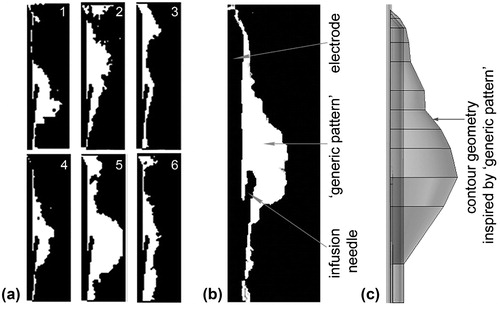
The contour geometry used in the computer model was derived from this “generic pattern” and revolved symmetrically to the rotation axis (). The total volume of saline estimated from the computer model was close to the total volume injected during each in vivo experiment (1.62 and 2 mL, respectively). This volume was used to estimate the radius of the saline spherical distribution considered in Cases B and E.
3.3. Computational results
3.3.1. Impedance evolution
shows the impedance evolution for each analysed case. Roll-off was earlier in cases without saline infusion (A and D), while the addition of saline involved a delay of around 70 − 100 s (B and C). Roll-off occurred earlier in Case B, with spherical distribution, even though both cases considered the same saline volume. Although including the tumour involved a delay in roll-off (see case A vs. D), its effect was not as marked as saline infusion. In contrast, no roll-offs occurred when both saline infusion and tumour were included (E and F).
Figure 3. Impedance evolution in the six analysed cases: A (one-compartment model, only liver), B (two-compartment model, with liver and saline-infused liver using the saline distribution with spherical geometry as proposed in [Citation13]), C (two-compartment model, with healthy liver and saline-infused healthy liver using the saline spatial distribution obtained from the in vivo experiment), D (two-compartment model, with non-infused healthy liver and tumour), E (three-compartment model, with healthy liver, tumour with noninfused and saline-infused zones, and spherical geometry infusion) and F (three-compartment model, with healthy liver, tumour with noninfused and saline-infused zones, and saline spatial distribution obtained from the in vivo experiment). The horizontal grey band represents the range of impedance values observed in the clinical trial. Roll-off time is shown for cases A, B and D.
![Figure 3. Impedance evolution in the six analysed cases: A (one-compartment model, only liver), B (two-compartment model, with liver and saline-infused liver using the saline distribution with spherical geometry as proposed in [Citation13]), C (two-compartment model, with healthy liver and saline-infused healthy liver using the saline spatial distribution obtained from the in vivo experiment), D (two-compartment model, with non-infused healthy liver and tumour), E (three-compartment model, with healthy liver, tumour with noninfused and saline-infused zones, and spherical geometry infusion) and F (three-compartment model, with healthy liver, tumour with noninfused and saline-infused zones, and saline spatial distribution obtained from the in vivo experiment). The horizontal grey band represents the range of impedance values observed in the clinical trial. Roll-off time is shown for cases A, B and D.](/cms/asset/0087834a-0e22-4970-8154-f6987d8d33e8/ihyt_a_1489071_f0003_b.jpg)
Comparing the cases with and without saline infusion (B, C, E and F vs. A and D), infusion was seen to reduce the initial impedance from 69 Ω to 60 Ω in the cases considering only healthy tissue (A vs. B and C) and from 56 Ω to 50 Ω in the cases including the tumour (D vs. E and F). In other words, saline infusion reduced the initial impedance by ∼10 − 13%. Comparing the cases with and without the tumour (A, B and C vs. D, E and F), when the tumour was included the initial impedance was reduced from 69 to 56 Ω for non-infused tissue (A vs. D) and from 60 to 51 Ω for saline-infused tissue (C vs. E and F), showing that the presence of the tumour reduced initial impedance by 15 – 18%.
Because of the delay in roll-off, the cases that considered both saline infusion and tumour (E and F) had the longest plateau phase, with impedance values more or less constant and within 32 − 50 Ω, and even up to the end of ablation in Case E. Interestingly, the case with the saline distribution based in the “generic pattern” (F) showed values closer to those observed in the clinical trials.
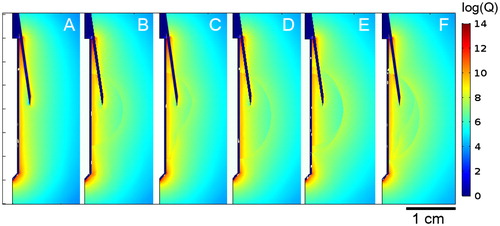
3.3.2. Joule heat source distribution
shows the comparison of the Joule heat source distributions in cases A–F at the beginning of ablation, at 1 s. As expected, the highest Joule heating concentration was seen in close proximity to the electrode and reached its maximum at both ends of its active part. Although the metal infusion needles were not part of the active electrode (since they are not electrically connected to it), there was a noticeable accumulation of power distribution along their length. Higher power intensity (values ∼109 W m−3) was also observed in Cases B–F along the boundaries of the tumour and saline domains, although it was slightly lower within these domains (∼107 W m−3).
Figure 4. Joule heat distribution in the tissue for cases A–F at 1 s of ablation, (logarithmic scale in W/m3). Note that maximum values are reached only on the electrode surface and the infusion needles.
3.3.3. Coagulation zone size
shows the temperature distributions, CZ contour (assessed by the 50 °C isotherm), 100 °C isotherm, and the values of transversal CZ diameter for the six analysed cases. The largest transversal CZ diameters were observed when saline infusion was considered. The diameter increased from 2.60 cm to 3.54 − 3.60 cm in healthy tissue (A vs. C and B, respectively) and from 3.40 cm to 4.16 − 4.34 cm in the tumour (D vs. F and E, respectively). Although all the cases showed a similar CZ shape, saline infusion increased the transversal CZ diameter by 37% in healthy tissue and 25% in tumour tissue.
Figure 5. a: Temperature profiles of cases A–E. Black and white contours are 50 °C and 100 °C isotherms, respectively. The transversal diameter value and time of acquisition are shown in all cases at roll-off times before 240 s or at 240 s in the absence of roll-off. b: Detail of electrode zone in (a) with 100 °C white isotherm shown.
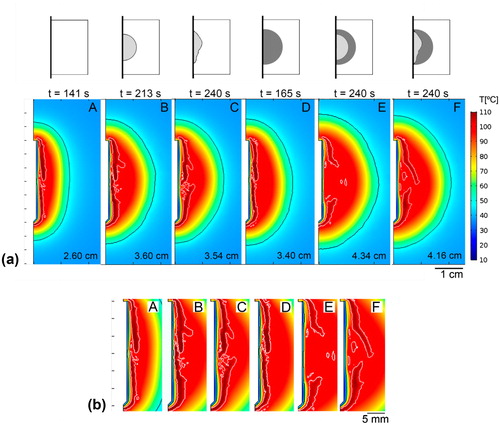
Including the tumour as a single factor also increased the transversal CZ diameter by 31% in noninfused tissue (A vs. D) and 18 − 20% in saline-infused tissue (B vs. E and C vs. F). Interestingly, the results showed that including either saline infusion (B and C) or tumour (Case D) produced a similar increase in the transversal CZ diameter. As a logical consequence, the largest transversal CZ diameter was obtained when both characteristics (saline infusion and tumour) were considered together (E and F).
3.3.4. Effect of tumour blood perfusion
The analysis of the effect of different tumour blood perfusion values (ωb) on the three-compartment model (Case F) showed that in 240 s of ablation roll-off appeared only when the ωb value was the lowest of the chosen range (0.0027 s–1). For higher blood perfusion values used it was assumed that roll-off would occur after 240 s and would depend on the ωb value. CZ growth during the 240 s ablation in all the models was practically unchanged for different ωb values (differences <1%), showing that increasing the ωb value did not directly increase CZ size but could delay roll-off.
3.4. Comparison of clinical and computer results
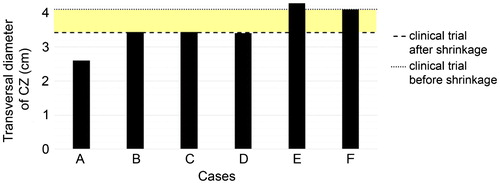
shows the transversal CZ diameters obtained from the computer results and clinical trials. The coloured band represents a range between a minimum value which considers the tissue shrinkage effect and a minimum value that does not, or the probable range in which the results of the computer model (which did not consider the shrinkage effect during ablation) could be compared to the results of the clinical trials. It can be seen that only the cases that included both saline infusion and the tumour (E and F) predicted a higher transversal diameter than the minimum value. Only Case F was strictly within the diameter range and therefore the only case with similar results to those of the clinical trials.
Figure 6. Transversal diameters of the coagulation zones computed for the considered cases A–F. Horizontal lines are the mean transversal diameter found in the clinical trials (dashed line) and the “corrected value” by taking the shrinkage effect into account (dotted line). The coloured band thus represents the range in which the clinical and computed results would match.
4. Discussion
This study was designed to go a step further in RFA computer modelling by ICW electrode. The desired improvement was to be obtained by including two clinically oriented characteristics: a more realistic geometry of the infused saline spatial distribution and assigning specific characteristics to infused and non-infused tumour zones.
First of all, an in vivo study was performed on healthy porcine liver to determine saline spatial distribution after a bolus injection. Two results were obtained, possibly depending on the tissue morphology around the infusion point. First, when the infusion point was at a certain distance from a vessel, the parenchyma retained a certain amount of saline around that point, at least at the infusion rate employed here (1 mL for 15 s). The space occupied probably depended on the bolus volume. The gradual decrease in image intensity indicates that there is a slow loss of accumulated volume, which suggests that the tissue morphology allows the saline to migrate away, possibly through central veins. This suggests that some saline is still present prior to the second bolus and it is hence reasonable to assume that just after the second injection there will be between 1 and 2 mL of saline around the needle. For this reason, the estimated 1.62 mL of total volume of infused saline in the computer model can be said to be consistent.
Second, when the infusion point was near a vessel the results suggested that the vessel acted as a preferential saline drainage path. Under these conditions, no saline would be retained around the infusion point and the tissue would not be rehydrated during RFA.
The “generic pattern” used to build the computer model geometry was based in the most probable scenario, i.e. that allowing saline to accumulate around the infusion point. In fact, although the saline distributions indicated dispersion between the injections, the “generic pattern” matched 67% of the observed cases, showing irregular borders around the electrode and infusion needles, possibly due to heterogeneous permeability caused by the presence of branching networks of blood and lymphatic vessels [Citation50].
The thin laceration gap during electrode insertion between the tissue and metal components (infusion needles and electrode) could also form an additional preferential saline drainage path. However, this behaviour was not found during the study, nor did we find any previous publications reporting this issue. This phenomenon was therefore discarded in the model. The in vivo study thus suggests that saline mainly accumulates around the needle outlets in an oval-like geometry with the largest diameter in the direction of the electrode axis. Because it is reasonable to assume that saline distribution during RFA would be different in the presence of a tumour (see Limitations), the “generic pattern” employed to build the geometry of the computer model should be considered an approximation.
The computer results showed that modifying the simplest model (Case A) to include a second compartment (tumour or infused zone) reduced the initial impedance. This can be explained by the electrical conductivity of both saline and tumour being higher than non-infused healthy tissue. This also meant that for the same RFA protocol the initially applied power in Cases B, C and D was ∼20 W higher than A, which could have been responsible for the larger CZ in those cases. However, the authors consider that the most important factor in CZ growth is the delay in roll-off: ∼23.5 s when the tumour is included (D vs. A) and up to 72.3 and 98.6 s when an infused tissue zone is considered (B and C vs. A). The larger CZ size due to only including the tumour in the model has already been reported by Ahmed et al. [Citation32], although in the present study the greatest effect was related to saline infusion, and hence to tissue hydration, by including factor F in the mathematical framework. This factor is simply an adjusting parameter which allows an energy increase to be considered at the phase change in response to additional tissue hydration by saline infusion, which increases the tissue’s heat capacity. This, in addition to the increase of electrical conductivity, explains the long roll-off delays. Two-compartment models thus predict larger CZs than models based exclusively on healthy tissue.
One of the innovations of this study was to include a specific geometry for the infused saline zone based on the results of an in vivo study. Despite the limitations involved, we considered this to be the most plausible representation of the spatial distribution of saline in the tissue. As compared to a spherical distribution [Citation13], the geometry derived from the “generic pattern” (Case C) extended roll-off time by 26 s. Because both geometries involved the same total saline volume, the delay could be explained by the particular geometry of case C, which tends to completely surround the electrode, extending toward the ends in an elongated shape, in contrast to the spherical geometry in Case B. The electrode ends (tip and proximal edge) are associated with the hot points around the electrode and if covered by saline affect the temperature distribution around the electrode, including the 100 °C isotherm ring closure that precedes roll-off. This geometry is also probably responsible for the CZ diameter being 0.06 cm smaller than the spherical geometry, as its radial distance was slightly smaller than the spherical radius. This difference was higher (0.18 cm) when both geometries were compared in the models that included a tumour (E and F).
Additional observation of the Joule heat source distribution showed that the metal infusion needle could act as a passive electrode by focussing the electrical current and hence “build” a radius of a greater power deposition than would be the case with only the active electrode working. This could therefore affect the current distribution in tissue and the volume of the power deposition by the Joule effect. The temperature profile and the CZ size could therefore be increased by this factor. Also, a higher power intensity seen at the borders of the tumour and saline domains would suggest that the power deposition occurs faster at the borders than within the domain but since this difference does not correlate with the corresponding temperature distribution this hypothesis is discarded. Thus, the most likely reason would be the boundary effect produced between two neighbouring domains with different electrical properties (see cases A vs. B–D and B–D vs. E–F).
Apart from the small differences between cases E and F, the general conclusion is that the three-compartment models offered the most similar results to those of the clinical trial in terms of impedance evolution (see ) and CZ diameters (see .
4.1. Limitations of the study
Because the in vivo study did not consider application of RF power nor tumour tissue we cannot be certain of the saline distribution in these circumstances. However, it is generally accepted that a tumour has an unorganised, disfigured and leaky vessel network with insufficient blood supply, so that its vessel system seems unlikely to be a preferential path of saline drainage [Citation51]. The authors consider that saline would tend to accumulate in the tumour, or at least there would be no significant mechanisms to drain saline away from the tumour, which would justify the assumption of static saline distribution in the model. This is in line with the observations during the clinical trials on actual cases of hepatic tumours, in which no roll-offs occurred after the bolus injections, unlike RFA with saline infusion on healthy tissue.
We recognise that RF-induced heating could affect tissue properties and modify saline distribution. First of all, protein denaturation is known to increase tissue permeability in the ablated region, but this may not be the case further away from the electrode. This would imply saline migration to more permeable regions. However, the denatured tissue surrounding the electrode would shrink, allowing saline retained at the more permeable zone to move closer to the electrode. There is also a possibility that the nearby blood vessels would narrow or close completely due to the high temperature and eliminate this preferential saline path. In other words, during RFA the saline distribution could change due to vaporisation but would remain in the area of infusion as there would be no paths for the saline to drain.
The computer model did not consider the possible additional thermal damage associated with vapour migration after the boiling of interstitial liquids, which can affect CZ size [Citation52]. The increased vapour volume means that in order to stay in thermodynamic equilibrium it needs to expand to maintain the same interstitial pressure, as otherwise, if the volume is constrained, the pressure would increase and the saline could move away from this region. In any case, hot saline transport or vapour migration could engender substantial damage in the surrounding tissue [Citation52] and consequently would modify the CZ size. This phenomenon has been reported to be important in cases with high energy delivery (>100 kJ) for a long period (>30 min) [Citation52]. Because in our case the delivered energy was ∼30 kJ, we consider that the pressure level was not high enough to cause significant saline or vapour migration.
It is also important to point out that the factor F used in this study did not really model the specific phenomena triggered by tissue hydration, such as the higher tissue heat capacity, the latent heat throughout ablation and therefore the longer energy release during the phase change. In this light, its use has no physical explanation. Instead, it was included simply as an adjusting parameter whose value was obtained in a previous study by means of sensitivity analysis, in response to the greater energy requirement when considering saline infusion [Citation13]. The phase change due to water vaporisation could also be modelled using the apparent heat capacity method, which defines the increased heat capacity over a transition phase as a function of temperature. This would describe the evaporation mechanism more precisely and would be more suitable for modelling vaporisation with this type of electrode. On the other hand, neither the enthalpy method nor the apparent heat capacity method includes the effect of vapour heat migration, since they assume it to be small. Our approach simplifies the model by simply adjusting the value of the energy at the phase change at 99 °C instead of defining the transitory state. Neither does it increase the computational requirements, as in the apparent heat capacity method that uses smaller time step and greater mesh refinement.
With regard to the model, the axial symmetry could be a limitation as it involved using the same value for both transversal diameters of the modelled tumour. Although real tumour nodules present three different axis diameters, the results are still valid since we used the same diameter for both modelling the tumour and assessing the CZ diameter.
5. Conclusions
Our experimental findings suggest that the saline spatial distribution in healthy tissue is not necessarily spherical. In fact, saline tends to cumulate around the outlets of the infusion needles, forming an oval-like geometry with the largest diameter in the direction of the electrode axis. The computer modelling study suggests that the inclusion of a second compartment (tumour or infused saline) involves a reduction of the initial impedance and larger coagulation zone size than a one-compartment model based on healthy tissue. The only results similar to the clinical trials were obtained from the three-compartment models (including healthy liver, tumour with noninfused and saline-infused zones) in terms of impedance evolution and CZ diameters. Adding these two features could thus help to develop a more precise and clinically oriented computer model.
Disclosure statement
EB, FB and RQ declare stock ownership in Apeiron Medical, which has a patent licence for the device tested in the clinical trials. The other authors have no conflict of interest or financial ties to disclose.
Additional information
Funding
Related Research Data
References
- Savoie P, Lopez L, Simonin O, et al. Two-years follow-up of radiofrequency thermotherapy for urination disorders due to benign prostatic hyperplasia. Prog Urol. 2009;19:501–506.
- Benoist S, Nordlinger B. Radiofrequency ablation in liver tumours. Ann Oncol. 2004;15:313–317.
- Berjano E, Romero-Méndez R, Franco W. Radiofrequency based hyperthermia therapy: a centennial technique serving modern surgery. Rev Mex Ing Bioméd. 2010;31:142–153.
- Viglianti BL, Dewhirst MW, Abraham JP, et al. Rationalization of thermal injury quantification methods: application to skin burns. Burns. 2014;40:896–902.
- Dewhirst MW, Abraham JP, Viglianti BL. Evolution of thermal dosimetry for application of hyperthermia treatment to cancer. Adv Heat Transfer. 2015;47:397–421.
- Shafirstein G, Novak P, Moros E, et al. Conductive interstitial thermal therapy device for surgical margin ablation: in vivo verification of a theoretical model. Int J Hyperth. 2007;23:477–492.
- Mulier S, Miao YI, Mulier P, et al. Electrodes and multiple electrode systems for radio frequency ablation: a proposal for updated terminology. Adv Exp Med Biol. 2006;574:57–73.
- Romero-Méndez R, Tobajas P, Burdío F, et al. Electrical-thermal performance of a cooled RF applicator for hepatic ablation with additional distant infusion of hypertonic saline: in vivo study and preliminary computer modeling. Int J Hyperth. 2012;28:653–662.
- Lee JM, Han JK, Kim SH, et al. Wet radio-frequency ablation using multiple electrodes: comparative study of bipolar versus monopolar modes in the bovine liver. Eur J Radiol. 2005;54:408–417.
- Jun M, K. inventor. Electrode for radiofrequency tissue ablation. United States patent US 20060122593, 2006.
- Cha J, Choi D, Woo M, et al. Radiofrequency ablation zones in ex vivo bovine and in vivo porcine livers: comparison of the use of internally cooled electrodes and internally cooled wet electrodes. Cardiovasc Intervent Radiol. 2009;32:1235–1240.
- Kim JW, Kim JH, Shin YM, et al. Percutaneous radiofrequency ablation with internally cooled wet electrodes versus cluster electrodes for the treatment of single medium-sized hepatocellular carcinoma. Gastrointest Interv. 2014;3:98–103.
- Trujillo M, Bon J, Berjano E. Computational modeling of internally cooled wet (ICW) electrodes for radiofrequency ablation: impact of rehydration, thermal convection and electrical conductivity. Int J Hyperth. 2017;33:624–634.
- Burdío F, Berjano E, Navarro A, et al. RF tumor ablation with internally cooled electrodes and saline infusion: what is the optimal location of the saline infusion? Biomed Eng Online. 2007;6:30.
- Gillams AR, Lees WR. CT mapping of the distribution of saline during radiofrequency ablation with perfusion electrodes. Cardiovasc Intervent Radiol. 2005;28:476–480.
- Demazumder D, Mirotznik MS, Schwartzman D. Biophysics of radiofrequency ablation using an irrigated electrode. J Interv Card Electrophysiol. 2001;5:377–389.
- Qadri AM, Chia NJ, Ooi EH. Effects of saline volume on lesion formation during saline-infused radiofrequency ablation. Appl Math Model. 2017;43:360–371.
- Antunes CL, Richard T, Nélia OA, et al. Saline-enhanced RF ablation on a cholangiocarcinoma: a numerical simulation. Int J Comput Math Electr Electron Eng. 2012;31:1055–1066.
- Burdío F, Tobajas P, Quesada R, et al. Distant infusion of saline may enlarge coagulation volume during radiofrequency ablation of liver tissue using cool-tip electrodes without impairing predictability. Am J Roentgenol. 2011;196:837–843.
- Ahmed M, Lobo SM, Weinstein J, et al. Improved coagulation with saline solution pretreatment during radiofrequency tumor ablation in a canine model. J Vasc Interv Radiol. 2002;13:717–724.
- Iwata A, Mitamura Y, Niki M, et al. Binarization of enhanced depth imaging optical coherence tomographic images of an eye with Wyburn-Mason syndrome: a case report. BMC Ophthalmol. 2015;15:2–6.
- Ishigami K, Yoshimitsu K, Nishihara Y, et al. Hepatocellular carcinoma with a pseudocapsule on gadolinium-enhanced MR images: correlation with histopathologic findings. Radiology. 2009;250:435–443.
- Goldberg SN, Ahmed M, Gazelle GS, et al. Radio-frequency thermal ablation with NaCl solution injection: effect of electrical conductivity on tissue heating and coagulation-phantom and porcine liver study. Radiology. 2001;219:157–165.
- Pennes H. Analysis of tissue and arterial blood temperatures in the resting human forearm. J Appl Physiol. 1948;1:5–34.
- Abraham J, Sparrow E. A thermal-ablation bioheat model including liquid-to-vapor phase change, pressure- and necrosis-dependent perfusion, and moisture-dependent properties. Int J Heat Mass Transf. 2007;50:2537–2544.
- Doss JD. Calculation of electric fields in conductive media. Med Phys. 1982;9:566–573.
- Chang IA. Considerations for thermal injury analysis for RF ablation devices. Open Biomed Eng J. 2010;4:3–12.
- Schutt DJ, Haemmerich D. Effects of variation in perfusion rates and of perfusion models in computational models of radio frequency tumor ablation. Med Phys. 2008;35:3462–3470.
- Trujillo M, Romero R, Berjano E. Modelos teóricos basados en métodos numéricos de un aplicador cool-tip para ablación RF de tumores: relación entre la temperatura y la impedancia. IFMBE Proc. 2013;33:17–20.
- Zorbas G, Samaras T. Simulation of radiofrequency ablation in real human anatomy. Int J Hyperthermia. 2014;30:570–578.
- Zhang B, Moser MAJ, Zhang EM, et al. Numerical analysis of the relationship between the area of target tissue necrosis and the size of target tissue in liver tumours with pulsed radiofrequency ablation. Int J Hyperth. 2015;31:715–725.
- Ahmed M, Liu Z, Humphries S, et al. Computer modeling of the combined effects of perfusion, electrical conductivity, and thermal conductivity on tissue heating patterns in radiofrequency tumor ablation. Int J Hyperth. 2008;24:577–588.
- Syha R, Gatidis S, Grözinger G, et al. C-arm computed tomography and volume perfusion computed tomography (VPCT)-based assessment of blood volume changes in hepatocellular carcinoma in prediction of midterm tumor response to transarterial chemoembolization: a single center retrospective trial. Cancer Imaging. 2016;16:1–8.
- Berjano E, Hornero F. Thermal-electrical modeling for epicardial atrial radiofrequency ablation. IEEE Trans Biomed Eng. 2004;51:1348–1357.
- Tungjitkusolmun S, Haemmerich D, Cao H, et al. Modeling bipolar phase-shifted multielectrode catheter ablation. IEEE Trans Biomed Eng. 2002;49:10–17.
- Berjano E, Burdio F, Navarro A, et al. Improved perfusion system for bipolar radiofrequency ablation of liver: preliminary findings from a computer modeling study. Physiol Meas. 2006;27:55–66.
- Pätz T, Kröger T, Preusser T. Simulation of radiofrequency ablation including water evaporation. IFMBE Proc. 2009;25:1287–1290.
- Kiricuta I, C, Simplaceanu V. Tissue water content and nuclear magnetic resonance in normal and tumor tissues. Cancer Res. 1975;35:1164–1167.
- Schepps JL, Foster KR. The UHF and microwave dielectric properties of normal and tumour tissues: variation in dielectric properties with tissue water content. Phys Med Biol. 1980;25:1149–1159.
- Kim BM, Jacques SL, Rastegar S, et al. Nonlinear finite-element analysis of the role of dynamic changes in blood perfusion and optical properties in laser coagulation of tissue. IEEE J Sel Top Quantum Electron. 1996;2:922–933.
- Qin Z, Balasubramanian SK, Wolkers WF, et al. Correlated parameter fit of Arrhenius model for thermal denaturation of proteins and cells. Ann Biomed Eng. 2016;42:612–625.
- Haemmerich H, Schutt DJ, Wright AW, et al. Electrical conductivity measurement of excised human metastatic liver tumours before and after thermal ablation. Physiol Meas. 2009;30:459–466.
- Singh S, Repaka R. Temperature-controlled radiofrequency ablation of different tissues using two-compartment models. Int J Hyperth. 2017;33:122–134.
- Hall SK, Ooi EH, Payne SJ. Cell death, perfusion and electrical parameters are critical in models of hepatic radiofrequency ablation. Int J Hyperthermia. 2015;31:538–550.
- Aramburu J, Antón R, Rivas A, et al. Liver cancer arterial perfusion modelling and CFD boundary conditions methodology: a case study of the haemodynamics of a patient-specific hepatic artery in literature-based healthy and tumor-bearing liver scenarios. Int J Numer Meth Biomed Eng. 2016;e02764:1–20.
- Sahani DV, Holalkere NS, Mueller PR, et al. Advanced hepatocellular carcinoma: CT perfusion of liver and tumor tissue-initial experience. Radiology. 2007;243:736–743.
- Irastorza R, Trujillo M, Berjano E. How coagulation zone size is underestimated in computer modeling of RF ablation by ignoring the cooling phase just after RF power is switched off. Int J Numer Meth Biomed Eng. 2017;33:e2869.
- Rossmann C, Garrett-Mayer E, Rattay F, et al. Dynamics of tissue shrinkage during ablative temperature exposures. Physiol Meas. 2014;35:55–67.
- Brace CL, Diaz TA, Hinshaw JL, et al. Tissue contraction caused by radiofrequency and microwave ablation: a laboratory study in liver and lung. Tissue contraction caused by thermal ablation. J Vasc Interv Radiol. 2010;21:1280–1286.
- Ooi EH, Ooi ET. Mass transport in biological tissues: comparisons between single- and dual-porosity models in the context of saline-infused radiofrequency ablation. Appl Math Modell. 2017;41:271–284.
- Forster JC, Harriss-Philips W, Douglass MJJ, et al. A review of the development of tumor vasculature and its effects on the tumor microenvironment. Hypoxia. 2017;5:21–32.
- Abraham JP, Sparrow EM, Ramadhyani S. Numerical simulation of a BPH thermal therapy – a case study involving TUMT. J Biomech Eng. 2007;129:548.