
Abstract
Background: Radiofrequency (RF) mild hyperthermia (40 °C–44 °C for 60 minutes) is an effective adjuvant treatment for several types of cancer. To ensure treatment efficacy, quality assurance (QA) is necessary. This study presents the first systematic 3D characterisation of the heating performance of the commonly used Pyrexar BSD2000-3D MR-compatible hyperthermia applicator using magnetic resonance temperature imaging (MRTI).
Methods: A reproducibly positioned phantom was heated with a power of 1000 watts during the 12.4 min needed to measure eight temperature distributions using MRTI. The target heating location was systematically varied between experiments. We analysed focus shape characteristics, steering accuracy, focus deformation due to steering, presence of off-target heating and reproducibility.
Results: The mean maximum temperature increase was 5.9 ± 0.4 °C. The mean full width half maximum (FWHM) was 14.4 ± 0.5 cm in the XY plane and 24.5 ± 0.8 cm in Z-direction. The mean steering error was 0.4 ± 0.2 cm. The focus shape slightly varied between experiments, depending on steering distance in Y-direction. Off-target heating was not detected. Reproducibility of the focus amplitude and shape was determined by comparing the mean deviation from the mean temperature in the central slice was 0.3 ± 0.2 °C.
Conclusion: The Pyrexar BSD2000-3D MR-compatible applicator provides robust and reproducible heating. The upper boundary of the 95% confidence interval of the spatial steering accuracy is 0.9 cm, i.e. sufficient to fulfil the criterion of ≤0.2 °C temperature variation due to positioning errors as defined by Canters et al.
Introduction
Radiofrequency (RF) mild hyperthermia (40 °C–44 °C for 60 min) is an effective adjuvant treatment for several types of cancer [Citation1–4]. In our experience, the maximum deliverable power during a treatment is most often limited by the occurrence of patient complaints. Hence, being accurate and precise, in combination with complaint guided adaptive treatment planning, is helpful to optimise thermal dose delivery and to study the relation between thermal dose and treatment outcome [Citation5]. To ensure this, an extensive quality assurance (QA) programme for the applicator delivering the hyperthermia treatment is needed for commissioning new systems, followed by regular QA periodic performance analyses in accordance with the ESHO guidelines [Citation6].
Bruggmoser et al. [Citation6] provided QA guidelines for deep-regional hyperthermia applicators to best ensure treatment quality for clinical studies. As in vivo temperature monitoring modalities, the authors mention magnetic resonance (MR) temperature imaging (MRTI). These QA guidelines, however, do not include a systematic and quantitative approach for ensuring the performance of the hyperthermia applicator. Hence, also for MR hyperthermia applicators, no systematic and quantitative procedure is available.
Several authors have evaluated the heating performance of the Pyrexar BSD2000 applicator [Citation7,Citation8] and the electrical characteristics of the Pyrexar BSD2000–3D applicator [Citation9,Citation10]. Limitations of previously used QA modalities are given in .
Table 1. Characteristics and limitations of hyperthermia QA methods.
To our knowledge, however, no systematic 3D information is available on the heating performance of the BSD2000–3D system. In 2001 [Citation11] and 2002 [Citation12], Van Rhoon et al. determined the performance of the Pyrexar BSD2000–3D non-MR compatible applicator in 2D at low resolution using the Schottky diode E-field sheet [Citation13]. provides a comparison of the FWHM of several Pyrexar applicators, as measured with the E-field sheet.
Table 2. Focus diameters as measured with the Schottky Diode E-field sheet in several Pyrexar applicators.
In the current paper, for the first time, the focal shape, focus position and volume, and off-target heating of the BSD2000–3D MR-compatible applicator and the influence of focus steering thereon has been systematically assessed using high resolution 3D MRTI. This performance assessment is systematic since we varied only the target focus location on a regular grid, while other parameters were kept equal.
Based on clinical requirements, our study aimed to develop a systematic QA procedure template which enables quantitative assessment of the performance of the applicator to provide answers to the following questions:
What is our steering accuracy?
Does the Gaussian-shaped heating focus deform when steering off-centre?
Is there off-target heating (‘hot spots’)?
Is the heating reproducible?
Materials and methods
Pyrexar BSD2000–3D MR-compatible applicator and GE MR450w 1.5 T MR-scanner
The Pyrexar BSD2000–3D1, also known as the Sigma Eye, MR-compatible applicator has an elliptical cross-section (). The applicator consists of 24 dipole antennas, which are located in three rings (‘head’, ‘mid’, ‘feet’) with four (‘top’, ‘bottom’, ‘left’ and ‘right’) dipole antenna pairs per ring. The power and phase of the 100 MHz signals applied to each dipole pair can be changed independently, which allows 3D steering of the energy focus. To compensate for the differences in path length from the antennas to the applicator centre due to the elliptical cross-section, a phase delay of 45° is added to the top and bottom antennas through additional cable. Between the antennas and the phantom there is a water bolus which is filled with deionised water. This allows efficient transfer of the electromagnetic energy from the antennas to the phantom, while it also provides surface cooling.
Figure 1. Cross-section of the phantom (grey central circle) in the applicator. The dipole antennas are purple; the green cylinders are the reference tubes filled with fat-like material that is used for B0 drift correction. The black plane is the MRI field of view. Red dots are the steering targets and the white circles represent the corresponding idealised 50% heating contours. These steering settings are representative since, in clinical practice, heating targets are generally centrally located.
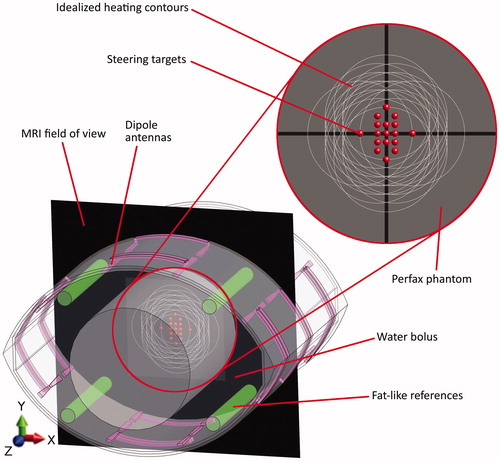
The MR-compatible BSD2000–3D applicator, with phantom inside, is positioned in the 70 cm wide bore of a GE MR450w 1.5 T MR-scanner2. The presence of the applicator enforces the use of the body coil. B0 field drift of the MR scanner over time can cause apparent temperature changes between scans, which is corrected for using reference tubes filled with fat-like material that are integrated into the applicator ().
MRTI
The proton resonance frequency shift (PRFS) method was used to calculate temperature distributions from MR phase data. This method exploits how the temperature dependent shielding of free hydrogen atoms locally changes the B0 field, which leads to differences in phase. PRFS is used to measure a temperature deviation from baseline. Elaborations on PRFS temperature imaging are provided by De Poorter et al. [Citation14,Citation15], Rieke et al. [Citation16] and Winter et al. [Citation17].
For image acquisition, we employed a clinically used double echo gradient recalled echo (DEGRE) sequence, which is part of a CE-marked MRTI package3, with the following parameters: echo times (TE): 4.8 and 19.1 ms; repetition time (TR): 620 ms; 25 axial slices; slice thickness: 1 cm; field of view (FOV): 50 × 50 cm; voxel size measured/DICOM: 3.9 × 3.9 × 10 mm (128 × 128)/0.195 × 0.195 × 10 mm (256 × 256); flip angle: 40°, pixel bandwidth: 162.734 Hz; coil type: body; scan time: 1.32 min. The SNR of the acquired images was 10.7–13.4. Temperature was reconstructed from the PRFS signal using the ΔTE method from Peters [Citation18]. This ΔTE method corrects for phase changes due to the temperature induced changes in phantom conductivity, which would otherwise lead to overestimation of the temperature change. Voxel-wise 3 D B0 drift correction was performed using the integrated fat-like references of the applicator. All reported temperatures are based on the MRTI scans.
Quality assurance ‘perfax’ phantom
This study is on the basic heating characteristics of the Pyrexar BSD2000–3D MR compatible applicator. To exclude influences of complex phantom properties on the heating distribution, e.g. anthropomorphic geometry or interface issues between different tissues, a simple homogeneous cylindrical phantom was used. The cylindrical shape has the advantage that the electrical path length inside the phantom is identical from all directions. This simplicity ensured that potential asymmetries are due to the applicator and not due to phantom properties. Another advantage is that anyone can easily and cheaply make cylindrical phantoms by using industrial PVC shells. A fat layer was not included, since the PRFS signal is not temperature dependent in fat.
To ease comparison with our earlier low resolution 2D performance assessment [Citation11,Citation12], we adhered to the same inner diameter of 25 cm. The length of the phantom was 71 cm to ensure the whole length of the applicator (53 cm) was filled, which prevents fringe fields. The phantom shell was made of 4 mm thick PVC.
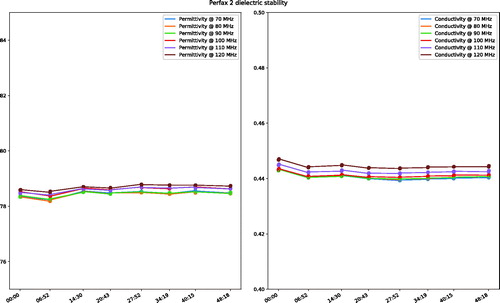
The filling consisted of a mixture of demineralised water and premixed Perfax wallpaper paste4, with a weight ratio of approximately 10:11, respectively. Since the dielectric properties of the premixed Perfax are not guaranteed to be identical between batches, we iteratively adjusted the ratio of deionised water to Perfax until a conductivity of 0.44 S/m at 100 MHz at room temperature (21 °C for both the lab and the MR scanner) was obtained. The permittivity was 79.7. The dielectric properties were measured using the Dielectric Assessment Kit5. Since the Perfax is a liquid, the phantom needs to be shaken to ensure complete mixing before every measurement. Its viscosity is, however, high enough to minimise thermal convection during the experiments, as demonstrated by stable dielectric properties ().
Figure 2. The stability of the dielectric properties of the Perfax phantom over the duration of an experiment.
Experimental design
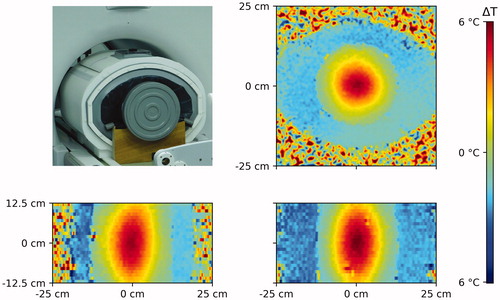
The Perfax phantom was positioned inside the applicator using wooden stands (), which were specifically tailored to both the MR scanner table and the Perfax phantom. This ensured reproducible central positioning of the phantom within the applicator. The phantom was stored in the MR room and allowed to cool down after each experiment for at least 16 h before a new experiment was performed to exclude residual temperature increases.
Figure 3. Perfax phantom on the wooden stands in the BSD2000–3D MR-compatible applicator in front of the MR scanner (left top) and axial (right top), transversal (left bottom) and coronal (right bottom) cross-sections through the measured temperature distribution in the Perfax phantom with (0,0) steering settings.
Applicator performance was assessed by varying the focus target in steps of 1 cm in the Pyrexar control software. This was done systematically on a grid in the axial plane in the centre of the applicator (the black plane in ).
In each experiment, an MRTI scan was made as a baseline. Afterwards, heating was applied during eight sequential MRTI scans, which was required to obtain sufficient temperature increase for MRTI and which amounts to 12.4 min, at a clinically relevant total power of 1000 watts. The efficiency of the BSD2000–3D-MRI system was measured using the calorimetric method, i.e. temperature rise in a large salt water phantom (3 gr NaCl/l, data not included) and it was found that approximately 25% power was lost in cables and waterbolus.
To steer the heating focus, the phase offsets between the top, bottom, left and right antennas were altered per experiment. The dipole antenna pair at the same position (top, bottom, left and right) in the head, mid and feet ring always had identical phase settings. Power per channel was always identical. The water bolus was at room temperature before the experiments. Water circulation was not applied to prevent flow artefacts in the MRTI.
3D analyses
Temperature data analyses were performed using the open source Anaconda distribution of the Python 3 programming language6. MR-derived temperatures were smoothed per scan with a Gaussian kernel using a sigma of two DICOM MRTI voxels (3.9 mm) in X and Y-direction and 0.4 MRTI voxel (4 mm) in Z-direction. SAR is often analysed in W/1 g (∼1 cm3) tissue. To get the temperature equivalent, we truncated the smoothing kernel after 1 std, which led to smoothing over 1 cm3.
Peak temperatures were extracted from the MRTI data. Focus steering accuracy was determined for all steering settings. To increase the accuracy of peak fitting, the MRTI data was smoothed repeatedly using the same kernel before the actual location of the peak of the focus was reconstructed from the MRTI scans. Since peak fitting only requires relative values, loss of accurate magnitude information due to over-smoothing had no negative effect on this analysis. Focus deformation while steering, i.e. asymmetry, was analysed in X, Y and Z direction.
Potential hotspots were quantified in 3D using the volumetric target50/hotspot01 quotient (T50H01Q), in analogy of Canters’ [Citation19]. SAR-based H0.1TQ. To investigate whether there was heating outside the focus area, we defined the 50% iso-contour of the measured heating focus as the ‘target’ volume and everything outside this area, but above the hotspot threshold as off-target heating, i.e. as a hotspot. The hotspot threshold was defined as 99% of the mean temperature in 1 cm3 at the measured focus coordinates.
The volume contained in the target isocontour was then divided by the volume contained in the hotspot isocontours.
Reproducibility was assessed by repeating the experiment for steering target (1,0) four times and comparison of the deviations from the mean peak temperature, in addition to the variation in 50% isocontour diameter.
Results
Focus shape
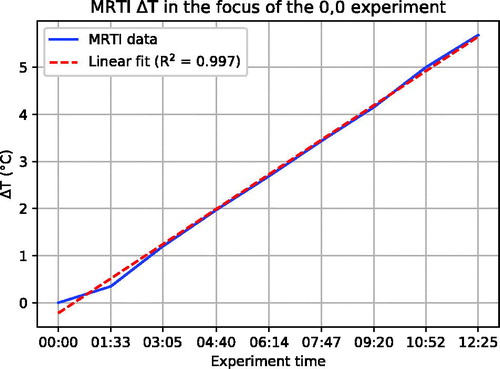
shows the 3D temperature distribution as reconstructed from the MR-images in the Perfax phantom with (0, 0) steering settings. shows that for the duration of the experiment, temperature increased linearly.
Figure 4. The linearity of the temperature increase during an experiment, indicating thermal conduction was negligible despite the 12.4 min heating duration.
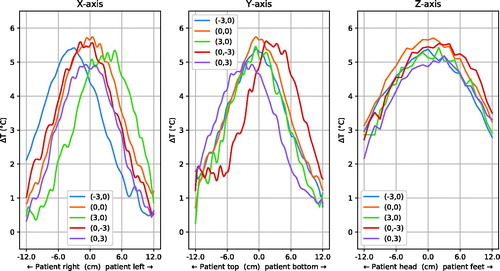
shows the focus shape in X, Y and Z-direction through the peak of the distribution. Data from all steering settings as shown as red dots in were analysed. Only a subset of the measurement points, namely the central (0,0) and the most extreme steering settings (X or Y ± 3), are shown for clarity. The mean (±SD) maximum temperature increase relative to baseline was 5.9 ± 0.4 °C. The mean of the 50% isocontour diameter was 14.3 ± 0.4 cm in X-direction, 14.3 ± 0.6 cm in Y-direction and 24.5 ± 0.8 cm in Z-direction.
Figure 5. Distribution of temperature increase through the focus centre. 0.0 cm on the horizontal axis is the focus centre as measured with MRTI (). For clarity, only the central and extreme steering positions are plotted.
Focus steering
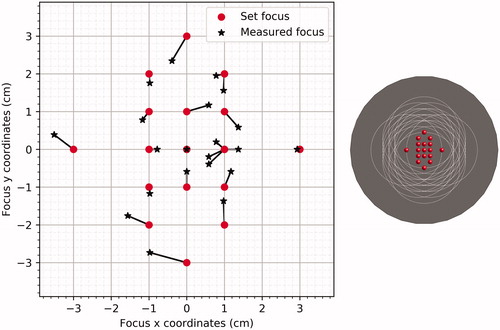
By systematically changing the phase settings per experiment, the focus was set to different positions in the phantom. shows the 3D temperature distribution as produced with (0,0) as target. To check the steering accuracy, the actual focus was reconstructed from the smoothed MRTI data by determining the maximum value in the central axial plane (z = 0) in the measured heating distribution. shows the value that was set in the Pyrexar console (red dots) and the value that was measured (black stars) for all settings. The average steering error was 0.4 ± 0.2 cm, maximum steering errors were 1.0 cm at (0,-3) and 0.8 cm at (0,3).
Figure 6. Left: heating targets as set on the Pyrexar console (dots) compared to the measured targets (stars) in the central axial plane. Right: overview of the location of the different target settings (red dots) in the Perfax phantom.
Focus deformation
Equal phase offsets lead to a central Gaussian focus in the axial plane. To delve into potential focus asymmetries, the presumably Gaussian shape of the focus was divided in two halves, split at the measured focus location. This split was performed in X, Y and Z-direction. One half of the cross-cut of the focus was subtracted from the opposite half. When no deformation was present, this resulted in zero difference.
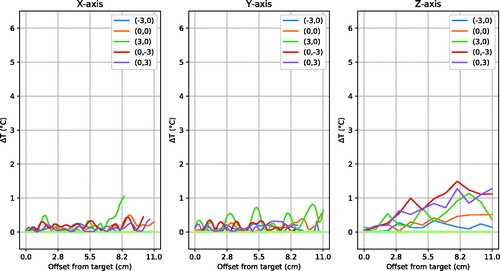
shows that the absolute focus symmetry has a low but detectable sensitivity for vertical steering of 3 cm. shows little asymmetry along the x-axis except one location at the edge of the phantom for (3,0) steering; little difference along y-axis and some noticeable asymmetry (1C) along z-axis for 3 of 5 steering positions. Over all experiments, the mean ± standard deviation asymmetry found was 0.2 ± 0.3 °C in X-direction, 0.2 ± 0.3 °C in Y-direction and 0.4 ± 0.4 °C in Z-direction.
Figure 7. Distribution of absolute temperature increase asymmetry through the focus centre. 0.0 cm on the horizontal axis is the focus centre as measured with MRTI (). The plot lines stop at the phantom border, hence their lengths are unequal. For clarity, only the central and extreme steering positions are plotted.
Hot spot analysis
As previously defined, the 50% iso-contour around the measured heating focus was the target volume. Everything outside this area, but above the hotspot threshold, was regarded as off-target heating, i.e. as a hotspot. The hotspot threshold was defined as 99% of the mean temperature in 1 cm3 at the measured focus coordinates.
For all steering settings, the volumetric target50/hotspot01 quotient (T50H01Q) was more than 13117 with a hotspot volume of approximately 0.2 ml. Without any smoothing, the worst case hotspot volume, which includes artefacts due to small bubbles and MRTI noise, was approximately 13.4 ml.
Reproducibility
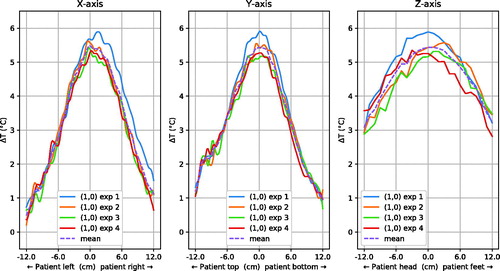
shows the focus shapes for four measurements with a (1,0) target in the X, Y and Z-direction. The temperature deviation from the mean temperature in the central slice was 0.3 ± 0.2 °C; the maximum temperature deviation was 1.3 °C. The mean of the 50% iso-contour diameter was 14.1 ± 0.3 cm in X-direction, 14.3 ± 0.4 cm in Y-direction and 25.0 ± 0.0 cm in Z-direction.
Figure 8. Distribution of temperature increase through the focus centre when steering to (1,0). 0.0 cm on the horizontal axis is the focus centre as measured with MRTI ().
Discussion
The MRTI performance assessment of the Pyrexar BSD2000–3D MR compatible applicator provided us with 3 D high resolution images of the heating characteristics (). The mean maximum temperature increase relative to baseline was 5.9 ± 0.5 °C following 12.4 min of heating at 1000 W forward RF power. Temperature increase during the experiment was linear ().
A mean displacement error for the accuracy of steering the heating focus of 0.4 ± 0.2 cm was measured, leading to an upper boundary of the 95% confidence interval of 0.9 cm. Earlier, Canters et al. [Citation19] showed that in patients, for the BSD2000 non-3D applicator in combination with treatment planning, a deviation of less than 2 cm would result in a TH0.1Q difference of less than 5%, which is considered the threshold for clinical impact.
Focus asymmetry slightly increased when steering in Y-direction (). This might be due to the fact that top and bottom antennas are relatively close to the phantom. However, the effect is limited: in Z-direction it was the largest with a mean of 0.4 °C, but compared to the mean peak temperature increase of 5.5 °C for the reproducibility experiments, this is <10%.
In our clinic, hyperthermia treatments are given up to patient’s tolerance and therefore can be limited by hot spots [Citation20]. Therefore, we checked for the presence of anomalous hot spots by determining the volumetric T50H01Q, as described in the 3D analyses section. The lowest volumetric target50/hotspot01 quotient (T50H01Q) was found to be 13117, which means the volume of the focus was 13117 times as large as the volume of the hot spots, which amounts to approximately 0.2 ml. Without any smoothing, the worst case hotspot volume, which includes artefacts due to small bubbles and MRTI noise, was approximately 13.4 ml. Also, this high volumetric T50H01Q was found in a cylindrical homogeneous phantom. In patients, thermoregulation and complex geometry with the associated tissue boundaries will lead to a much lower volumetric T50H01Q.
To assess reproducibility, we repeated the steering to (1,0) experiment four times (). The standard deviation in temperature difference from the mean of ±0.2 °C leads to a 95% confidence interval of ±0.4 °C, indicating good stability of the focus shape and amplitude. The upper range of the 95% confidence interval regarding steering accuracy for these experiments is 0.6 cm, which is under the clinical relevance threshold of 2 cm, as discussed earlier.
Elaboration on phantom
The Perfax phantom was deliberately kept simple to avoid potential complications when interpreting the results. It allowed for easy, standardised and accurate central phantom positioning through the use of wooden stands (), which improved the reliability of these results. In addition, it ensured that the phantom was sturdy and inexpensive, which is crucial for multi-centre comparisons. Also, the phantom is stable for the duration of the experiment ().
Comparison with earlier results
Since the phantom dimensions and permittivity and conductivity were approximately identical to the phantom used for our earlier E-field measurements of the BSD2000–3D non-MR compatible applicator [Citation7,Citation11,Citation12], the results could be compared. These studies found an XY-full width half maximum (FWHM) of 11.3 cm () at (0,0). With the BSD2000–3D MR, however, we measured an XY-FWHM of 13.0 cm with the E-field sheet. Even larger differences were found between the BSD2000 and the BSD2000 Ellipse. These differences illustrate that there is still a need of QA per individual applicator.
With MRTI, we measured a temperature XY-FWHM of 14.4 cm and a Z-FWHM of 24.5 cm. The temperature increase during the 12.4 min heating duration was linear (), indicating that heat conduction could not explain this 1.4 cm difference on the XY-plane. This is supported by an XY-FWHM of 13.8 cm and a Z-FWHM of 20.3 cm after 3 min of heating. The XY-difference of 0.6 cm can be explained by the limited temperature SNR after only 3 min, which likely leads to an underestimation of the FWHM.
One important difference between the E-field sheet measurements and the MRTI experiments is the used RF power level. The E-field sheet measurements in the BSD2000–3D MR were carried out at 400 watt, while our MRTI experiments used the clinically representative power of 1000 watts. Fatehi and Van Rhoon [Citation7] showed that, for the BSD2000, increased power led to a larger FWHM. This is consistent with our current findings. Future research need to elucidate how large this effect is for the BSD2000–3D MR applicator.
In summary, we mainly attribute the increased FWHM of the MRTI results in both the XY-plane and in Z-direction to the higher RF power. Other contributing factors might be the low spatial resolution of the E-field sheet measurements, the required smoothing of the MRTI data and possibly the contribution of minor radial E-fields, which are not detected by the Schottky diode E-field sheet. As shown by , thermal conduction played a negligible role.
Relevance
One could argue that achieving sufficiently high intraluminal temperatures, as measured by temperature probes during treatments, is sufficient to monitor hyperthermia treatment quality, which makes independent heating performance QA redundant. However, temperature probes are limited in their spatial coverage and might therefore not capture off-target hot spots. In addition, intraluminal probes are not inserted into the tumor, where the temperature is most relevant. Although intra-luminal temperatures are highly correlated with intra-tumoral temperatures, clinically relevant quantitative differences do exist [Citation21]. Hence, measured adequate temperatures are no guarantee that the applicator is actually performing according to specifications. Furthermore, systematic QA provides the necessary data to validate 3D hyperthermia treatment planning. As such systematic QA is essential to ensure the suitability of the steering actions that are taken based on the measurement of high temperatures or patient complaints during treatment.
Standardized quantitative 3D high resolution QA with a field of view that covers the whole phantom is the most thorough way to objectively judge applicator performance. Although the field of view of MRTI does not cover the whole phantom, it is the most spatially comprehensive non-invasive temperature measurement modality that is currently available.
In practice, MRTI alerted us to an antenna issue. A malfunctioning antenna caused off-target hot spots that other QA modalities missed. Subsequently, the issue was repaired by the manufacturer, resulting in the satisfactory performance as presented in this article. MRTI thereby proved itself to be invaluable for ensuring hyperthermia treatment quality.
This performance assessment can be used as benchmark during commissioning, as a reference for regular QA, as well as a basis for well controlled multicentre clinical trials using well-characterized MR guided RF hyperthermia. It also provides an indication of performance of the non-MR compatible, but otherwise similar, Pyrexar BSD2000–3D applicators.
Acquiring the full set of measurements as we performed in this study on a regular basis would take too long to be feasible. Therefore, a reduced subset of measurements could be acquired, for which we suggest the following steering settings: (0,0), (–3,0), (3,0), (0, –3), (0,3). These settings capture the central and extreme heating patterns of the full set of measurements.
Future perspectives
Further study is needed to decide on the required QA interval. One approach to determine this would be to, on a monthly basis, measure and analyse the steering performance at (0,0). When a central steering error of more than 1 cm is detected, measurements could be performed according to the reduced subset of steering settings.
In general, standardized QA is crucial for objective comparison for both MR compatible and non-MR compatible hyperthermia applicators in multicentre clinical trials. QA allows minimizing system performance differences. Hence, it has the potential to help homogenize the clinical application of hyperthermia by ensuring a consistent quality, thereby inspiring confidence in the system in clinicians.
Ultimately, high quality QA aids in treatment control and is therefore essential to accurately identify dose-effect relationships. It will improve treatment planning validation and treatment system development by objectifying performance assessments.
Conclusion
The upper boundary of the 95% confidence interval of the focus steering accuracy was found to be 0.9 cm. This is under the clinically relevant threshold of 2 cm, as described by Canters et al. [Citation19]. The Gaussian-shaped central focus showed limited deformation while steering off-centre. Hot spots were not observed. The heating characteristics were reproducible within a 95% confidence interval of 0.4 °C. Based on these evaluations, the applicator was approved for clinical use.
Disclosure statement
No potential conflict of interest was reported by the authors.
Notes
Additional information
Funding
Notes
1 Pyrexar Medical, Salt Lake City, USA
2 General Electric Healthcare, Waukesha, USA
3 Dr. Sennewald Medizintechnik GmbH, München, Germany
4 Henkel AG & Co., Düsseldorf, Germany
5 SPEAG, Zürich, Switzerland
6 Anaconda software distribution 5.0.1, available at https://anaconda.com
References
- Datta NR, Puric E, Klingbiel D, et al. Hyperthermia and radiation therapy in locoregional recurrent breast cancers: a systematic review and meta-analysis. Int J Radiat Oncol Biol Phys. 2016;94:1073–1087.
- Datta NR, Rogers S, Klingbiel D, et al. Hyperthermia and radiotherapy with or without chemotherapy in locally advanced cervical cancer: a systematic review with conventional and network meta-analyses. Int J Hyperthermia. 2016;6736:1–34.
- Datta NR, Rogers S, Ordonez SG, et al. Hyperthermia and radiotherapy in the management of head and neck cancers: a systematic review and meta-analysis. Int J Hyperthermia. 2016;32:31–40.
- Hu Y, Li Z, Mi D-H, et al. Chemoradiation combined with regional hyperthermia for advanced oesophageal cancer: a systematic review and meta-analysis. J Clin Pharm Ther. 2017;42:155–164.
- Bruggmoser G, Bauchowitz S, Canters R, et al. Quality assurance for clinical studies in regional deep hyperthermia. Strahlenther Onkol. 2011;187:605–610.
- Bruggmoser G, Bauchowitz S, Canters R, et al. Guideline for the clinical application, documentation and analysis of clinical studies for regional deep hyperthermia: quality management in regional deep hyperthermia. Strahlenther Onkol. 2012;188:198–211.
- Fatehi D, van Rhoon GC. SAR characteristics of the Sigma-60-Ellipse applicator. Int J Hyperthermia. 2008;24:347–356.
- Wust P, Fahling H, Brunner M, et al. Visualization and registration of three-dimensional E-field distributions in annual-phased-array applicators. Med Phys. 1999;26:653–659.
- Wust P, Fähling H, Wlodarczyk W, et al. Antenna arrays in the SIGMA-eye applicator: Interactions and transforming networks. Med Phys. 2001;28:1793.
- Wust P, Beck R, Berger J, et al. Electric field distributions in a phased-array applicator with 12 channels: measurements and numerical simulations. Med Phys. 2000;27:2565–2579.
- Van Rhoon GC, Ameziane A, Abdel-Rahman S, et al. A multi-institutional comparison of the SAR characteristics of five different Sigma-Eye applicators in a homogeneous cylindrical phantom using the Schottky diode sheet. 19th Annual Meeting of the European Society for Hyperthermic Oncology (ESHO); 2001 May 30–June 2; Verona, Italy; 2001.
- Van Rhoon GC, Ameziane A, Van den Biggelaar A, et al. Assessment of the SAR steering feasibility of the Sigma-Eye applicator using the Schottky diode sheet. 48th Annual Meeting of the Radiation Research Society, and the Nineteenth Annual Meeting of the North American Hyperthermia Society; 2001 April 21–25; San Juan, Puerto Rico: Caribe Hilton; 2001.
- Kaatee RS, van Rhoon GC. An electric field measurement system, using two-dimensional array of diodes. Int J Hyperthermia. 1999;15:441–454.
- De Poorter J, De Wagter C, De Deene Y, et al. Noninvasive MRI thermometry with the proton resonance frequency (PRF) method: in vivo results in human muscle. Magn Reson Med. 1995;33:74–81.
- De Poorter J. Noninvasive MRI thermometry with the proton resonance frequency method: study of susceptibility effects. Magn Reson Med. 1995;34:359–367.
- Rieke V, Pauly KB. MR thermometry. J Magn Reson Imaging. 2008;27:376–390.
- Winter L, Oberacker E, Paul K, et al. Magnetic resonance thermometry: methodology, pitfalls and practical solutions. Int J Hyperthermia [Internet]. 2016;32:63.
- Peters RD, Henkelman RM. Proton-resonance frequency shift MR thermometry is affected by changes in the electrical conductivity of tissue. Magn Reson Med. 2000;43:62–71.
- Canters RAM, Franckena M, Paulides MM, et al. Patient positioning in deep hyperthermia: influences of inaccuracies, signal correction possibilities and optimization potential. Phys Med Biol. 2009;54:3923–3936.
- Franckena M, Canters R, Termorshuizen F, et al. Clinical implementation of hyperthermia treatment planning guided steering: a cross over trial to assess its current contribution to treatment quality. Int J Hyperthermia. 2010;26:145–157.
- Fatehi D, Van Der Zee J, Notenboom A, et al. Comparison of intratumor and intraluminal temperatures during locoregional deep hyperthermia of pelvic tumors. Strahlenther Onkol. 2007;183:479–486.