
 ?Mathematical formulae have been encoded as MathML and are displayed in this HTML version using MathJax in order to improve their display. Uncheck the box to turn MathJax off. This feature requires Javascript. Click on a formula to zoom.
Abstract
Introduction: On-line adaptive hyperthermia treatment planning can be useful to suppress treatment limiting hot spots and improve tumor temperatures during locoregional hyperthermia. This requires adequate prediction of changes in heating patterns after phase-amplitude steering. We investigated the predictive value of simulated SAR and temperature for changes in measured temperature after phase-amplitude steering during locoregional hyperthermia.
Methods: All treatment sessions of 75 patients with pelvic malignancies treated between September 2013 and March 2018 were evaluated. Phase-amplitude adaptations during the 60 min steady-state period were analyzed. Treatment planning was performed using Plan2Heat, based on CT scans with (thermometry) catheters in the vagina, rectum, and bladder in situ. The predicted SAR and temperature along the thermometry tracks were extracted from the simulated distributions. Correlations between changes in average measured temperature and the simulated SAR and temperature were evaluated for single phase-amplitude steering events, unaccompanied by other (steering) actions.
Results: A total of 67 phase-amplitude steering events were suitable for analysis. Simulated changes in both SAR and temperature correlated with the measured temperature changes. For the vagina, R2 = 0.44 and R2 = 0.55 for SAR and temperature, respectively. For the rectum, these values were 0.53 for SAR and 0.66 for temperature. Correlations for the bladder were weaker: R2 = 0.15 and R2 = 0.14 for SAR and temperature, respectively. This can be explained by convection in the bladder fluid, unaccounted for by present treatment planning.
Conclusion: Treatment planning can predict changes in an average temperature after phase-amplitude steering. This allows on-line support with phase-amplitude steering to optimize hyperthermia treatments.
Introduction
Locoregional hyperthermia is successfully applied in combination with radiotherapy or chemotherapy for a number of tumor sites. Many of these sites are located in the pelvic region (e.g., cervix uterus, bladder, rectum) [Citation1–4]. Locoregional heating systems consist of multiple antennas organized in one or more rings positioned around the patient [Citation5,Citation6]. Heating is focused on the target region by selecting adequate phase and amplitude settings for the individual antennas [Citation7].
High tumor temperatures are desired because of the thermal dose–effect relationship demonstrated in clinical studies [Citation2,Citation8], and the widely accepted optimal thermal dose is 43 °C for 1 h [Citation9]. When the temperature rise in the target region is sub-optimal during treatment, it can be necessary to adapt the antenna settings to improve focusing. Furthermore, during locoregional hyperthermia normal tissue is also heated to some extent and treatment limiting hot spots in normal tissue can occur due to the heterogeneity in energy absorption and perfusion properties. These hot spots require adaptation of the phase-amplitude settings to reduce the temperature at the hot spot location, preferably without reducing the temperature rise in the target region.
Adapting antenna settings to improve target heating or to resolve hot spot complaints is usually performed based on the clinical experience of the operator. However, intuitive optimization of antenna settings is challenging because of the large number of degrees of freedom, which increases with the number of independent antennas. Therefore, to further improve the quality of hyperthermia treatments and to make treatments less operator-dependent, adaptive hyperthermia treatment planning supporting phase-amplitude steering during treatment could be very useful.
Hyperthermia treatment planning uses a segmented patient model to calculate the specific absorption rate (SAR) and temperature distribution in the patient for specified phase-amplitude settings [Citation10]. Additionally, SAR-based or temperature-based optimization of phase-amplitude settings is possible [Citation11–17]. Ideally, patient-specific dielectric and thermal tissue properties would be used as input for the simulations, but this is quite challenging and subject of ongoing research [Citation18,Citation19]. Therefore, these tissue properties are typically taken from the literature, despite the fact that these values show a large inter and intra-patient variation [Citation20,Citation21]. This explains why hyperthermia treatment planning is not yet quantitatively reliable for accurate pre-treatment planning of individual patients [Citation22,Citation23].
Current clinical applications of hyperthermia treatment planning, therefore, focus on the qualitative use of SAR and temperature predictions. Recent research in small patient groups showed that treatment planning can (1) distinguish between easy-to-heat or difficult-to-heat patients [Citation24], (2) help to reduce the temperature at hot spot locations [Citation25,Citation26], and (3) to improve focused heating in the target region [Citation27,Citation28]. Both SAR-based and temperature-based treatment planning have been used for these clinical applications. The advantage of thermal modeling is that it accounts for very relevant thermal processes as cooling by the water bolus, thermal conduction, and perfusion, but the uncertainty in thermal properties affects the accuracy of temperature predictions [Citation23]. Nevertheless, thermal modeling is in theory still more robust than SAR-based modeling, despite the uncertainty in thermal tissue properties [Citation23]. However, the advantage of thermal modeling has not been demonstrated yet for clinical applications and the question remains whether thermal modeling is more accurate than SAR-based modeling for on-line assistance in phase-amplitude steering.
On-line clinical use of hyperthermia treatment planning is a form of adaptive treatment planning, in which changes in simulated SAR or temperature are used as a predictor for changes in measured temperature to assist in phase-amplitude steering. Thus, it is essential that simulated changes in SAR and/or temperature are predictive for real changes in local temperature measured after adaptation of the antenna settings. In other words, simulated changes in SAR and/or temperature should correlate with measured changes in temperature. A previous study performed a first step in this validation by demonstrating a good correlation between simulated and measured changes in SAR after phase adaptations at the start of treatment, i.e., the initial phase when all tissue and blood temperatures are −37 °C and when the influences of thermal conduction and perfusion are thus negligible [Citation22]. The present study takes the next step by extending this validation to both amplitude and phase adaptations during the full 1 h locoregional hyperthermia treatment. Furthermore, the difference in the predictive value of simulated SAR and temperature for changes in measured temperature after phase-amplitude steering is evaluated.
Methods
Patients, treatment set-up, and measurements
This study included all 75 locoregional hyperthermia patients with pelvic malignancies treated at our department between September 2013 and March 2018, and, for whom hyperthermia treatment plans were available. The majority of these patients were treated for cervical cancer or non-muscle invasive bladder cancer.
Locoregional hyperthermia was applied using the 70 MHz AMC-8 system [Citation6]. The device was used as a single-ring system with four antennas (top, bottom, left, and right). Patients were treated in the supine position, located centrally between the antennas in the lateral and anterior-posterior direction, with the tumor located centrally in the cranial-caudal direction. Superficial cooling was applied using water boluses between the antennas and the patient to prevent overheating of the skin.
Treatments followed our standard clinical hyperthermia protocol, in accordance with the quality assurance guidelines [Citation29]. At the start of treatment standard power ratios were selected, typically top:bottom:left:right = 1:1:1:1, and initial phases were optimized using an E-field probe at or close to the tumor. The top antenna served as a reference with phase 0° and the phases of the other antennas were optimized by performing a phase sweep and selecting phases that yield a maximum E-field, and thus a focus, at the probe location. Temperature rise measurements after a short power pulse with different settings were performed to confirm that selected settings yielded adequate target heating [Citation22,Citation30]. During treatment, phase and amplitude settings were adapted when necessary, for example in the case of treatment limiting hot spots.
Standard clinical thermometry was performed using 14-point thermocouple probes (spacing 0.5 cm, ELLA, Hradec Králové, Czech Republic) in the bladder and rectum and in the case of female patients also in the vagina. A Foley catheter (Rüsch, Kernen im Remstal, Germany) was inserted for temperature measurements in the bladder. Temperature measurements were performed every 30 s, after 5 s power off to minimize the influence of self-heating of the thermocouple probes. According to our clinical protocol, the steady-state period of 1 h started after an induction heating period of 30 min at maximum in order to avoid the total treatment time being longer than 90 min.
Event selection
Events, i.e., phase or amplitude adaptations, registered during the steady-state period of the treatment (after a 30 min induction period) were selected for analysis. To analyze solely the effect of the phase-amplitude steering, events were selected when no additional adaptations in antenna settings or total power occurred within 5 min before or after the phase-amplitude adaptation. Furthermore, a reliable analysis of the effect of phase-amplitude steering requires stable temperature levels at the time of the steering event. Therefore, measurements were removed from the analysis when a disturbance in the measurement was observed within 5 min of the steering action; e.g., by emptying the bladder or positioning cushions under the legs resulting in a change of posture in the target region. To further ensure stable temperature levels, only measurements were selected for which the difference in spatial average temperature measured at the time 5 min before the event and at the event was at most 0.1 °C. In other words, the spatial average temperature should be stable within ±0.1 °C at the time of changing the antenna settings.
Hyperthermia treatment planning
Treatment planning was performed using the Plan2Heat software package [Citation31]. Simulations were based on a −60 cm CT scan in hyperthermia treatment position, on a water bolus and mattresses, with the thermometry catheters in situ, if possible. The target region was delineated by a radiation oncologist and the rest of the CT scan was segmented into fat, muscle, bone, and air, using Hounsfield Unit-based segmentation [Citation32]. Small artifacts and the thermometry probe trajectories impeding automatic segmentation were corrected by manual delineation. The electrical and thermal tissue properties used in the simulations were obtained from the literature and are summarized in [Citation20,Citation33].
Table 1. Values of the electrical and thermal tissue properties at 70 MHz used in the simulations.
The segmented CT data set was downscaled to 2.5 × 2.5 × 2.5 mm3, using a winner-takes-all principle [Citation34] and combined with a model of the four 70 MHz waveguides and water boluses. The E-field distributions were calculated for each antenna separately with unit amplitude and zero phase using the finite difference time domain (FDTD) method [Citation35]. For each event, superposition was used to calculate the SAR distributions for the antenna settings before and after the phase-amplitude steering. The corresponding temperature distributions were calculated using the Pennes bioheat equation [Citation36], with constant perfusion levels, enhanced for hyperthermic temperatures:
(1)
(1)
In this equation c (J kg−1 °C−1) is the specific heat capacity, ρ (kg m−3) the tissue density, and k (W m−1 °C−1) the thermal conductivity. The second term on the right-hand side models the heat removal by blood flow, with cb (J kg−1 °C−1) the specific heat capacity of blood, Wb (kg m−3 s−1) the volumetric perfusion rate, and Tart the local arterial or body core temperature (assumed to be 37 °C). Q (W m−3) is the metabolic heat rate, which can be neglected for locoregional hyperthermia applications. Steady-state temperature distributions were calculated for this study, as would also be used for on-line applications of treatment planning, since the steady-state distribution can be calculated instantly on-line [Citation12,Citation14].
Analysis
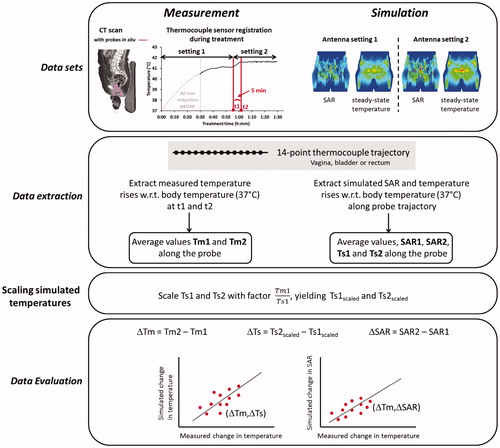
When applying phase-amplitude steering, the most substantial change in temperature can generally be expected within 5 min after changing the antenna settings. Therefore, measured temperatures averaged over the thermocouple probe trajectory at the vagina, rectum, and bladder (if present) were extracted from the treatment data at the time of the event and at the time point 5 min after changing the antenna settings. To reconstruct the simulated SAR and temperature along the probe trajectories, track paths were delineated from the CT scan using the Plan2Heat module jTracktool [Citation31]. Using these track paths the SAR and temperature were extracted from the simulated distributions with a 0.5 cm interval (i.e., the sensor spacing of the thermocouple probes) along the track. Spatial average values at each measurement location (vagina, rectum, bladder) were calculated and simulated average temperatures were scaled per location with a factor such that the simulated value before changing the antenna settings corresponds to the measurement value. Next, the change in SAR and temperature due to adapting the antenna settings was determined for comparison with the measurements. The different steps of this analysis are summarized in . Linear correlations between measured and simulated changes were determined for each measurement location separately. Furthermore, the accuracy of predicting temperature changes was evaluated by determining the number of predictions that were accurate within ±0.1 °C.
Figure 1. The different steps of the analysis to determine linear correlations between measured changes in temperature and simulated changes in SAR or temperature after phase-amplitude steering.
Results
Event selection
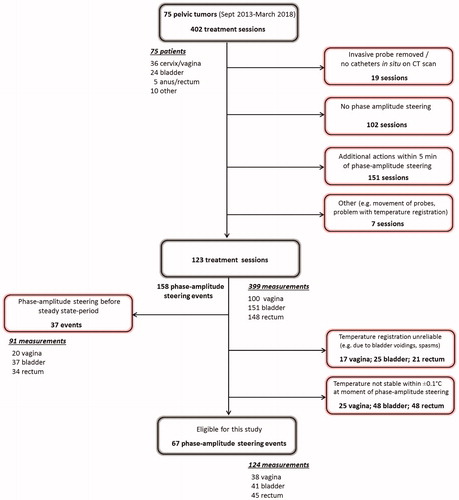
shows a flow chart of the event selection process. All 402 treatment sessions of 75 patients were analyzed and 123 treatment sessions were found suitable for evaluation of phase-amplitude steering events. Major reasons for removal of sessions from the analysis were (1) no phase-amplitude steering was applied (N = 102) or (2) other events were reported that could affect the temperature level (i.e., additional steering, power adaptation, positioning cushions under the legs, etc.) within 5 min of the event (N = 151). During these 123 treatment sessions, 158 evaluable phase-amplitude steering events were reported. Of these, 37 events were reported during the first 30 min of heating, and thus removed from the analysis since this was considered an induction heating period. Next, unreliable measurements (e.g., as a result of emptying the bladder or spasms) were removed as well as measurements for which the difference in average temperature 5 min before the event and at the event was larger than ±0.1 °C. A total number of 67 phase-amplitude steering events in 60 treatment sessions were found suitable for final analysis. This yielded a total number of 124 measurements suitable for evaluation: 38 in the vagina, 41 in the bladder, and 45 in the rectum.
Figure 2. Flow chart of the event selection process, representing the excluded treatment sessions, events, and measurements. Note that multiple events can occur in one treatment session and that measurements were evaluated for each individual event.
summarizes the numbers finally included in the analysis. A total number of 38 patients and 60 treatment sessions were included in the final analysis. Of the 67 phase-amplitude steering events, 43 were amplitude adaptations and 24 phase adaptations. shows the median, minimum, and maximum values of the measured temperature and (unscaled) simulated temperature and SAR, averaged over the thermocouple probe trajectory per location. Values were taken at the time of the phase-amplitude steering event. For all measurement locations, the median average temperature over the probe trajectories was typically around 40 °C. The median amount of applied total power at the time of the steering events was 600 W for cervical cancer patients and 675 W for bladder cancer patients.
Table 2. Summary of the numbers finally included in the analysis.
Table 3. Median, minimum and maximum values of the measured temperature and (unscaled) simulated temperature and SAR, averaged over the thermocouple probe trajectory per location. Values were taken at the time of the phase-amplitude steering event. The last column indicates the total amount of power.
Predictive value of simulated SAR for changes in measured temperature
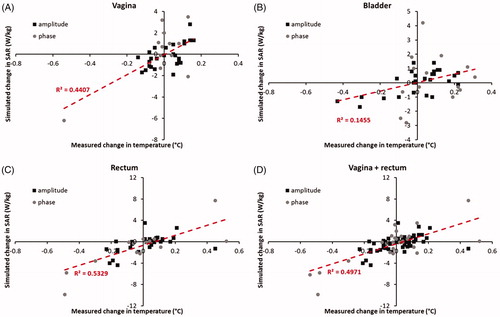
shows the correlation between measured changes in temperature and simulated changes in SAR after phase-amplitude steering for the vagina, bladder, and rectum, as well as for the vagina and rectum together. The R2 values are 0.44 and 0.53 (p < .001) for the vagina and rectum, respectively. For vagina and rectum together, this value is 0.50 (p < .001), demonstrating a fairly good predictive value of simulated changes in SAR for changes in measured temperature after phase-amplitude steering. For the bladder, the correlation is rather weak with an R2 of 0.15 (p < .05). This poor predictive value for the temperature change in the bladder can be explained by different thermal transport processes in the bladder compared with other tissues (see Discussion section).
Figure 3. Correlation between measured changes in temperature and simulated changes in SAR after phase-amplitude steering for the vagina, bladder, and rectum, as well as for the vagina and rectum together.
Predictive value of simulated temperature for changes in measured temperature
shows the correlation between measured and simulated changes in temperature after phase-amplitude steering for the vagina, bladder, and rectum, as well as for the vagina and rectum together. The R2 values are 0.55 and 0.66 (p < .001) for the vagina and the rectum, respectively. For vagina and rectum together, this value is 0.63 (p < .001), suggesting a better predictive value of simulated changes in temperature compared with simulated changes in SAR for changes in measured temperature after phase-amplitude steering. However, the number of measurements was not sufficient to demonstrate a significant difference in predictive value between simulated changes in SAR and temperature. For vagina and rectum together (83 measurements), the correlation coefficients were not significantly different (p = .24). The predictive value for changes in temperature of the bladder remains low with an R2 of 0.14 (p < .05).
Figure 4. Correlation between measured and simulated changes in temperature after phase-amplitude steering for the vagina, bladder, and rectum, as well as for the vagina and rectum together. The shaded green region indicates the region where simulated and measured differences correspond within ±0.1 °C.
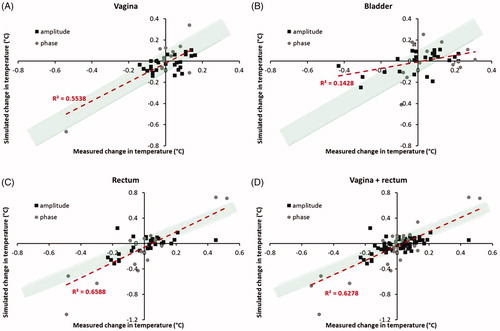
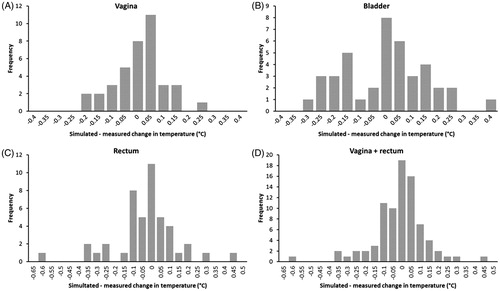
The plots in also demonstrate that the deviation between measured and predicted change in the temperature after phase-amplitude steering is accurate within ±0.1 °C for most events. This is illustrated more clearly by the histograms of the deviations plotted in . Overall, for vagina and rectum together, 76% of the events showed a deviation between predicted and measured the change in temperature of at most ±0.1 °C. For the vagina and rectum separately, these percentages were 79% and 73%, respectively. For the bladder, a larger number of events showed a deviation larger than ±0.1 °C, which is in accordance with the lower correlation between simulated and measured changes in temperature for the bladder, as observed above. At this location, 49% of the events showed a deviation between predicted and measured the change in temperature of at most ±0.1 °C.
Figure 5. Histograms of the deviations between simulated and measured changes in temperature after phase-amplitude steering for the vagina, bladder, and rectum, as well as for the vagina and rectum together.
Discussion
Results of this study showed that hyperthermia treatment planning can predict changes in local temperature after phase-amplitude steering. A previous simulation study by Canters et al suggested that SAR-based modeling is preferential for treatment planning-guided steering, since the uncertainties in thermal properties would cancel out the benefits of thermal modeling over SAR-based modeling [Citation37]. However, in addition to a previous modeling study indicating that, despite these uncertainties, thermal modeling is more robust than SAR-based modeling [Citation23], results of the present study show that simulated changes in both SAR and temperature correlate well with measured changes in temperature during treatments, thus indicating a good predictive value in a clinical setting. Although present results suggested an even a better correlation for simulated temperature changes, the difference was not significant. Generalization of these findings to other locoregional phased array heating systems (BSD-2000 Sigma-60 system [Citation5], the BSD-2000 Sigma-Eye system [Citation38], and the ALBA 4D system [Citation39]) is probably legitimate, since the principle of phase-amplitude steering to focus the electromagnetic energy and to avoid hot spots is technically the same for all these devices, regardless of the exact type and number of radiofrequency antennas [Citation40].
Reliable application of adaptive treatment planning during clinical hyperthermia requires a good quantitative correspondence between measurements and simulations for controlled and reproducible situations, i.e., in patient-mimicking phantoms. This is ensured by validation of the treatment planning software in combination with the heating system applied for specified phantom set-ups [Citation31,Citation41], as well as regular quality assurance measurements to monitor the stability of the heating characteristics of the system [Citation29]. Deviations between measurements and simulations should be in the order of the measurement accuracy. When combining the heating system with MR-thermometry, theoretical antenna profiles can be adapted using a Gauss–Newton method based on MR-thermometry measurements, to improve the quality of predicted heating patterns, if necessary [Citation42].
Since the use of changes in simulated temperature is more intuitive and there is a trend suggesting that simulated changes in temperature are more predictive for changes in measured temperature after phase-amplitude steering than changes in simulated SAR, temperature-based simulations are generally preferred for further on-line use of adaptive hyperthermia treatment planning. However, for some specific hot spot locations changes in simulated SAR might be a better predictor; e.g., for superficial hot spots at the skin near the bolus edges. At these locations, hot spots can be caused by sub-optimal contact between the water bolus and the patient. Since the treatment planning model assumes good contact between the skin and the water bolus and the bolus provides a very strong cooling, simulated skin temperatures are typically 15–20 °C. Therefore, unforeseen hot spots on the skin due to sub-optimal bolus contact might be easier to resolve with the assistance of predicted changes in simulated SAR, than by changes in simulated temperature. However, the decrease in SAR required to resolve a hot spot complaint could be difficult to determine beforehand. The aspect of resolving hot spots on the skin with the assistance of treatment planning should thus be investigated further in a clinical setting.
Good correlations between measured changes in temperature and simulated changes in SAR and temperature were observed both for the vagina and the rectum, although correlations were slightly (but not significantly) better for the rectum. This small difference could be explained by the fact that the vagina is located centrally in the pelvis, in or close to the heating focus. Phase-amplitude steering is in most cases applied in response to hot spots. Therefore, the effect of phase-amplitude steering on measured temperatures is typically lower near the target region, compared with more eccentrically located regions as the rectum (see ), which makes it somewhat more difficult to establish a good correlation. This also implies that good correlations are expected between simulated and actual temperature changes at typical treatment limiting hot spot locations, as these are generally also located more eccentrically during locoregional hyperthermia. This was not the subject of the present study but in another study, we evaluated the ability of treatment planning to suppress these hot spots and found that our planning was generally fairly accurate in suppressing these hot spots [Citation25]. The same was true for our ability to subsequently increase the tumor temperature [Citation28].
For the bladder, correlations between measured changes in temperature and simulated changes in SAR and temperature were rather weak. This can be explained by different thermal transport processes occurring in the bladder cavity, compared with other tissues, i.e., convective heat transport and the absence of blood perfusion in the bladder filling [Citation43]. In routine clinical treatment planning simulations, the bladder filling is segmented and modeled as solid perfused muscle tissue, which implies that modeled heat removal is faster than in reality and thus changes in temperature after adapting antenna settings also occur at a different time scale. The predictive value of treatment planning in the bladder can be improved by a physically correct model of the bladder, which includes convection, as developed by Schooneveldt et al. [Citation43]. However, at the moment, this convective model still requires a substantial amount of computation time and is, therefore, not yet suitable for on-line applications. Furthermore, although accurate modeling of the bladder is essential for some applications of treatment planning, such as retrospective reconstructions of 3D temperature distributions, it is probably less necessary for on-line assistance in phase-amplitude steering. Despite the poor predictive value of treatment planning for changes in the bladder temperature, treatment planning can still be helpful to determine antenna settings realizing a heating focus in the bladder for patients with bladder cancer. This is supported by a previous study, demonstrating a good correlation between the measured initial temperature rise in the bladder at the start of treatment and treatment planning [Citation22]. Moreover, treatment limiting hot spots are usually not reported in the bladder, so this poor predictive value is also not an issue for assistance in suppressing hot spots during treatment.
The present predictive value of simulated changes in SAR and temperature will be useful for clinical applications of phase-amplitude steering, as was already demonstrated in two feasibility studies on suppressing treatment limiting hot spots [Citation25] and improvement of the target temperature [Citation28]. Nevertheless, the clinical reliability could probably be further improved by more sophisticated SAR and thermal modeling, which is part of ongoing research. In the near future, literature-based dielectric properties will be replaced by a patient-specific 3D map of dielectric properties, reconstructed from MR imaging [Citation18]. These patient-specific values will improve both SAR and temperature predictions. The body core temperature was assumed constant in our study, but during locoregional heating, the systemic temperature might increase with −1 °C or more [Citation44]. The correlation between measured and simulated changes in temperature could improve further when the actual body core temperature is also taken into account. In the present simulations, fixed enhanced perfusion values were applied and previous research has shown that ignoring the temperature dependency of the perfusion values can lead to significant overestimation of the temperature [Citation45]. The impact of temperature-dependent perfusion values on the reliability of adaptive treatment planning is worth investigating. However, the use of temperature-dependent perfusion values will not necessarily improve the predictive value for this purpose since for adaptive treatment planning changes in simulated temperature are used as a predictor, rather than the absolute values. Furthermore, computation times will substantially increase when temperature-dependent perfusions are modeled, so the feasibility for on-line use should also be investigated. Alternatively, to reduce the impact of perfusion uncertainty, model parameters can be considered as stochastic variables [Citation46,Citation47]. This will yield expected temperature distributions and investigating the impact on the reliability of adaptive treatment planning would be valuable. Finally, including the influence of large discrete vessels will further improve thermal predictions and thereby possibly the predictive value of changes in simulated temperature. Although on-line simulations are possible [Citation12], this requires a patient-specific angiogram, obtained from an extra contrast-enhanced MRI scan, which should be translated into a vessel model. Therefore, including patient-specific vasculature in the models will make the preprocessing stage of treatment planning much more demanding, both for the patient as for those responsible for clinical treatment planning. To solve this problem, the applicability of a generalized vessel network, representing the largest thermally significant blood vessels, should be explored.
Future on-line use of (adaptive) treatment planning in clinical hyperthermia is expected to improve treatment quality by standardizing treatments as well as improvement in steering strategies. Currently, phase-amplitude steering is mainly based on the experience of the operator, which means that the treatment quality strongly depends on the experience of the operator and the steering guidelines used. Treatment planning-guided phase-amplitude steering will thus help to standardize treatments by making phase-amplitude steering less operator dependent [Citation48]. Furthermore, phase-amplitude steering strategies optimized by treatment planning could be more effective compared with standard steering strategies performed by the operators [Citation28]. This clinical application of hyperthermia treatment planning is the subject of ongoing research.
Conclusion
Hyperthermia treatment planning can accurately predict changes in average temperature in the tumor and at other locations after phase-amplitude steering. Both simulated SAR and temperature changes are correlated with the measured temperature changes. This allows the standard use of treatment planning in on-line assistance guiding phase-amplitude steering to optimize hyperthermia treatments.
Disclosure statement
No potential conflict of interest was reported by the authors.
Additional information
Funding
Related Research Data
References
- Van der Zee J, González González D, Van Rhoon GC, et al. Comparison of radiotherapy alone with radiotherapy plus hyperthermia in locally advanced pelvic tumours: a prospective, randomised, multicentre trial. Dutch Deep Hyperthermia Group. Lancet. 2000;355:1119–1125.
- Wust P, Rau B, Gellerman J, et al. Radiochemotherapy and hyperthermia in the treatment of rectal cancer. Recent Results Cancer Res. 1998;146:175–191.
- Inman BA, Stauffer PR, Craciunescu OA, et al. A pilot clinical trial of intravesical mitomycin-C and external deep pelvic hyperthermia for non-muscle-invasive bladder cancer. Int J Hyperthermia. 2014;30:171–175.
- Geijsen ED, De Reijke TM, Koning CCE, et al. Combining mitomycin C and regional 70 MHz hyperthermia in patients with nonmuscle invasive bladder cancer: a pilot study. J Urol. 2015;194:1202–1208.
- Turner PF, Tumeh A, Schaefermeyer T. BSD-2000 approach for deep local and regional hyperthermia: physics and technology. Strahlenther Onkol. 1989;165:738–741.
- Crezee J, Van Haaren PMA, Westendorp H, et al. Improving locoregional hyperthermia delivery using the 3-D controlled AMC-8 phased array hyperthermia system: a preclinical study. Int J Hyperthermia. 2009;25:581–592.
- Paulsen KD, Geimer S, Tang J, et al. Optimization of pelvic heating rate distributions with electromagnetic phased arrays. Int J Hyperthermia. 1999;15:157–186.
- Franckena M, Fatehi D, de Bruijne M, et al. Hyperthermia dose–effect relationship in 420 patients with cervical cancer treated with combined radiotherapy and hyperthermia. Eur J Cancer. 2009;45:1969–1978.
- Sapareto SA, Dewey WC. Thermal dose determination in cancer therapy. Int J Radiat Oncol Biol Phys. 1984;10:787–800.
- Kok HP, Wust P, Stauffer PR, et al. Current state of the art of regional hyperthermia treatment planning: a review. Radiat Oncol. 2015;10:196.
- Kok HP, Van Haaren PMA, van de Kamer JB, et al. High-resolution temperature-based optimization for hyperthermia treatment planning. Phys Med Biol. 2005;50:3127–3141.
- Kok HP, Van den Berg CAT, Bel A, et al. Fast thermal simulations and temperature optimization for hyperthermia treatment planning, including realistic 3D vessel networks. Med Phys. 2013;40:103303.
- Wiersma J, Van Maarseveen RAM, van Dijk JDP. A flexible optimization tool for hyperthermia treatments with RF phased array systems. Int J Hyperthermia. 2002;18:73–85.
- ]. Das SK, Clegg ST, Samulski TV. Computational techniques for fast hyperthermia temperature optimization. Med Phys. 1999;26:319–328.
- Das SK, Clegg ST, Samulski TV. Electromagnetic thermal therapy power optimization for multiple source applicators. Int J Hyperthermia. 1999;15:291–308.
- Bardati F, Borrani A, Gerardino A, et al. SAR optimization in a phased array radiofrequency hyperthermia system. IEEE Trans Biomed Eng. 1995;42:1201–1207.
- Bardati F, Tognolatti P. Hyperthermia phased arrays pre-treatment evaluation. Int J Hyperthermia. 2016;32:911–922.
- Balidemaj E, Kok HP, Schooneveldt G, et al. Hyperthermia treatment planning for cervical cancer patients based on electrical conductivity tissue properties acquired in vivo with EPT at 3 T MRI. Int J Hyperthermia. 2016;32:558–568.
- Van den Berg CAT, van de Kamer JB, De Leeuw AAC, et al. Towards patient specific thermal modelling of the prostate. Phys Med Biol. 2006;51:809–825.
- Gabriel C, Gabriel S, Corthout E. The dielectric properties of biological tissues: I. Literature survey. Phys Med Biol. 1996;41:2231–2249.
- Van Haaren PM, Hulshof MC, Kok HP, et al. Relation between body size and temperatures during locoregional hyperthermia of oesophageal cancer patients. Int J Hyperthermia. 2008;24:663–674.
- Kok HP, Ciampa S, De Kroon-Oldenhof R, et al. Toward on-line adaptive hyperthermia treatment planning: correlation between measured and simulated specific absorption rate changes caused by phase steering in patients. Int J Radiat Oncol Biol Phys. 2014;90:438–445.
- De Greef M, Kok HP, Correia D, et al. Optimization in hyperthermia treatment planning: the impact of tissue perfusion uncertainty. Med Phys. 2010;37:4540–4550.
- Sreenivasa G, Gellermann J, Rau B, et al. Clinical use of the hyperthermia treatment planning system HyperPlan to predict effectiveness and toxicity. Int J Radiat Oncol Biol Phys. 2003;55:407–419.
- Kok HP, Korshuize-van Straten L, Bakker A, et al. On-line adaptive hyperthermia treatment planning during locoregional heating to suppress treatment limiting hot spots. Int J Radiat Oncol Biol Phys. 2017;99:1039–1047.
- Canters RA, Franckena M, Van der Zee J, et al. Complaint-adaptive power density optimization as a tool for HTP-guided steering in deep hyperthermia treatment of pelvic tumors. Phys Med Biol. 2008;53:6799–6820.
- Li Z, Vogel M, Maccarini PF, et al. Improved hyperthermia treatment control using SAR/temperature simulation and PRFS magnetic resonance thermal imaging. Int J Hyperthermia. 2011;27:86–99.
- Kok HP, Korshuize-van Straten L, Bakker A, et al. Feasibility of on-line temperature-based hyperthermia treatment planning to improve tumour temperatures during locoregional hyperthermia. Int J Hyperthermia. 2017;1–10. https://doi.org/10.1080/02656736.2017.1400120
- Bruggmoser G, Bauchowitz S, Canters R, et al. Guideline for the clinical application, documentation and analysis of clinical studies for regional deep hyperthermia: quality management in regional deep hyperthermia. Strahlenther Onkol. 2012;188:198–211.
- De Leeuw AAC, Crezee J, Lagendijk JJW. Temperature and SAR measurements in deep-body hyperthermia with thermocouple thermometry. Int J Hyperthermia. 1993;9:685–697.
- Kok HP, Kotte ANTJ, Crezee J. Planning, optimisation and evaluation of hyperthermia treatments. Int J Hyperthermia. 2017;33:593–607.
- Hornsleth SN, Mella O, Dahl O. A new segmentation algorithm for finite difference based treatment planning systems. In: Franconi C, Arcangeli G, Cavaliere R, editors. Hyperthermic oncology. Vol. 2. Rome, Italy: Tor Vergata; 1996. p. 521–523.
- ESHO Taskgroup Committee. Treatment planning and modelling in hyperthermia, a task group report of the European Society for Hyperthermic Oncology. Rome, Italy: Tor Vergata; 1992.
- James BJ, Sullivan DM. Creation of 3-dimensional patient models for hyperthermia treatment planning. IEEE Trans Biomed Eng. 1992;39:238–242.
- Taflove A, Hagness SC. Computational electrodynamics. 2nd ed. Boston, London: Artech House; 2000.
- Pennes HH. Analysis of tissue and arterial blood temperatures in the resting human forearm. 1948. J Appl Physiol. 1948;1:93–122.
- Canters RA, Paulides MM, Franckena M, et al. Benefit of replacing the sigma-60 by the sigma-eye applicator: a Monte Carlo-based uncertainty analysis. Strahlenther Onkol. 2013;189:74–80.
- Wust P, Seebass M, Nadobny J, et al. Simulation studies promote technological development of radiofrequency phased array hyperthermia. Int J Hyperthermia. 1996;12:477–494.
- ALBA, www.albahyperthermia.com; 2018.
- Schneider CJ, van Dijk JD, De Leeuw AA, et al. Quality assurance in various radiative hyperthermia systems applying a phantom with LED matrix. Int J Hyperthermia. 1994;10:733–747.
- Wust P, Beck R, Berger J, et al. Electric field distributions in a phased-array applicator with 12 channels: measurements and numerical simulations. Med Phys. 2000;27:2565–2579.
- Weihrauch M, Wust P, Weiser M, et al. Adaptation of antenna profiles for control of MR guided hyperthermia (HT) in a hybrid MR-HT system. Med Phys. 2007;34:4717–4725.
- Schooneveldt G, Kok HP, Balidemaj E, et al. Improving hyperthermia treatment planning for the pelvis by accurate fluid modelling. Med Phys. 2016;43:5442–5452.
- Van Es CA, Wyrdeman HK, de Leeuw AA, et al. Regional hyperthermia of pelvic tumours using the Utrecht ‘Coaxial TEM’ system: a feasibility study. Int J Hyperthermia. 1995;11:173–186.
- De Greef M, Kok HP, Correia D, et al. Uncertainty in hyperthermia treatment planning: the need for robust system design. Phys Med Biol. 2011;56:3233–3250.
- Prakash P, Deng G, Converse MC, et al. Design optimization of a robust sleeve antenna for hepatic microwave ablation. Phys Med Biol. 2008;53:1057–1069.
- Dos Santos I, Haemmerich D, Schutt D, et al. Probabilistic finite element analysis of radiofrequency liver ablation using the unscented transform. Phys Med Biol. 2009;54:627–640.
- Van der Wal E, Franckena M, Wielheesen DH, et al. Steering in locoregional deep hyperthermia: evaluation of common practice with 3D-planning. Int J Hyperthermia. 2008;24:682–693.