
 ?Mathematical formulae have been encoded as MathML and are displayed in this HTML version using MathJax in order to improve their display. Uncheck the box to turn MathJax off. This feature requires Javascript. Click on a formula to zoom.
Abstract
The present work is concerned with the numerical investigation of the thermal response of tissue-mimicking biological phantom(s) subjected to high intensity focused ultrasound (HIFU). Simulations have been performed on the 3-dimensional physical domain for two-layered as well as multi-layered medium consisting of water and liver tissue. Local pressure distribution within the body of the phantom has been calculated by solving the complete full-wave nonlinear form of Westervelt equation. The solution of the pressure wave equation has been coupled with Pennes bioheat transfer equation to determine the full field temperature distribution. Results in the form of pressure fields, temperature distributions and the corresponding thermal dosage in the targeted region of the tissue domain have been presented. Magnitudes of the maximum pressure (and hence the resultant temperature levels) in the focal region as obtained using the nonlinear form of Westervelt equation are found to be significantly higher than that determined based on the linear form of the equation. Compared to water, wherein the acoustic intensity is maximum, the addition of sub-layers of skin, fat, and muscle into water resulted in the reduction of the peak intensity and also shifted the intensity profiles along the direction of propagation of the acoustic waves. However, addition of liver tissue into water led to the shifting of intensity profile in the opposite direction i.e., towards the transducer. The results further reveal that due to the dependence of attenuation coefficient on the source frequency, the temperature at the focal region increases with an increase in the transducer frequency. The work is further extended from single lesion to multiple lesion generation through controlled movement of the transducer and the resultant transient full field temperature distribution has been presented. The concerned observations highlight the need of optimizing the thermal energy for each lesion, the inter spatial distance between different lesions and the delay time so as to ensure minimal thermal damage to the surrounding healthy cells as well as to reduce the total treatment duration.
1. Introduction
High intensity focused ultrasound (HIFU) holds its importance in therapeutic applications because of its potential to achieve selective destruction of the targeted region in a calculated and controlled manner. This technique is one of the minimal invasive/non-invasive methods, which generates heat in the body when the targeted delivery of ultrasound waves causes a sudden change in temperature (more than 56 °C) of the local tissue environment [Citation1]. The central idea behind HIFU-based thermal therapy approach is the conversion of the acoustic energy into its thermal form. In the localized region, wherein the high-intensity ultrasound waves get focused, the absorption of the acoustic energy leads to an increase in the temperature and depending upon the operating parameters, temperature levels required for complete necrosis of the embedded abnormal cells may be achieved. In this context, one of the major challenges is the selective destruction of the abnormal cells (malignant and/or benign) without any unwanted thermal damage to the surrounding healthy/normal cells. Thus, it becomes important to develop a detailed understanding of the whole field temperature distribution within the body of the HIFU- subjected tissue sample.
Generally, HIFU transducers are excited at a single frequency that lies in the range of 0.5–3.5 MHz depending on their usage in clinical application [Citation2]. If the sound wave propagates linearly through the tissue volume, the achievable heating rates depend on the factors such as incident ultrasound intensity, acoustical properties of the medium (e.g., attenuation or absorption coefficient) etc. [Citation3]. Under operating conditions wherein HIFU transducers produce relatively higher levels of intensities and also due to the dependence of absorption coefficient on the working frequencies, the propagation of the acoustic waves in the medium becomes a nonlinear phenomenon. The nonlinear effects lead to the generation of higher harmonics, which in turn, lead to higher attenuation and heat deposition in the tissue, primarily in the focal region [Citation4,Citation5]. The importance of such nonlinear effects as one of the possible means to enhance the ultrasound-based thermal effects in a controlled manner has been realized by a range of researchers in the past [Citation6]. In this context, various attempts have been made to couple the solution of the acoustic model with an appropriate thermal model so as to determine the resultant temperature distributions. However, the literature shows that such studies have primarily been limited to the linear form of acoustic waves propagation model [Citation7–10]. The studies concerned with the development of analytical and/or numerical models for understanding the phenomenon of nonlinear propagation of ultrasound waves in the tissue medium coupled with an appropriate thermal model are still limited. In addition to nonlinear effects, the loss of energy depends on the nature of the physical process, which includes viscous losses, thermal conduction and various forms of molecular relaxation processes [Citation11]. In this context, the Khokhlov–Zabolotskaya–Kuznetsov (KZK) equation, which is a nonlinear parabolic equation, has often been employed to predict the pressure distribution in soft tissue medium obtained as a result of directional sound beams [Citation12]. The potential advantages of the KZK equation-based approach include significantly reduced simulation time for obtaining the desired solution with relatively good accuracies due to the retarded time co-ordinate [Citation13]. As a result, the KZK equation has found its applicability in wide range of applications in recent times. However, the application of KZK equation is limited by the constraint that it does not take into account the effects of reflection and scattering and also it can only be applied for transducers with small aperture angles [Citation14]. Moreover, this equation cannot be applied to more realistic physical models that take into account the multi-layered nature of the biological tissues samples [Citation15].
With this background, in attempt to couple the nonlinear effects of acoustic wave propagation on the resultant thermal field in the tissue domain (single as well as multi-layered), the present work employs the full wave nonlinear form of Westervelt equation to determine the acoustic pressure distribution in the multi-layered tissue medium. The approach becomes important as the governing equation takes into account the effects of diffraction, absorption as well as nonlinear propagation. In order to control the reflection from the opposite boundary of the domain, the concept of Perfectly Matched Layer (PML) has been implemented at the boundary surface. The results of Westervelt equation (in the form of pressure distribution) have been coupled with the Pennes bio-heat transfer equation to obtain the full field temperature distribution calculated in the tissue medium. It is also to be mentioned that a majority of studies reported in the literature are primarily limited to the generation of single lesion only and the associated thermal effects. In this direction, as an advancement, the present work is extended to the generation of multiple lesions by controlled movement of the transducer.
2. Physical and numerical models
2.1. Propagation of acoustic wave into the tissue medium
Propagation of ultrasound waves into the tissue medium causes its particles to oscillate back and forth and results in a series of compression and rarefaction (alternating cycles of increased and reduced pressures respectively) of the medium [Citation16]. As the soft biological tissues are thermo-viscous in nature, increase in pressure increases the local temperature of the tissue domain leading to an increase in the local speed of sound in the medium. As a result, the wave during the high-pressure phase of oscillation travels faster than the one during the lower pressure phase. Thus, the traveling waves, which initially carry energy at the fundamental frequency, slowly move to the higher harmonics. This results in the faster travel of the peaks of the wave than the troughs, and the wavefront gets as steepened as a sawtooth wave.
Nonlinear acoustics play an important role in distortion of the waveform during transmission and can be described by a parameter, B/A, which is basically the ratio of the second and the first terms in the Taylor series expansion of pressure as a function of density. The time and distance of propagation of the traveling wave also influence the extent of medium distortion [Citation17]. The nonlinear effects lead to the generation of harmonics that result in high attenuation and heat deposition in the tissue, mainly in the focal region. Full wave Westervelt equation, which is based on the effects of diffraction, absorption, and nonlinear propagation, is given by [Citation18]:
(1)
(1)
In EquationEquation (1)(1)
(1) above, p denotes the local sound pressure,
denotes the coefficient of nonlinearity and δ denotes the diffusivity of sound resulting from thermo-viscous fluid viscosity and heat conduction and can be expressed as [Citation19]:
(2)
(2)
where, α is the acoustic absorption coefficient and ω is the source angular frequency. For most tissues, the absorption coefficient is related to the ultrasound frequency via a power law of the form:
(3)
(3)
Here f is the ultrasound source frequency, a and b are the tissue-specific constants [Citation20]. From the above power law, it is seen that the absorption coefficient increases with an increase in the ultrasound excitation frequency. Higher absorption coefficient implies higher heat deposition. On the other hand, higher attenuation results in the reduced penetration depth. The transmission of ultrasound energy within two tissue layers depends particularly on the density, speed of sound and the thickness of each layer. In EquationEquation (1)(1)
(1) , the first two terms in RHS of the equation describe the linear lossless wave which gets transmitted at a small-signal sound speed. The third term represents attenuation due to thermal conductivity and fluid viscosity. The last term describes the acoustic nonlinearity, which explains the distortion of a wave due to the nonlinear effects and affects the thermal and mechanical changes inside the tissue medium [Citation21].
2.2. Thermal model for temperature distribution
In order to determine the temperature distribution in the tissue domain, solution of EquationEquation (1)(1)
(1) , which mathematically models the phenomenon of acoustic wave propagation in the physical domain, needs to be coupled with an appropriate bio-heat transfer model. In the present work, the solution of the full wave Westervelt equation (EquationEquation (1)
(1)
(1) ) has been coupled with the Pennes bio-heat transfer equation [Citation22] (EquationEquation (4)
(4)
(4) , given below):
(4)
(4)
In EquationEquation (4)(4)
(4) , ρt, Ct, and k are density, specific heat and the thermal conductivity of the tissue, respectively. ρb and Cb are respectively the density and specific heat of blood and
is the blood perfusion rate. T and Tart respectively represent the tissue and arterial blood temperatures. In EquationEquation (4)
(4)
(4) above, Q represents the volumetric heat generation due to the absorption of acoustic intensity in the tissue domain and can be calculated by [Citation23,Citation24]:
(5)
(5)
For the ablation of the diseased tissue, heat is generated in the body through the absorption of ultrasound energy. The extent of thermal damage of the tissue depends on the duration of exposure and the final temperature levels reached in the process [Citation25]. Sapareto and Dewey proposed an empirical relationship for the calculation of the thermal dose from temperature-time history. This equation uses the numerical integration of temperature with the time for determining the equivalent thermal dose at the reference temperature [Citation26,Citation27].
(6)
(6)
where, Tref is the reference temperature. In general, the reference temperature is chosen to be equal to 43 °C as this is the standard temperature that is commonly used in various experimental thermal data. The value of R (iso-dose constant) has been chosen based on the animal experiments performed in the literature [Citation26].
(7)
(7)
For nearly complete necrosis of the biological tissues, TD needs to be in the range of 25 min to 240 min [Citation10]. Ultimately, the thermal dose calculation is required to predict the dimensions of lesions generated in the HIFU therapy.
3. Numerical methodology
3.1. Computational domain
Numerical simulations have been performed on a 3 D Cartesian domain (symmetric about the z-axis) with a volume of 10 cm3. Schematic drawing of the physical domain considered in the present work has been shown in . As shown, the direction of propagation of the acoustic waves (originating from the transducer) has been set along the z-direction. The space between tissue and transducer is filled by water medium. Based on the number of layers present in the tissue sample, simulations have been performed on two-layered medium (consisting of water and liver tissues) and multi-layered medium (wherein layers of water, skin, fat, muscle, and liver tissue have been considered). These two domains, with appropriate dimensions, have schematically been shown in . In order to control the reflection of acoustic waves from the interior of the boundary surface, a perfectly matched layer (PML) of 3 mm thickness has been added in the domain for calculating the acoustic pressure.
Figure 1. (a) Schematic of the HIFU-subjected tissue phantom geometry for simulations. (b) Schematics of ZX plane (axis-symmetric along z-axis) around y = 0: (b.i) two-layered medium, (b.ii) multi-layered medium and (b.iii) multi-layered with inhomogeneity. (c) Boundary conditions for pressure (c.i) and temperature (c.ii). (All dimensions are in cm).
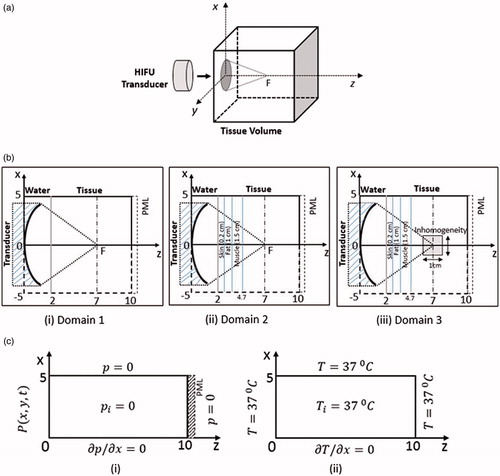
In addition to homogeneous samples, simulations have also been performed on non-homogeneous tissue phantoms wherein an inhomogeneity has been considered to be embedded inside an otherwise homogeneous multi-layered tissue phantom. This configuration has been schematically depicted in . As shown, an optical inhomogeneity of volume 1 cm3, has been considered to be present in the layer of the liver tissues. In physical terms, the optical inhomogeneity numerically simulates the presence of abnormal cells (malignant and/or benign) present in an otherwise homogenous domain. Thus, the thermo-physical properties of the embedded inhomogeneity have been kept identical to that of the cancerous cells, as documented in the literature [Citation10].
3.2. Initial and boundary conditions
The present section discusses the initial and boundary conditions that the computational domain has been subjected to for solving the governing equations presented in the previous section. In any given physical domain considered, the acoustic pressure distribution has been determined through the solution of the Westervelt equation formulated in 3 D Cartesian space coordinate. The input signal from a focused circular transducer working on a single frequency has been modeled using planar pressure source approximation [Citation28, Citation29]. Pressure produced by the transducer (placed at z = 0) has been calculated using the following expression:
(8)
(8)
where p0 is the source pressure amplitude and F(t) is taken as sin(ωt). As mentioned, for Cartesian space coordinate,
and
, where α denotes the aperture angle, a is the radius of the transducer and d denotes the focal length. summarizes the parameters used for the source transducer used in the present work. As presented in the table, the transducer frequency has been set as 1.0 MHz. It is worth mentioning here that frequencies in the range of 0.8–1.6 MHz are commonly employed for liver cancer applications i.e., for the treatment of abnormal cells embedded relatively deep in the biological samples [Citation3]. Furthermore, the source pressure oscillates sinusoidally in the range of +0.5 MPa to −0.5 MPa (peak to peak). The choice of the range of source pressure employed has been made to ensure that the maximum temperatures achieved in the focal region do not exceed 100 °C and hence to avoid any possibility of cavitation effects.
Table 1. Transducer Parameters.
shows the schematic representation of the computational domain depicting the initial and boundary conditions used for numerically solving the Westervelt equation. As shown, initially, throughout the body of the physical domain, the pressure and its derivative with respect to time have been set at zero (i.e.,). At the transducer surface, i.e., at z = 0, the pressure distribution
has been obtained using EquationEquation (8)
(8)
(8) . The other boundary conditions have been shown in .i). As the computational domain is considered axis-symmetric around the z-axis, the simulations have only been performed for one quarter of the total size of the computational domain (i.e.,
,
and
) to reduce the computational time.
In order to control the reflection from the opposite boundary of the domain, the concept of Perfectly Matched Layer (PML) has been implemented at the boundary surface. This condition of PML is utilized at the end of the domain, thus has been taken to be equal to zero, as the layer ultimately decays the solution to almost zero. It is to be mentioned here that the PML is a layer of artificial absorbing material that is placed adjacent to the edges of the grid to change the oscillating solution into an exponentially decaying solution without any reflection [Citation30]. The following steps have been followed for deriving the wave propagation into the PML:
Fourier transform of the 2nd order linear wave equation.
PML transformation of
Introduce new auxiliary variables
and
Truncate the domain.
Inverse transform to convert the Fourier domain back into the time domain with PML absorbing boundaries in the z-direction.
In equation form, the PML can be expressed as [Citation31]
(9)
(9)
(10)
(10)
(11)
(11)
Where,
and
are the auxiliary variables. The conductivity profile of the PML [Citation31] is given by
(12)
(12)
where,
is the PML thickness, m is the order and
is the reflection of the PML at normal incidence. These parameters are optimized and taken for 100 matching layers and thus m = 3 and
have been considered in the present simulations [Citation31]. The number of matching layers depends on the requirement of the extent of the pulse absorption.
Similarly, the initial temperature of the computational domain has been taken as the normal body temperature, i.e., 37 °C and other boundary conditions have been shown in . Acoustic and the thermophysical properties for various computational domains considered in the present study have been summarized in [Citation14].
Table 2. Acoustic and thermo-physical properties.
3.3. Grid independence
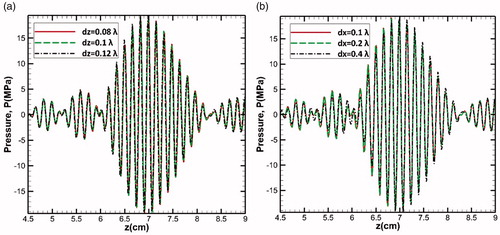
Governing equations (defined in 3 D Cartesian coordinate system) along with the initial and boundary conditions have been discretized using explicit finite difference scheme in time domain [Citation32,Citation33]. A detailed grid independence study has been performed before converging to an optimum grid size employed for the detailed thermal investigation of HIFU-subjected biological tissue phantoms. Results of the grid independence study have briefly been discussed here. show the variations of pressure with respect to the axial direction (z) for different grid sizes Δz and Δx respectively expressed in terms of the sound wavelength (λ = c/f, where f is the driving frequency). In the present study, an optimized grid size of Δz = 0.1λ and Δx = Δy = 0.2λ has been considered. Also, the discretization step size in time for solving the Westervelt equation (for pressure field) has been set as Δt = 0.01/f = 10−8 s while for temperature field distribution, the time step of Δt = 0.001 s has been considered. The difference in the two time scales employed is to be attributed to the multi-physics numerical modeling wherein the acoustic wave takes about microseconds (50–60 µs in this study) to reach the targeted area. On the other hand, the temperature changes can only be observed in seconds (limited by the thermal diffusivity of the medium considered). For PML layer, all the grid sizes remain same, except Δz that has been taken as 0.1λ/5, so that a total number of 100 layers can be introduced within PML thickness and hence can have better control on reflection. The complete code has been written in C++ programming language on a computer with the following specifications: RAM 16.0 GB, 64-bit operating system processor Intel (R) Core (TM) i7-2600K CPU @ 3.40 GHz.
Figure 2. Pressure variation with respect to axial direction (along the direction of propagation of the ultrasound waves) for different grid sizes in space (a) for different dz (b) for different dx, to optimise the discretized step size in space.
4. Results and discussion
4.1. Verification of computational method
The numerical methodology developed in the present work has been verified against the known available solutions available in the literature. For the verification studies, the linear acoustic pressure field obtained through the numerical solution of the developed numerical model (based on 3D Westervelt equation) has been compared with the results obtained by the analytical solution of Rayleigh integral for planer source approximation [Citation28]. illustrates the time (a) and space variation (b) of acoustic pressure in the water medium for the source pressure of po = 0.5 MPa and transducer frequency f = 1 MHz. It can be clearly seen that both the pressure variations show a good agreement between the present numerical simulations and the analytical solution. As expected, the peak of acoustic pressure is highest at the focal spot due to the focused nature of the HIFU (z = 7.0 cm, ).
Figure 3. Comparison of the numerical solution of Westervelt equation as obtained in the present work with that of the analytical Rayleigh integral solution given by Hamilton [Citation28]; (a) time and (b) space variation of acoustic pressure in water medium.
![Figure 3. Comparison of the numerical solution of Westervelt equation as obtained in the present work with that of the analytical Rayleigh integral solution given by Hamilton [Citation28]; (a) time and (b) space variation of acoustic pressure in water medium.](/cms/asset/8607ff58-fd77-4a78-b8f1-47a936546abf/ihyt_a_1506166_f0003_c.jpg)
4.2. Thermal response of the HIFU- subjected two-layered homogeneous medium
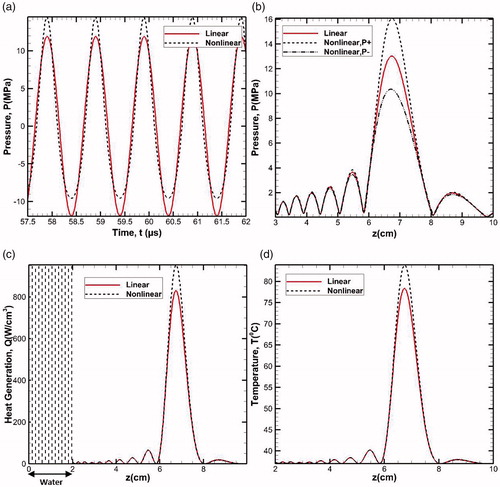
The present section discusses the results of the numerical simulations performed for understanding the thermal response of two-layered homogeneous medium (physical domain without any presence of inhomogeneity) that has been subjected to high intensity focused ultrasound. The homogeneous two-layered tissue phantom comprises of the layers of water and liver tissue. The schematic representation of the physical domain has earlier been shown in (Domain 1). Here, the effects of nonlinearity and attenuation have also been taken into account. shows the axial distribution (z-direction) of peak compressional and rarefactional pressures as obtained through the solution of linear and nonlinear forms of Westervelt equation. It is to be seen that due to the nonlinear nature of propagation of sound waves, the magnitude of nonlinear peak positive pressure (P+=16.08 MPa) is significantly higher than the corresponding peak negative pressure (P- = 10.36 MPa) in the focal region (z = 7 cm). On the other hand, linear Westervelt equation predicts identical values for the compression and rarefaction pressure distributions (P = 13.03 MPa). These results show that the nonlinear effects are concentrated primarily over a small region spread on either side of the focal spot (focal area) of the soft tissue.
Figure 4. Nonlinear peak positive and peak negative pressure distribution compared with linear pressure distribution (a) with respect to time and (b) along the axial distance, (c) volumetric heat generation and (d) temperature distribution along the axial distance.
A comparison of the profiles shown in brings out the clear differences in the linear and nonlinear forms of the solutions of full wave Westervelt equation. The observed differences are predominately concentrated in the close vicinity of the focal region and the profiles nearly overlap in the regions away from the focal spot. The peak (+ve) pressure predicted based on the nonlinear Westervelt equation is considerably higher in the focal region in comparison with that predicted through the linear model. The possible implications of these observations on the efficiency of the HIFU based non-invasive destruction of abnormal cells may be realized in the form of significant differences in the resultant temperature levels predicted by the two approaches. The strong nonlinear effects enhance the heat-affected zone. Thus, for the same specification of the source used, while relatively higher peak pressures can be realized with the nonlinear model, there is also a possibility of experiencing some other phenomena such as boiling, cavitation etc. [Citation34].
Volumetric heat generation has been calculated through temporal averaging of nonlinear propagation of wave for one time period and was kept steady for the temperature calculation until the system (transducer) is kept on. Following this approach, the pressure distribution calculated in Domain 1 has been employed to calculate the variation of volumetric heat generation due to the attenuation of the propagating wave. illustrates the axial variations of the linear and nonlinear volumetric heat generation in the tissue domain along the center line of the transducer. It is to be noted that the attenuation coefficient for water is significantly low, hence, the magnitude of volumetric heat generation in the region i.e., for is almost zero (Q = 0). It is worth mentioning here that in clinical applications, this is one of the primary reasons behind the usage of ultrasound gels, which have their acoustic impedance almost close to that of water, as this layer drastically eliminates the possibility of any reflection of the ultrasound waves that would otherwise occur in the case of air-tissue interface. shows the gradual build-up of the net volumetric heat generation term beyond the water layer and peaks in the focal region of the transducer (z = 7 cm). Further, as expected, the nonlinear form of the Westervelt equation predicts relatively higher amount of heat generation in the focal region, in comparison with that of the linear profile.
The volumetric heat generated due to the absorption of the ultrasound wave intensity in the medium leads to a rise in temperature of the physical domain, a phenomenon that forms the basis of the HIFU-based therapeutic techniques. With the volumetric heat distribution known, EquationEquation (4)(4)
(4) has been solved to determine the temperature distribution within the body of the physical domain. Temperature variation has been predicted at the focus of the simulation geometry for a total sonication period of 0.2 s, (). As can be seen, the peak of temperature is realized at the focal spot and its value is ≈84 °C, which is practically sufficient for complete necrosis of the abnormal cells. As expected, the nonlinear theory predicts higher temperature peak at the focal spot compared to the linear model.
4.3. Effect of various layers on the focal intensity
Acoustic wave propagates into the target volume through various tissue layers with different acoustic and thermal properties. Thus, to simulate the more realistic model of the tissue sample, multilayer modeling (Domain 2, ) has been carried out. To investigate the layers and liver tissue effect, HIFU intensity maps for various combinations (water, water + tissue, water + layer + water and water + layer + tissue) have been shown in . Since water is a lossless medium, the acoustic energy is maximum if solely water is considered. Introducing a layer consisting of sub-layers of skin (2 mm), fat (1 cm), muscle (1.5 cm) in water reduces the peak acoustic energy and also slightly shifts the profile in the direction of the wave propagation (away from the transducer) (). However, the addition of liver tissue into the water medium (water + tissue) shifts the profile in the direction opposite to that of the propagating wave i.e., towards the transducer with further reduction in the peak. Furthermore, considering Domain 2, which consists of water, layers of fat, and liver tissue, shift in the profile is in the direction of wave propagation, which is relatively higher in comparison with the shift that is realized for only water and tissue domain (Domain 1). This concludes that the overall effect of the layer is the shift of the intensity profile in the direction of wave propagation with relatively reduced peak.
Figure 5. Intensity plot along the axial distance for different domains. The layer consists of skin (0.2 cm) + fat (1 cm) + muscle (1.5 cm). In all the cases, 2 cm of water is placed between transducer and the medium.
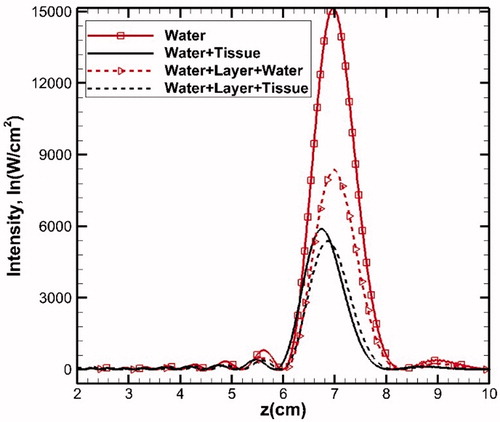
Table 3. Quantitative analysis of various medium intensity.
To check the individual effect of fat and muscle layers on the acoustic intensity, these two layers, with different thicknesses, have been considered separately. If a particular layer is sandwiched between the lossless medium i.e., water and the homogenous liver tissue, any change in the intensity profile will primarily depend on the properties of the sandwiched layer. illustrates the individual effects in lossless and tissue medium. In all the cases, the gap between the transducer and tissue medium is filled with water. As seen in , a single layer of fat or muscle with different thicknesses, when combined with water, results into an opposite shift (with respect to the focal point) of the intensity profiles. However, in both cases, the peak of the acoustic energy reduces with an increase in the layer thickness due to higher absorption. The observed trend may be explained on the basis of the differences in the speed of propagation of the acoustic waves in the layers of fat and muscle compared to water. The speed of propagation of acoustic waves in fat is lower compared to that in water. Thus, with an increase in the thickness of the fat layer, the point of maximum acoustic intensity shifts away from the transducer. However, relatively higher propagation speed in muscle layer leads to a shift of profile towards the transducer. Furthermore, the differences in the absorption coefficient of these two layers also lead to the corresponding changes in the peak intensity values.
Figure 6. Intensity plots along the axial distance to show the effect of single layer (fat/muscle) sandwiched between (a) two layers of water and (b) water and liver tissue. For better clarity, the layer configurations have schematically been shown in both the figures.
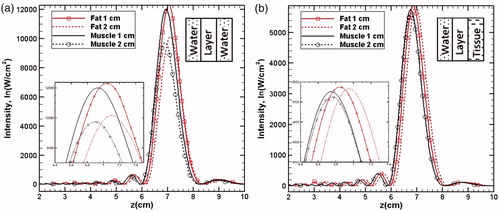
shows the profiles of intensities when the single layer of fat/muscle has been sandwiched between water and liver tissue (this combination is different from that presented in wherein the single layer was combined only with water). Compared to the profiles shown in , a significant reduction in the magnitude of peak intensity for any given layer is to be seen. In addition, also shows that the profiles corresponding to the fat layer show the similar nature of shift (away from the transducer) as was seen in the case of the combination shown in . However, the corresponding shift in the profiles of the acoustic waves in muscles is ≈0.99 times of that in the liver tissue.
4.4. Effect of source parameters: samples with embedded inhomogeneity
Discussions presented in the previous sections pertaining to the cases wherein source pressure and the transducer frequency were fixed at 0.5 MPa and 1 MHz respectively for Domains 1 and 2. In order to quantify the influence of variations in these parameters on the resultant temperature field, simulations have been conducted for different source pressures, po (0.2, 0.5 and 0.7 MPa) and frequencies, f (0.8, 1.0 and 1.2 MHz) for Domain 3 ()1. With reference to , the embedded inhomogeneity numerically simulates the local presence of cancerous cells in the body. The acoustic and thermal properties of the embedded inhomogeneity have been considered to be as= 1550 m/s,
= 1000 kg/m3,
= 8.1 Np/m,
= 4.5, k = 0.55 W/m°C and Cp = 3800 J/kg°C. For all the cases considered here, the heating duration has been kept constant at 0.2 s. Results of the study have been presented in the form of two-dimensional temperature contours in .
Figure 7. Temperature contour plots in the focal plane (z-x plane) for varying fundamental frequencies (0.8, 1 and 1.2 MHz) and of varying source pressures (0.2, 0.5 and 0.7 MPa).
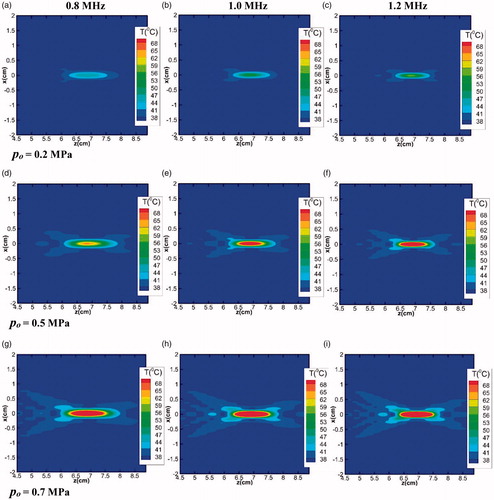
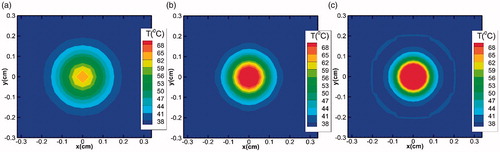
It is to be seen that for any given transducer frequency, an increase in the strength of the source pressure results in an increase in the heat deposited area due to higher acoustic energy loss. On the other hand, irrespective of the source pressure magnitude, as the transducer frequency is increased, the heat affected area narrows down and the acoustic energy gets more concentrated in the focal region. This observation can be attributed to the dependence of the attenuation coefficient on the source frequency, which increases with an increase in the frequency. As a result, more acoustic energy gets dissipated, resulting in higher temperature rise. This effect is quite prominent in the focal region due to the generation of secondary harmonics, as can be clearly seen from , which shows the two-dimensional temperature contours (in the x-y plane) at the focus for different frequencies (source pressure has been kept constant at 0.5 MPa). The temperature contours presented in the figure show that the acoustic energy loss near the focus is more, but reduces with an increase in the frequency as one moves away from the focal region.
Figure 8. Temperature contour plots in the x-y plane for the focus point (z = 7 cm) for different fundamental frequencies (a) 0.8 MHz, (b) 1 MHz and (c) 1.2 MHz. For each case, the source pressure has been taken 0.5 MPa and heating duration is 0.2 s.
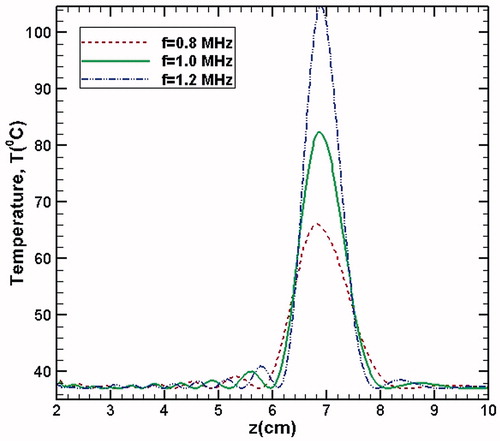
For more direct comparison, shows the temperature change with respect to the axial direction for the different transducer frequencies considered in the simulations. As the source frequency increases, the peak magnitude of temperature also increases due to the deposition of more number of acoustic wave cycles per second. Furthermore, as the diffusivity of acoustic energy is inversely proportional to frequency, the extent of the lateral spread of temperature profiles (on either side of the focal spot) reduces with increasing frequency, resulting into relatively narrower profiles at higher values of source frequency.
Figure 9. Temperature variation along the axial direction for different frequencies.
4.5. Generation of multiple lesions and energy modulation
Laboratory-based experiments, as well as clinical applications of HIFU technique, have shown that, compared to the overall size of the tumor affected region of the biological sample, the lesion size for a given position of single focused HIFU transducer is significantly small. (Here the lesion is defined as the spatial stretch of the biological tissue sample over which the local tissue temperature exceeds the threshold value required for complete destruction of the tumorous cells as the tissue sample gets subjected to HIFU waves.) In order to circumvent such limitations and to cover the entire spread of the embedded tumor, lesions must be placed systematically side-by-side. This arrangement can be achieved by moving the transducer mechanically (keeping the sample static) [Citation35,Citation36], using multi-element phased array transducer [Citation37] or with the use of multiple transducers using multidirectional heating scheme [Citation38]. The acoustic intensity of each lesion can be adjusted depending upon the size of the targeted tumor and its location. However, the main concern in each of these methods is to minimize the heating of healthy intervening tissues and the total treatment time. In this context, an overall planning and methodology for the generation of multiple lesions becomes important.
4.5.1. Planning methodology
For uniform and complete tumor ablation, it is required to generate similar size of each lesion to cover the entire tumor-affected region [Citation39]. However, due to the thermal diffusion effects, the lesion size increases even after the completion of the heating duration, which makes the initial spot undertreated while the later one gets over treated [Citation36]. To overcome this limitation, pre-controlled unequal distribution of acoustic energy is required to produce the modulated size of the lesion. There are two parameters which can be altered to generate the transient and modulated temperature in the tissue domain for achieving controlled lesion size:
Acoustic power,
Heating duration.
In both the cases, a modulation factor is required which can be adjusted according to the lesion position and gives controlled lesion size. The modulation factor, according to the usage and treatment requirement, can be defined as:
(13)
(13)
Here, m is the modulation factor for the ith lesion (i = 1,2,…N-1), N represents the total number of lesions (including the fundamental lesion) required to fill the entire tumor-affected region in any given direction. It is to be noted that i = 0 stands for the fundamental lesion for which the value of the modulated factor (m) would be equal to one since no modulation is required in the original acoustic intensity provided by the transducer. The advantage of using the above scheme is that the last lesion can always have half of the acoustic power or duration of heating used for the fundamental lesion (i = 0). It is to be mentioned that in the present study, it is assumed that the properties of the medium do not significantly change with temperature. Thus, the modulation factor can be directly multiplied by the volumetric power generation or the heating duration to provide a different level of temperature distribution for each lesion.
In addition to the total number of lesions, another factor that plays an important role in the planning methodology is the inter-spatial distance (χ) of different lesions. Since the domain size remains fixed, according to the application, the number of lesions or the gap between each lesion can be varied. However, to place more number of lesions in a confined space, the gap between each lesion should be optimized. The extent of this gap depends on the radius of the transducer and on the total number of lesions required to be generated. In place of the transducer radius, the boundary of the tumor can be considered so that the lesion remains inside the tumor domain.
(14)
(14)
where, a is the transducer radius and N represents the total number of lesions. It can be clearly seen from the above relation that the inter-spatial gap between each lesion is constant for all the lesions independent of its size. (To make it more generalized and dependent on each lesion position and size, χ can also be considered as a function of modulation factor (m) which is dependent on the ith lesion.)
4.5.2. Modulation in volumetric heat generation and heating time
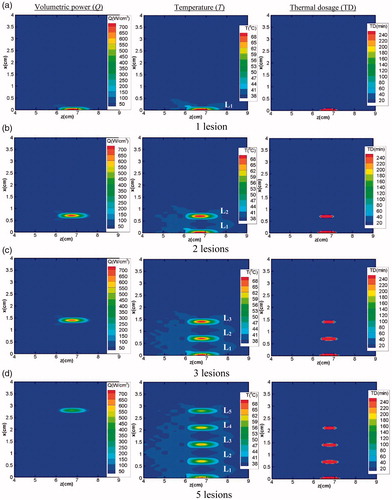
As mentioned earlier, the modulation factor for each lesion can be directly multiplied with the respective volumetric power distribution and can be considered as the modulated acoustic power generated by the moving transducer for a particular lesion. It is to be noted that the simulations for multiple lesions generation have been performed for the two-layered (water and tissue) system i.e., for Domain 1 (shown in ). Images shown in explain the generation of total five lesions, (N = 5), in the tissue domain from fundamental (i = 0) to lesion five (i = 4). Q, T, and TD, respectively, represent the volumetric power, temperature, and thermal dosage. Images shown in the first column of show the volumetric power generated for a given position of the transducer as it is translated along the vertical direction. As the transducer is moved along the vertical direction for creating more number of lesions, the acoustic energy deposited in the focal region tends to decrease. Ultimately, for the last lesion, it reaches a value that is half of the energy of the fundamental lesion. The second column of the figure illustrates the transient temperature distribution in the overall domain due to the generation of each lesion. After the creation of one lesion, once the transducer is moved to create the other lesion, the previously generated lesion starts to cool down. For computational modeling, the initial conditions get updated each time after the generation of every lesion. The third column of explains the thermal dosage, which demonstrates the actual lesion size for each lesion generated. It can be clearly seen that, as the deposited energy decreases, the size of the lesion that is achieved for a given position of the transducer (along with the vertical direction) also reduces.
Figure 10. Generation of multiple lesions: (a) 1 lesion (b) 2 lesions (c) 3 lesions and (d) 5 lesions. First, second and the third column respectively represent the volumetric power, corresponding transient temperature and thermal dosage for each lesion. In the contours shown, Li (i = 1, 2, ., 5) represents the number of the lesion created.
Similar to the modulation of the acoustic power, the heating duration can also be modified or controlled depending on the location of any given lesion. The procedure for the calculation of modulation factor and inter spatial gap between two lesions remains the same. However, the modulation factor m of the specific lesion gets multiplied with the heating duration (0.2 s) employed for the creation of the fundamental lesion (L1), while the acoustic power remains same for all the lesions. It further implies that every step movement of the transducer provides the same absorbed power density but its total energy, which is the product of the absorbed power density and heating duration, gets changed. shows the comparison between modulation of energy and modulation of time. illustrates the temperature variation (at focus z = 7 cm) with respect to time. From the figure, it can be clearly seen that for m = 1 (i.e., no modulation), the temperature peaks of all the lesions reach to the same magnitude, whereas with modulation, the temperature peaks get reduced.
Figure 11. Temperature for m = 1, and
for different lesions (a) with respect to time, (b) along the axial direction.
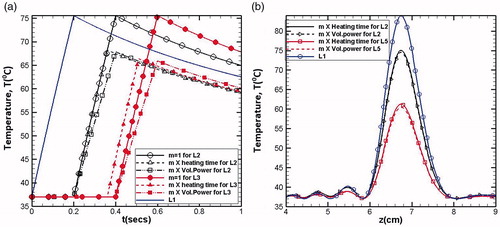
It should be noted here that though the modulation affects the volumetric power (or heating time), the total energy remains the same. However, the modulation of volumetric power gives slightly lower peak compared to the same modulation if it is incorporated in the heating time. This can be clearly seen in , where the variations of temperature values with respect to axial direction have been plotted. The reduction in the peak values of temperature at the focal spot (z = 7 cm) can be attributed to the fact that modulation in heating time gives equal heating time to each lesion, which is higher than the corresponding heating time used for the case of modulated heating duration. Thus, before the maximum values of temperature get realized, the thermal energy gets diffused, resulting in a lower peak. Thus, higher lag in heating period causes the reduction in the peak values of temperature because of the dominance of thermal dissipation effects. Also, the total treatment time can be expected to be lesser for the case of modulated heating time.
4.5.3. Delay time period
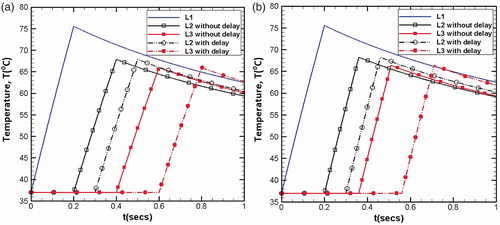
The delay time period includes the transducer movement time as well as the cooling off period. It depends on the treatment application, and here, it is set to be equal to 0.1 s (half of the total heating time). introduces the effect of the delay period, in which (a) shows the modulation of volumetric power and (b) for the modulation of heating time. Since here the lesions generated are independent of each other, the delay period only shifts the peak position. Also, it can be clearly seen that modulated heating time period provides more cooling period compared to the modulated volumetric power. For complete necrosis of the targeted tumor, any extent of the gap between the lesions is not recommended. However, if the inter-spatial gap becomes very small, the lesions start linking with each other and may get overexposed. Under these conditions, sufficient cooling period is required before generating the next lesion [Citation8]. Thus, the delay time period for such a situation is expected to play a significant role.
Figure 12. Delay time period in (a) modulation of volumetric power generation, and (b) modulation of heating time.
4.5.4. Effect of total number of lesions and inter spatial gap
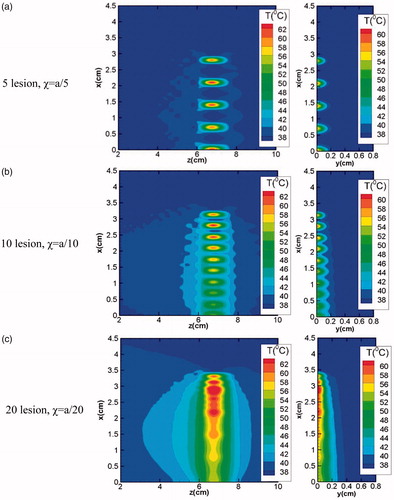
illustrates the effect of increase in the number of lesions on temperature distribution in the tissue domain. Increase in number of lesions (from 5 to 20) results in the reduction in the inter-spatial distance between any given two lesions and beyond a certain limit, the lesions start merging with each other making it difficult to predict the exact number of lesions created in the region of interest. Merging of different lesions significantly affects the resultant temperature distribution field around each lesion. In addition to the temperature realized at the focal spot, this phenomenon of lesions merging with each other also results in an increase in the temperature of the surrounding region, which under ideal conditions should remain un-affected in order to prevent any possible thermal damage to the surrounding healthy cells. Thus, for ensuring selective destruction of abnormal cells spread over a finite region in the tissue domain, the clinical application of HIFU requires optimization of the inter-spatial distances between the relative positions of different lesions created by traversing the transducer.
Figure 13. Effect of total number of lesions on the resultant temperature distributions realised in the x-z (left column) and x-y planes (right column).
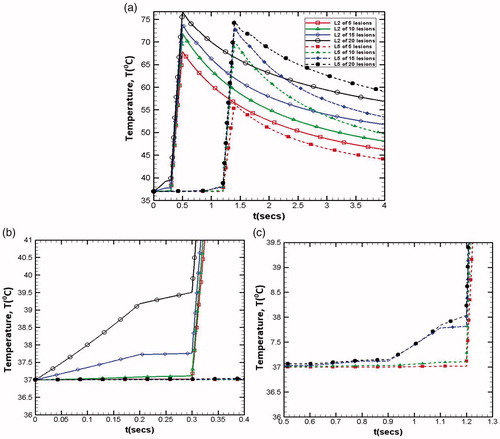
As mentioned earlier, if the inter spatial gap (χ) between two lesions is very small, the lesions start merging into each other, which leads to the preheating of the next lesion area even before its generation. This can be clearly seen from where temperature variations with respect to time for various total number of lesions have been reported for lesion 2 (L2) and 5 (L5). As the total number of lesions increase for any given domain, the temperature peak also increases for the lesions under consideration (lesion 2 and lesion 5 as mentioned in ). This is expected due to the fact that as the inter-spatial gap between the lesions reduces, each lesion temperature gets affected by the dissipated energy of the previously generated lesion. show the enlarged views of preheating time of lesion 2 (L2) and lesion 5 (L5) for varying total number of lesions. Following the similar trend, preheating temperature is also gets higher as the total number of lesions increases.
Figure 14. Temperature at the focus point for (a) lesion 2 and lesion 5 for total number of lesions 5, 10 and 20, enlarged version (b) for lesion 2 (L2) (c) for lesion 5 (L5) shows the preheating time.
5. Conclusions
For therapeutic applications, it is important to develop an in-depth understanding of the tissue heating and the corresponding thermal response of the tissue. The present work is an attempt to delve upon some of these aspects with the use of multi-physics modeling scheme and reports the thermal analysis of biological tissue phantoms that are subjected to high intensity focused ultrasound waves. Full form of nonlinear Westervelt equation has been numerically solved in a three-dimensional computational domain for determining the pressure field. The pressure field has been coupled with Penne's bio-heat transfer equation to obtain the resultant whole field temperature distributions for various process parameters. Simulations were reported for two-layer as well as multi-layered tissue phantoms. Results were presented in the form of pressure field, temperature distributions and the corresponding thermal dosage in the targeted region of the tissue phantoms. Simulation results revealed significant differences between the acoustic pressure fields obtained through the linear and nonlinear form of Westervelt equations. Consequently, the magnitude of maximum temperature achieved at the focal plane of the transducer, as predicted using nonlinear Westervelt equation, was found to be significantly higher than that realized using the linear form of the equation. The observed trend was attributed to the generation of the higher harmonics associated with the nonlinear propagation of the acoustic waves in the tissue medium. Presence of the fat and the muscle layers in multi-layered tissue phantoms resulted into a clear shift in the focal spot of the pressure waves, which in turn changed the position of the heat affected zone with respect to the original focal plane of the transducer. In the context of multiple lesion generation, the importance of energy modulation for optimizing the inter-spatial distance between two consecutive lesions was highlighted by controlled movement of the transducer (while keeping the tissue phantom static).
Disclosure statement
No potential conflict of interest was reported by the authors.
Notes
1 Following the reports available in the literature (for instance, [3]), frequencies in the range 0.8 to 1.6 MHz are generally employed for liver cancer surgery and hence hold significance for clinical applications. This has been one of the primary motivations for selecting the range of frequencies employed in the reported numerical simulations.
References
- Wu F, Zhou L, Chen WR. Host antitumour immune responses to HIFU ablation. Int J Hyperthermia. 2007;23:165–171.
- Kennedy JE. High-intensity focused ultrasound in the treatment of solid tumours. Nat Rev Cancer. 2005;5:321–327.
- Haar GT, Coussios C. High intensity focused ultrasound: Physical principles and devices. Int J Hyperthermia. 2007;23:89–104.
- Liu X, Li J, Gong X. Nonlinear absorption in biological tissue for high intensity focused ultrasound. Ultrasonics. 2006; 44:e27–e30.
- Bjørnø L. Introduction to nonlinear acoustics. Phys Procedia. 2010;3:5–16.
- Ginter S. Numerical simulation of ultrasound-thermotherapy combining nonlinear wave propagation with broadband soft-tissue absorption. Ultrasonics. 2000;37:693–696.
- Solovchuk M. a, Sheu TWH, Thiriet M, et al. On a computational study for investigating acoustic streaming and heating during focused ultrasound ablation of liver tumor. Appl. Therm. Eng. 2013;56:62–76.
- Ji X, Li D, Shen G, et al. A method of introducing cooling time between multiple sonications in focused ultrasound surgery. Int J Heat Mass Transf. 2013;56:403–410.
- Sassaroli E, Li KCP, O'Neill BE. Modeling focused ultrasound exposure for the optimal control of thermal dose distribution. Scientific World Journal. 2012;2012:1.
- Sheu TWH, Solovchuk MA, Chen AWJ, et al. On an acoustics-thermal-fluid coupling model for the prediction of temperature elevation in liver tumor. Int J Heat Mass Transf. 2011;54:4117–4126.
- Humphrey VF. Ultrasound and matter-Physical interactions. Prog Biophys Mol Biol. 2007;93:195–211.
- Curra KP, Mourad PD, Khokhlova VA, et al. Numerical simulations of heating patterns and tissue temperature response due to high-intensity focused ultrasound. IEEE Trans. Ultrason. Ferroelectr. Freq. Control. 2000;47:1077–1089.
- Filonenko EA, Khokhlova VA. Effect of acoustic nonlinearity on heating of biological tissue by high-intensity focused ultrasound. Acoust Phys. 2001;47:468–475.
- Solovchuk M, Sheu TW, Thiriet M. Multiphysics modeling of liver tumor ablation by high intensity focused ultrasound. Commun Comput Phys. 2015;x:1–22.
- Samanipour R, Maerefat M, Nejad HR. Numerical study of the effect of ultrasound frequency on temperature distribution in layered tissue. J Therm Biol. 2013;38:287–293.
- Leighton TG. What is ultrasound? Prog Biophys Mol Biol. 2007;93:3–83.
- Zhou Y. Principles and Applications of Therapeutic Ultrasound in Healthcare, New York: CRC Press; 2015.
- Hamilton MF, Morfey CL. Model equations in nonlinear acoustics. San Diego (CA): Academic Press; 1998.
- Farny CH, Glynn Holt R, Roy RA. The correlation between bubble-enhanced HIFU heating and cavitation power. IEEE Trans Biomed Eng. 2010;57:175–184.
- Hill CR, Bamber JC, Haar G. Ter Physical Principles of Medical Ultrasound. Chichester (UK): Wiley; 2004.
- Solovchuk MA, Sheu TW, Thiriet M. Image-based computational model for focused ultrasound ablation of liver tumor. J Comput Surg. 2014;1:4.
- Arkin H, Xu LX, Holmes KR. Recent developments in modeling heat transfer in blood perfused tissues. IEEE Trans Biomed Eng. 1994;41:97–107.
- Hallaj IM, Cleveland RO. FDTD simulation of finite-amplitude pressure and temperature fields for biomedical ultrasound. J Acoust Soc Am. 1999;105:L7.
- Pierce AD. Acoustics: an introduction to its physical principles and applications. New York (NY): Acoustical Society of America; 1991.
- Tempany CMC, McDannold NJ, Hynynen K, et al. Focused ultrasound surgery in oncology: overview and principles. Radiology. 2011;259:39–56.
- Sapareto SA, Dewey WC. Thermal dose determination in cancer therapy. Int J Radiat Oncol Biol Phys. 1984;10:787–800.
- Damianou C, Hynynen K, Fan X. Application of the thermal dose concept for predicting the necrosed tissue volume during ultrasound surgery. Proc IEEE Ultrason Symp D. 1993;2:1199–1202.
- Hamilton MF. Comparison of three transient solutions for the axial pressure in a focused sound beam. J Acoust Soc Am. 1992;92:527–532.
- Doinikov AA, Novell A, Calmon P, et al. Simulations and measurements of 3-D ultrasonic fields radiated by phased-array transducers using the westervelt equation. IEEE Trans Ultrason Ferroelectr Freq Control. 2014;61:1470–1477.
- Berenger JP. A perfectly matched layer for the absorption of electromagnetic waves. J Comput Phys. 1994;114:185–200.
- Pinton GF, Dahl J, Rosenzweig S, et al. A heterogeneous nonlinear attenuating full- wave model of ultrasound. IEEE Trans Ultrason Ferroelect Freq Contr. 2009;56:474–488.
- Doinikov A, Novell A, Bouakaz A, et al. Simulation of temperature fields in soft tissue caused by nonlinear propagation of ultrasound pulses. Chicago (IL): IEEE Int Ultrason Symp IUS. 2014;1179–1181.
- Doinikov A, Novell A, Bouakaz A, et al. The Westervelt equation for nonlinear propagation: Numerical simulations and experimental validation of ultrasonic fields produced by array transducers. IEEE Int Ultrason Symp IUS. 2013;12:608–610.
- Ebbini ES, Ter Haar G. Ultrasound-guided therapeutic focused ultrasound: current status and future directions. Int J Hyperth. 2015;31:77–89.
- Fan X, Hynynen K. Ultrasound surgery using multiple sonications-treatment time considerations. Ultrasound Med Biol. 1996;22:471–482.
- Zhou Y, Kargl SG, Hwang JH. The Effect of the Scanning Pathway in High-Intensity Focused Ultrasound Therapy on Lesion Production. Ultrasound Med Biol. 2011;37:1457–1468.
- Malinen M, Huttunen T, Kaipio JP, et al. Scanning path optimization for ultrasound surgery. Phys Med Biol. 2005;50:3473–3490.
- Cheng TY, Ju KC, Ho CS, et al. Split-focused ultrasound transducer with multidirectional heating for breast tumor thermal surgery. Med Phys. 2008;35:1387–1397.
- Zhou Y, Kargl SG, Hwang JH, et al. Producing uniform lesion pattern in HIFU ablation. Amer Institute Phys (AIP). 2009;91:1–6.