
 ?Mathematical formulae have been encoded as MathML and are displayed in this HTML version using MathJax in order to improve their display. Uncheck the box to turn MathJax off. This feature requires Javascript. Click on a formula to zoom.
Abstract
Objective: A molecular dynamics approach to understanding fundamental mechanisms of combined thermal and osmotic stress induced by thermochemical ablation (TCA) is presented.
Methods: Structural models of fibronectin and fibronectin bound to its integrin receptor provide idealized models for the effects of thermal and osmotic stress in the extracellular matrix. Fibronectin binding to integrin is known to facilitate cell survival. The extracellular environment produced by TCA at the lesion boundary was modelled at 37 °C and 43 °C with added sodium chloride (NaCl) concentrations (0, 40, 80, 160, and 320 mM). Atomistic simulations of solvated proteins were performed using the GROMOS96 force field and TIP3P water model. Computational results were compared with the results of viability studies of human hepatocellular carcinoma (HCC) cell lines HepG2 and Hep3B under matching thermal and osmotic experimental conditions.
Results: Cell viability was inversely correlated with hyperthermal and hyperosmotic stresses. Added NaCl concentrations were correlated with a root mean square fluctuation increase of the fibronectin arginylglycylaspartic acid (RGD) binding domain. Computed interaction coefficients demonstrate preferential hydration of the protein model and are correlated with salt-induced strengthening of hydrophobic interactions. Under the combined hyperthermal and hyperosmotic stress conditions (43 °C and 320 mM added NaCl), the free energy change required for fibronectin binding to integrin was less favorable than that for binding under control conditions (37 °C and 0 mM added NaCl).
Conclusion: Results quantify multiple measures of structural changes as a function of temperature increase and addition of NaCl to the solution. Correlations between cell viability and stability measures suggest that protein aggregates, non-functional proteins, and less favorable cell attachment conditions have a role in TCA-induced cell stress.
1. Introduction
Ablation and embolization are the two most common minimally invasive methods of treating unresectable hepatocellular carcinoma (HCC). However, incomplete ablation is more prevalent than commonly believed [Citation1,Citation2]. Total necrosis rates are less than 50% in treated nodules. Furthermore, residual tumor is present for 90% of nodules treated with embolization [Citation3]. Recurrences are frequent [Citation4,Citation5], and incomplete treatment can incite a more aggressive response [Citation6–8].
Thermochemical ablation (TCA) provides a novel conceptual platform for minimally invasive therapy of HCC. In it, an acid and base are mixed immediately prior to injection into the target tissue. Heat is released as the solutions react exothermally after mixing directly prior to entering the targeted tissue as a hot salt solution [Citation9]. Selective delivery to the target tumor is achieved via localized application and is not affected by the hostile tumor environment (low blood flow, interstitial hypertension, low pH) that limits the efficacy of radiation therapy and chemotherapy. TCA using a 10 M combination of acid and base has been shown sufficient to coagulate a 18.9-ml volume of blood perfused tissue in vivo animal models [Citation10]. Further, by-products of the reaction create a locally toxic high salt concentration environment that may synergistically increase the diameter of the lethal zone of this therapy as well as serve as a local diffusion reservoir to decrease the risk of local recurrence.
Although initial efforts established the concept of TCA [Citation10,Citation11], a better understanding of the fundamental mechanisms of cell death resulting from combined hyperthermal and hyperosmotic stresses implemented in vivo is needed to optimize delivery protocols. Salts are frequently added to proteins in solution to manipulate either biomolecular stability or ligand-binding affinity [Citation12–15]. Also, the free energy change of stabilization is a function of the polar surface area of an added osmolyte [Citation16]. Molecular dynamics studies have demonstrated salt-induced strengthening of hydrophobic interactions that leads to stabilization of compact conformations [Citation17]. With respect to the Hofmeister series, the salts used for TCA may be selected to function as kosmotropes. These kosmotropes preferentially hydrate extracellular proteins and are preferentially excluded from the protein-solvent interface [Citation18]. The increased water concentration near the protein interface is expected to stabilize folded and misfolded protein structures through increased Van der Waals forces for hiding hydrophobic residues. Similarly, the increased water concentration near a protein–ligand interface is expected to alter intermolecular forces from ionic bonds, hydrogen bonds and Van der Waals interactions that govern protein–ligand binding [Citation18].
In this study, we use molecular dynamics [Citation19] simulations to study the effects of osmotic and thermal stress in the extracellular environment of proteins and investigate correlations with cell survival. Our molecular dynamics model considers a protein structure within an aqueous solution with an added salt. This united-atom, isothermal–isobaric model includes hydrogen bonding, hydrophobic interactions, electrostatics, and entropic forces that contribute to the overall conformation free energy of the structure [Citation18,Citation19]. The intent of this study is to provide an alternative perspective in quantifying the degree of synergy between thermal and osmotic stresses using an idealized model of protein structures within the range of hyperthermal and hyperosmotic conditions expected with TCA. In particular, our idealized model is intended to represent the extracellular environment near the treatment margins. We focus on the extracellular matrix (ECM) protein fibronectin and integrin, the cell surface receptor for fibronectin, which is known to facilitate cell spreading, survival, and proliferation. Integrins have a vital role in regulating both tumor angiogenesis and tumor growth and have been the clinical targets of numerous therapies [Citation20]. Fibronectin is a dimer composed of two subunits joined by disulphide bonds. The domains of both subunits consist of serially repeated smaller modules. The type III fibronectin repeat is a module responsible for binding to integrins. In particular, the arginylglycylaspartic acid (RGD) domain of fibronectin binds to integrins on the cell surface [Citation21]. The RGD motif is known as the minimal recognition sequence within fibronectin required for cell attachment [Citation22]. Reliable binding between fibronectin and each member of the integrin family of cell-surface matrix receptors requires RGD sequences in combination with its own unique set of matrix molecules [Citation23].
Fibronectin is among the noncollagen proteins in the ECM that contribute both to organising the matrix and helping cells attach to it. Cell attachment to the ECM is well-known to be correlated with cell viability. In vitro, fibronectin is synthesized and secreted into the culture medium by hepatoma cell lines and is known to have a significant effect on cell survival [Citation24–26]. Fibronectin–integrin models are also advantageous for studying hyperthermal and hyperosmotic interactions because the structure of the receptor–ligand complex is available via X-ray crystallography [Citation27]. Analogous to in vitro models as invaluable systems for studying complex in vivo behavior of cancer under controlled conditions, our molecular dynamics models allow for detailed systematic investigation of correlations between temperature or osmolarity stress and structural changes potentially leading to tumor-cell death. The use of molecular models for in silico experimentation provides insight for characterizing fundamental thermal and chemical damage mechanisms needed for controlling and maximizing effective TCA delivery. This will help define a low but sufficient dose for guiding development of TCA procedures in a way that minimises the risk of systemic toxicity due to potential exposure to reaction products.
2. Methods
2.1. Viability studies
Experimental conditions simulate the interplay between hyperthermal and hyperosmotic stresses. After TCA, heated tissue cools down and returns to body temperature over 1–2 h because ablated tissues have no blood flow except in a thin rim (up to 3 mm). Thus, there is no clearance mechanism to wash away the salt from the tissue even over days to weeks. These factors support the use of hyperthermal stress in a time frame of minutes and osmotic stress over hours to days in our experimental design. The simultaneous thermal and osmotic stress conditions selected approximate the milder range of conditions (millimolar concentrations and 43–50 °C) expected at the margins of an ablation and determine thresholds for response and cytotoxicity. Thermal and osmotic stresses are applied separately and then together.
Human Hep3B and HepG2 tumor cells were plated in triplicate at a density of 104 cells/well in 96-well plates and allowed to settle overnight in a standard tissue culture incubator at 37 °C, 5% CO2, and a humidified atmosphere. The cell culture media used was MEM + 10%FBS + PenStrep + L-glutamine. HepG2 and Hep3B cells were subject to combined hyperthermal stress (43 °C for 1 h) and hyperosmotic stress (24h) with added NaCl concentrations of 0, 40, 80, 160, and 320 mM. This approach allows examination of the degree of synergy for the combination of stresses compared with the individual stresses. After 1 h at 43 °C, the cells were returned to 37 °C. Twenty-four hours after treatment initiation, cells were gently washed with phosophate-buffered saline (PBS) to remove the salt from the cultures and returned to standard culture conditions. Cell viability was measured using AlamarBlue® 3, 24, and 48 h after removal of salts. The fluorescence signal of the cells at 37 °C with 0 mM added NaCl were used to normalize cell viability in the study from 0 to 100% viability.
2.1.1.Molecular models
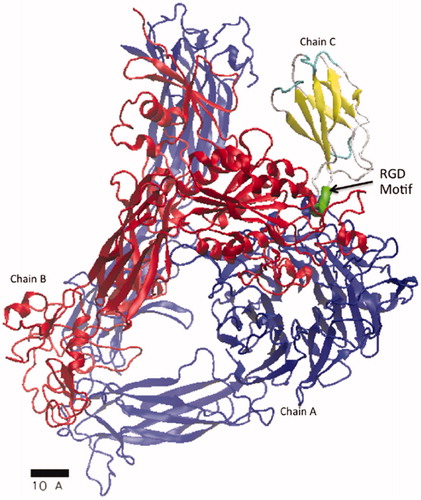
We studied the effect of hyperthermal and hyperosmolarity conditions on molecular models of proteins in the extracellular environment. Temperatures and salt concentrations in these models match experimental conditions described above. Functional domains of fibronectin and the ectodomain of fibronectin bound to integrin were considered. Here, we consider protein data bank (PDB) models 1FNA and 4MMX as our molecular models for fibronectin and fibronectin bound to the αVβ3 member of the integrin family, respectively. 1FNA (residue 1452–1542) and 4MMX (chain C, residue 1448–1540) are both subsets of the fibronectin glycoprotein (Uniprot ID - P02751, http://www.uniprot.org/uniprot/P02751) and are obtained from x-ray crystallography [Citation21, Citation27]. The RGD motif (residue 1524–1526) recognized for cell attachment is included in both models. A structural model of these simulation domains is visualized in .
Figure 1. An atomistic model, PDB 4MMX, of fibronectin bound to integrin is shown. Secondary proteins structures of the α-helices and β-sheets are represented as ribbons and arrows, respectively. All remaining structures are represented as a tube. Chain C represents residue 1448–1540 of the fibronectin glycoprotein, uniprot ID - P02751. The location of the RGD motif (residue 1524–1526) recognized for cell attachment is highlighted within chain C and is colored green. Chain A (blue), represents the integrin αV domain and chain B (red), represents the integrin β3 domain.
2.2. Fibronectin in water with salt
All molecular dynamics simulations were performed with the Gromacs [Citation19] software package (version 2016.3) and visualized with visual molecular dynamics (VMD) [Citation28] software. Atomistic simulations of the solvated protein (1FNA) were performed at the experimental temperatures, 37 °C and 43 °C. The GROMOS96 (54a7) force field [Citation29] and the TIP3P water model [Citation30] were used. The number of simulation atoms needed is implicitly determined using the minimum image convention applied to periodic boundary conditions for our simulation domain. Each protein was solvated in a cubic box with a distance of 1.0 nm between the box edge and the protein to satisfy the minimum image convention. This ensures simulation consistency such that the short range interaction force cut-off distance between each atom in the protein and periodic image of its neighbors are less than half the box length. Thus, each atom cannot interact with the same neighbor more than once.
Na and Cl-ions are added to the system to match experimentally added salt concentrations of 0, 40, 80, 160, and 320 mM. The total NaCl concentration simulated was shifted by an estimated initial concentration of 145 mM NaCl in the culture media. Simulations at 37 °C with 0 mM salt added provide a reference control for the effect of the hyperosmotic and hyperthermal conditions. The potential energy of the structure, solvent, and salt system was minimized using 100 steps of a gradient descent algorithm to stabilize initial configurations for equilibration and production runs. System equilibrium was achieved by first simulating a canonical ensemble (number of particles, volume, temperature held constant -NVT) using a velocity-rescaling thermostat [Citation31] to stabilise the temperature of the system at 37 °C or 43 °C. Next, isothermal–isobaric ensemble (number of particles, pressure, temperature held constant—NPT) simulations were run to stabilise the pressure of the system at 1 bar using the Parrinello–Raman barostat [Citation32]. The Particle Mesh Ewald (PME) method [Citation33] was used to approximate short-range and long-range electrostatic interactions. Position restraints (1000 kJ/mol/nm2) were applied to each chain of the protein during equilibration.
Production runs are performed using 1 fs timesteps with leap frog integration of the equations of motion. Computational expense is proportional to the number of atoms in the system and total simulation time. Our solvated 1FNA model contains >27,000 atoms and is simulated for 0.5 μs for each experimental condition considered. A simulation time of 0.5 μs is motivated from protein folding literature [Citation34] and is sufficient to observe characteristic time scales of side-chain fluctuations and protein stability at the experimental temperatures. The root mean square distance (RMSD) between the protein during the production run and the equilibrium configuration of the protein is used to verify the stability of the simulation. The effect of the increased salt and temperature was measured using the root mean square fluctuations (RMSF) of the RGD integrin binding site from the initial structure over the course of the 0.5 μs simulation. The Stampede2 computing system (Texas Advance Computing Center, Austin, TX) was used for all production runs. In particular, 96 cores from the Skylake compute subsystem node (24 cores/socket, 33MB L3-cache per socket, clock rate 2.1 GHz, 192GB RAM per node) was used. Gromacs was compiled with a vectorised instruction set, -xCORE-AVX2 -axMIC-AVX512,CORE-AVX512, on these processors and used a distributed message passing interface (MPI) over a 100 Gb/s Intel Omni-Path (OPA) interconnect network with a fat tree topology employing six core switches. Approximately 200 ns per day was achieved using this system in this configuration.
2.2.1. Interaction coefficients
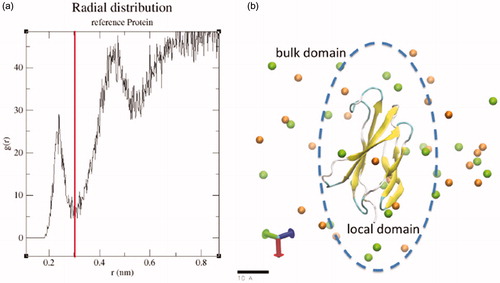
Hydration forces on the fibronectin surface are expected to be altered by osmotic forces and salt concentration [Citation35]. Cosolvents that preferentially avoid the interface of the macromolecule and solvent increase the chemical potential of the macromolecule [Citation17]. The addition of NaCl is expected to stay away from the fibronectin/water interface in the extracellular domain. In this case, fibronectin is ‘preferentially hydrated’. The interaction coefficient ΓMX between the added salt (X = NaCl) and the macromolecule (M = 1FNA) is used to quantify the preferential depletion of the added NaCl in a local domain near a macromolecule.
The interaction coefficient is determined by the number of cosolvent, NX, and water, Nw , molecules in a local domain of the macromolecule. Here, w denotes water. The number of salt and water molecules in a ‘bulk’ domain, a complement domain away from the macromolecular that does not include the local domain, is denoted by NX and Nw , respectively. The hydration shell boundary of the local/bulk domain, r = 0.3 nm, was selected to include the region in which the presence of the macromolecule influences the salt concentration, .
Figure 2. (a) Radial distribution function of NaCl ions around the 1FNA molecular model with 320 mM added salt. The distribution is used to select the boundary of the local and bulk domains at 0.3 nm from the surface of the 1FNA molecular model. (b) As illustrated in the schematic, the boundary separates the ‘local’ and ‘bulk’ domains that is used to calculate interaction coefficients from the ratio of water to cosolvent in each domain.
2.3. Fibronectin–integrin pulling simulations
The binding energy, ΔGbind of the fibronectin–integrin structure, 4MMX, was evaluated as a function of temperature and salt concentration. Binding energy was derived from a series of umbrella sampling simulations [Citation36]. Umbrella sampling simulations follow the same workflow for solvation, energy minimization, and equilibrium simulations as the discussed previously. However, during the production simulation, the fibronectin is pulled from the integrin. A series of fibronectin–integrin configurations along a reaction coordinate representing the distance between the fibronectin and integrin is thus generated. Here the reaction coordinate represents the distance between the centre of mass (COM) of the fibronectin (Chain C) and the integrin (Chains A and B). The simulation domain was increased in the direction of the reaction coordinate to satisfy the minimum image convention. The total system for the structure, solvent, and salt consists of >800 K atoms. The reaction coordinate was increased using a pull rate of 0.01. This steered molecular dynamics simulation approach allows fibronectin–integrin configurations to be biased and sampled at otherwise inaccessible configurations on the time scale of equilibrium methods. Umbrella sampling simulations were performed on configurations of increasing 0.2 nm COM distance from the initial 4MMX structure. Within each sampling window, the COM distance between the fibronectin and integrin was harmonically restrained using a force constant of 1000
. Intuitively, the constraint force opposes the system’s tendency to drift to lower free energies and is thus related to the binding energy [Citation37]. The Weighted Histogram Analysis Method (WHAM) [Citation38] was used to extract the potential of mean force (PMF) relationship and calculate the free energy change representing the binding energy, ΔGbind. The force constant and pulling rate were empirically chosen such that the umbrella windows overlap for proper reconstruction of the PMF curve.
3. Results
3.1. Viability studies
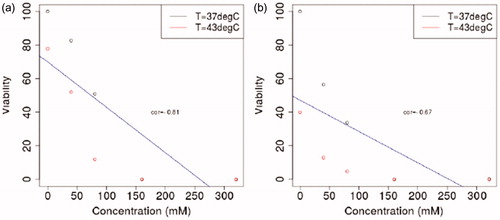
The results of viability studies for HepG2 and Hep3B cell lines under combined hyperthermal and hyperosmotic stress are shown in . Cell viability is inversely correlated with thermal and osmotic stress. For a given temperature, inflection points in the viability analysis reveal that approximately 100 mM added salt is a critical osmotic threshold. Correlation analysis was performed to assess relationships between the measured salt concentration and cell viability. Correlation coefficients, r, were computed using a Spearman method and include both temperatures considered. A one sample t-test for the correlation coefficient was computed to estimate statistically significant correlation changes from zero. Statistical analysis was performed using the R computing language [Citation39]. Cell viability was correlated with salt concentration for each cell line. We observed correlation coefficients of r = −0.81 and r = −0.67 for the Hep3B and HepG2 cell lines, respectively. Statistically significant p values were observed, p < .05.
Figure 3. Human HCC lines HepG2 and Hep3B were subjected to combined hyperthermal stress (43 °C for 1 h) and hyperosmotic stress (24 h) with added NaCl concentrations of 0, 40, 80, 160, and 320 mM. After 1 h at 43 °C the cells were returned to 37 °C. After 24 h of treatment initiation, the salts were removed from the cultures by exchanging growth media, and cell viability was measured using AlamarBlue® 3, 24 and 48 h after removal of salts. Plots correspond to 48 h time point. At constant temperature, increased salt concentration reduces the viability of both cell lines.
3.2. Fibronectin in water with salt
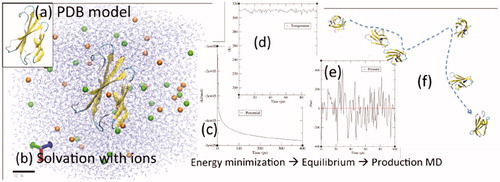
The workflow for the molecular dynamics simulations is illustrated in . A structural model of the fibronectin model is shown in . The water solvated model with added NaCl ions is shown in . The length scale provides a reference for the simulation domain. The iteration history of the energy minimisation step is shown in . Energy minimisation relaxes the system to avoid potential steric clashes. Similarly, the temperature and pressure histories observed during equilibrium simulations are shown in ,e), respectively. As expected, the simulated temperature and pressure converge to experimental conditions of 37 °C or 43 °C at 1 bar. The output configuration of the equilibrium simulations is ready for production simulations to collect data on the observed system dynamics.
Figure 4. The workflow for our molecular dynamics simulations is illustrated. (a) A structural model of the fibronectin model is shown. (b) The protein is solvated with water molecules shown as the transparent blue lines. Orange and green spheres illustrate the Na and Cl ions. The length scale provides a reference for the simulations domain. (c) The iteration history of the energy minimization step is shown. Average values for the (d) temperature and (e) pressure histories observed during equilibrium simulations match experimental conditions. The output configuration of the equilibrium simulations is ready for production simulations. (f) Data is collected from the observed dynamic trajectory of the fibronectin model as it interacts with the surrounding water and ions.
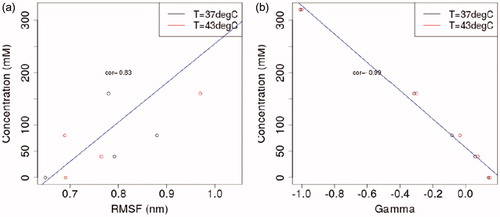
The root mean square distance (RMSD) of the fibronectin domain during production runs is relative to the output of the equilibrium simulations. The RMSD reaches a steady state of approximately 0.3 nm over the course of the 0.5 μs simulation, . Position restraints are only applied during equilibrium simulations and lead to the differences seen during the productions runs. The root mean square fluctuation (RMSF) of the RGD domain of fibronectin is shown in and . At the temperatures considered, the average RMSF of atoms within the RGD domain is correlated with salt concentration. A correlation coefficient of r = 0.83 was observed. The RMSF was 0.21, 0.42, and 0.54 nm for 0, 80, and 320 mM added salt, respectively. plots the correlations between the salt concentration and the interaction coefficients, ΓMX. Salt concentration is inversely correlated with the computed interaction coefficients with a correlation coefficient of r = −0.99.
Figure 5. (a) The root mean square distance (RMSD) at the boundary of the data available, i.e. 37 °C and 43 °C at 0 and 465 mM is shown. The RMSD is computed between the protein during the production run and the protein configuration of the equilibrium simulations. Molecular dynamics studies start from a crystal structure obtained from the PDB. The protein is expected to deform as the temperature and pressure of the simulation match experimental conditions. Steady state values of the RMSD indicates that the MD system has converged and is ready for analysis. The RMSD data shown were smoothed with the Gromacs low-pass filter tool to reduce noise. (b) The RMSF of the fibronectin RGD domain in response to hyperthermal and hyperosmotic conditions.
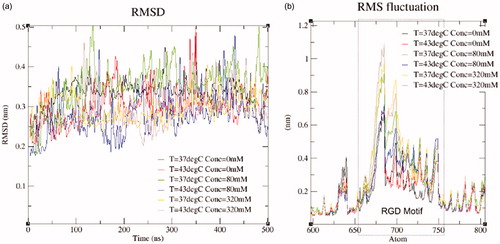
Figure 6. 1FNA model of fibronectin response to hyperthermal and hyperosmotic conditions. (a) RMSF correlations with added salt concentration. (b) ΓMX correlations with added salt concentration.
3.3. Fibronectin–integrin pulling simulations
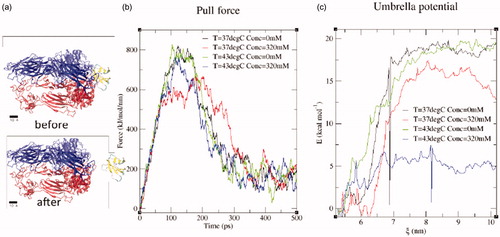
shows the pulling force as a function of time in pulling the RGD domain along the reaction coordinate, ξ, from the αVβ3 integrin binding site. provides a geometrical reference for the fibronectin–integrin configurations before and after pulling along the reaction coordinate. The configuration at the initial reaction coordinates begins with the structure of the original molecular model. The steered MD simulation pulls the fibronectin from the integrin binding site as illustrated. The point of maximum force occurs at approximately 100 ps and corresponds to the instant just before the bonds between integrin and fibronectin were broken. plots free energy as a function of the linear reaction coordinate. At large reaction coordinate values, fibronectin is disassociated from the integrin binding site and results in the largest free energy values. Free energy change is computed as the difference between the largest free energy value and the free energy when the fibronectin is close to the integrin binding site, ξ ≈ 5.5 nm. Under control conditions, 37 °C and 0 mM salt added, the free energy change required for fibronectin binding to integrin was computed as . Under the combined hyperthermal and hyperosmotic stress of experimental conditions, 43 °C and 320 mM added salt, the free energy change required for fibronectin binding to integrin was less favourable,
. As further control conditions, the free energy change was
at 43 °C and 0 mM added salt and the free energy change was
at 37 °C and 320 mM added salt.
Figure 7. Pulling simulations were performed with linear pulling geometries of fibronectin from the integrin structure represented by the 4MMX PDB model. The reaction coordinate represents the distance between the centre of mass (COM) of the fibronectin (Chain C) and the integrin (Chains A–B). (a) The configuration at the initial reactions coordinates begin with the structure of the original molecular model. The steered MD simulation pulls the fibronectin from the integrin binding site as illustrated. (b) The pulling force as a function of time in pulling the RGD domain along the reaction coordinate, ξ, from the αVβ3 integrin binding site is shown. Fibronectin and integrin configurations were chosen within umbrella sampling windows of the pulling trajectory to obtain Gaussian sampling of the reaction coordinate within each window. (c) The free energy change along the reaction coordinate is shown and is used to estimate the binding energy. Here we evaluate free energy change at the boundary of the data available, i.e. 37 °C and 43 °C at 0 and 465 mM. Change in free energy is more favourable (greater) at T = 37 °C with 0.0 mM added salt.
4. Discussion
Results present multiple quantitative measures of protein structural changes in the extracellular environment as a function of temperature increase and hyperosmolarity. Although these are highly idealised models, correlations between added NaCl salt concentration and cell viability provide additional perspectives on potential sources of TCA-induced cell stress at the boundary of ablation. For example, we observed correlation coefficients for RMSF of the RGD motif and cell viability of r = −0.65 and r = −0.58 for the Hep3B and HepG2 cell lines, respectively. Thus, relative to normal conditions, this RGD motif fluctuates more strongly as the NaCl salt concentration increases, . Correlations with viability suggest that increasing deformation within this essential RGD domain may negatively impact the ability for cell attachment and thus lead to additional cell stress. Similarly, a correlation coefficient between interaction coefficient, ΓMX, and viability of r = 0.74 and r = 0.60 was observed for the Hep3B and HepG2 cell lines, respectively. The expected protein-stabilization phenomena associated with the increased interaction coefficient magnitude [Citation16–18] suggests that increased stability of nonfunctional protein conformations induced during heating may have a role in TCA induced cell stress. However, these correlations do not imply causation [Citation40], and further experimental controls are needed to establish a true causal relationship. Surface plasmon resonance measurements may serve as a direct binding assay to determine binding constants of the fibronectin/integrin complex as a function of salt concentration [Citation41]. Further extensions may also include normal cell involvement as well as gradients in the temperature profiles seen by the cell populations at the periphery of the ablation zone. Increased thermal dose is expected to increase the kinetic energy of the simulations. Thus, calculations that correlate with structural denaturation, such as RMSF and RMSD, are expected to increase with the thermal dose. Fundamental cell stress mechanisms would be the same for any additional cell line considered. However, feedback mechanisms and tolerance for added thermal and osmotic stress are expected to vary. Thus, structural correlations with cell viability may be shifted.
The computed free energy change includes both enthalpy and entropy changes. Entropy is reduced when the fibronectin and αVβ3 integrin interact due to loss of molecular freedom of motion. Thermodynamically, an entropy reduction must be associated with a nonspontaneous reaction. However, bond formation as the fibronectin and αVβ3 integrin interact releases energy. Enthalpy change due to the fibronectin and αVβ3 integrin interaction offsets the entropy considerations and leads to spontaneous reactions for fibronectin and αVβ3 binding at all temperatures and in all osmolarity environments considered. The magnitude of the relative free energy change is proportional to the likelihood of binding. A larger negative free energy change indicates that fibronectin and αVβ3 integrin binding is more favorable under normal conditions, 37 °C and 0 mM added salt. At the largest hyperthermal and hyperosmotic stress considered in this study, fibronectin binding to integrin was 15.23 less favorable. Correlations with viability again suggest that less favorable cell attachment conditions contribute to reduce cellular viability at the TCA ablation boundaries. Further, the combined hyperthermal and hyperosmotic stress is seen to synergistically influence the free energy change. The sum of the individual free energy change from hyperthermal and hyperosmotic stress is less than the free energy change from the combined stress.
As both PDB models used in this study are obtained from X-ray crystallography, we are implicitly assuming (1) the amino acid sequences are known and correct, (2) the active site placement and conformation is accurate, and (3) the crystalized structures are relevant for the extracellular environment considered [Citation42]. These assumptions are partly limited by potential subjectivity in the crystallographer interpretation. Further, this crystalized structure is not representative of the aqueous environment of the ECM. We attempted to minimise these effects through potential energy minimization and position constrained equilibrium simulations prior to the production runs. Also, the configuration of the protein at 37 °C and 0 mM added salt serves as an initial starting configuration for the hyperthermal and hyperosmotic stress. Transient changes from these baseline temperatures also may be considered when using simulated annealing approaches1. In addition, well-established coarse graining techniques [Citation43–45] may be considered to simulate more comprehensive models of the cell membrane protein interactions within a hyperosmotic and hyperthermal extracellular environment. Coarse grain models simplify molecular simulations by considering groups of atoms as coarse grain (CG) beads. On average, four ‘heavy’ atoms are represented by a single interaction centre of a coarse grain bead. This not only reduces the degrees of freedom by a factor of 4 but, more importantly, reduces the pairwise interactions by orders of magnitude. The computation savings may allow access to more realistic cellular models at meaningful time scales.
In summary, we have developed molecular models for studying the correlations of cell viability with the extracellular protein environment characteristic of thermal chemical ablation. This provides additional perspective toward understanding fundamental mechanisms of TCA induced cell stress under hyperthermal and hyperosmotic conditions and may contribute toward improving the role of TCA as a viable therapeutic avenue for the global population of Barcelona Clinic Liver Cancer (BCLC) stage 0 or A HCC patients who are not candidates for resection or transplantation.
Acknowledgements
The Texas Advanced Computing Center provided enabling hardware and software for simulations. The authors would also like to thank the open source communities VMD [Citation28] and Gromacs [Citation19] for providing enabling software for molecular simulations and visualisation. The availability of Gromacs tutorials [Citation36] was essential toward achieving the molecular model results. The authors declare that they have no conflicts of interest.
Disclosure statement
No potential conflict of interest was reported by the authors.
Note
Additional information
Funding
Notes
1 http://manual.gromacs.org/online/mdp_opt.html#sa
References
- Moussa M, Goldberg SN, Kumar G, et al. Radiofrequency ablation-induced upregulation of hypoxia-inducible factor-1α can be suppressed with adjuvant bortezomib or liposomal chemotherapy. J Vasc Interv Radiol. 2014;25:1972–1982.
- Thompson SM, Callstrom MR, Butters KA, et al. Heat stress induced cell death mechanisms in hepatocytes and hepatocellular carcinoma: in vitro and in vivo study. Lasers Surg Med. 2014;46:290–301.
- Marin HL, Furth EE, Olthoff K, et al. Histopathologic outcome of neoadjuvant image-guided therapy of hepatocellular carcinoma. J Gastrointestin Liver Dis. 2009;18:169–176.
- Herber S, Biesterfeld S, Franz U, et al. Correlation of multislice CT and histomorphology in HCC following TACE: predictors of outcome. Cardiovasc Intervent Radiol. 2008;31:768–777.
- Sotiropoulos GC, Malagó M, Molmenti E, et al. Liver transplantation for hepatocellular carcinoma in cirrhosis: is clinical tumor classification before transplantation realistic? Transplantation. 2005;79:483–487.
- Gravante G, Ong S, Metcalfe M, et al. The effects of radiofrequency ablation on the hepatic parenchyma: histological bases for tumor recurrences. Surgical Oncol. 2011;20:237–245.
- Obara K, Matsumoto N, Okamoto M, et al. Insufficient radiofrequency ablation therapy may induce further malignant transformation of hepatocellular carcinoma. Hepatol Int. 2008;2:116–123.
- Ruzzenente A, de Manzoni G, Molfetta M, et al. Rapid progression of hepatocellular carcinoma after radiofrequency ablation. WJG. 2004;10:1137.
- Farnam JL, Smith BC, Johnson BR, et al. Thermochemical ablation in an ex-vivo porcine liver model using acetic acid and sodium hydroxide: proof of concept. J Vasc Interv Radiol. 2010;21:1573–1578.
- Cressman EN, Shenoi MM, Edelman TL, et al. In vivo comparison of simultaneous versus sequential injection technique for thermochemical ablation in a porcine model. Int J Hyperthermia. 2012;28:105–112.
- Cressman EN, Geeslin MG, Shenoi MM, et al. Concentration and volume effects in thermochemical ablation in vivo: Results in a porcine model. Int J Hyperthermia. 2012;28:113–121.
- Tessier PM, Lenhoff AM. Measurements of protein self-association as a guide to crystallization. Curr Opin Biotechnol. 2003;14:512–516.
- Curtis R, Ulrich J, Montaser A, et al. Protein-protein interactions in concentrated electrolyte solutions. Biotechnol Bioeng. 2002;79:367–380.
- Record MT, Anderson CF, Lohman TM. Thermodynamic analysis of ion effects on the binding and conformational equilibria of proteins and nucleic acids: the roles of ion association or release, screening, and ion effects on water activity. Q Rev Biophys. 1978;11:103–178.
- Lohman TM, von H. Kinetics of protein-nucleic acid interactions: use of salt effects to probe mechanisms of interaction. Crc Crit Rev Biochem. 1986;19:191–245.
- Street T, Bolen DW, Rose GD. A molecular mechanism for osmolyte-induced protein stability. PNAS. 2006;103:17064–17065.
- Ghosh T, Kalra A, Garde S. On the salt-induced stabilization of pair and many-body hydrophobic interactions. J Phys Chem B. 2005;109:642–651.
- Murphy R, Tsai A. Misbehaving proteins. Springer Science+ Business Media, LLC. 2006;
- Berendsen HJ, van der Spoel D, van Drunen R. GROMACS: a message-passing parallel molecular dynamics implementation. Comput phys commun. 1995;91:43–56.
- Wu Y, Qiao X, Qiao S, et al. Targeting integrins in hepatocellular carcinoma. Expert Opin Ther Targets. 2011;15:421–437.
- Dickinson CD, Veerapandian B, Dai XP, et al. Crystal structure of the tenth type III cell adhesion module of human fibronectin. J Mol Biol. 1994;236:1079–1092.
- Pierschbacher MD, Ruoslahti E. Cell attachment activity of fibronectin can be duplicated by small synthetic fragments of the molecule. Nature. 1984;309:30–33.
- Alberts B. Molecular biology of the cell. 4th ed. Garland Science; 2002. p. 1065.
- Zhu XH, Gan SK, Wang CH, et al. Proteins combination on PHBV microsphere scaffold to regulate Hep3B cells activity and functionality: a model of liver tissue engineering system. J Biomed Mater Res A. 2007;83:606–616.
- Glasgow JE, Colman RW. Fibronectin synthesized by a human hepatoma cell line fibronectin synthesized by a human hepatoma cell Line1. Cancer Res. 1984;44:3022–3028.
- Barnes DW, Reing J. Human spreading factor: synthesis and response by HepG2 hepatoma cells in culture. J Cell Physiol. 1985;125:207–214.
- Van Agthoven JF, Xiong JP, Alonso JL, et al. Structural basis for pure antagonism of integrin αVβ3 by a high-affinity form of fibronectin. Nat Struct Mol Biol. 2014;21:383–388.
- Humphrey W, Dalke A, Schulten K. VMD: visual molecular dynamics. J Mol Graph. 1996;14:33–38.
- Schmid N, Eichenberger AP, Choutko A, et al. Definition and testing of the GROMOS force-field versions 54A7 and 54B7. Eur Biophys J. 2011;40:843.
- Jorgensen WL, Chandrasekhar J, Madura JD, et al. Comparison of simple potential functions for simulating liquid water. J Chem Phys. 1983;79:926–935.
- Bussi G, Donadio D, Parrinello M. Canonical sampling through velocity rescaling. J Chem Phys. 2007;126:014101.
- Parrinello M, Rahman A. Polymorphic transitions in single crystals: A new molecular dynamics method. J Appl Phys. 1981;52:7182–7190.
- Darden T, York D, Pedersen L. Particle mesh Ewald: An Nâ<… log (N) method for Ewald sums in large systems. J Chem Phys. 1993;98:10089–10092.
- Prigozhin M, Gruebele M. Microsecond folding experiments and simulations: a match is made. Phys Chem Chem Phys. 2013;15:3372–3388.
- Ravikumar KM, Hwang W. Role of hydration force in the self-assembly of collagens and amyloid steric zipper filaments. J Am Chem Soc. 2011;133:11766–11773.
- Lemkul J, Bevan DR. Assessing the stability of Alzheimer’s amyloid protofibrils using molecular dynamics. J Phys Chem B. 2010;114:1652.
- Den Otter WK. Revisiting the exact relation between potential of mean force and free-energy profile. J Chem Theory Comput. 2013;9:3861–3865.
- Hub JS, de Groot BL, van der Spoel D. Spoel DVD. g_wham-A free weighted histogram analysis implementation including robust error and autocorrelation estimates. J Chem Theory Comput. 2010;6:3713–3720.
- R Core Team. R: A Language and Environment for Statistical Computing. Vienna, Austria; 2013.
- Lawlor DA, Davey Smith G, Ebrahim S. Commentary: the hormone replacement-coronary heart disease conundrum: is this the death of observational epidemiology? Int J Epidemiol. 2004;33:464–467.
- Pattnaik P. Surface plasmon resonance: applications in understanding receptor-ligand interaction. Appl Biochem Biotechnol. 2005;126:79–92.
- Davis AM, St-Gallay SA, Kleywegt GJ. Limitations and lessons in the use of X-ray structural information in drug design. Drug Discov Today. 2008;13:831–841.
- Marrink SJ, Risselada HJ, Yefimov S, et al. The MARTINI force field: coarse grained model for biomolecular simulations. J Phys Chem B. 2007;111:7812–7824.
- Monticelli L, Kandasamy SK, Periole X, et al. The MARTINI coarse-grained force field: extension to proteins. J Chem Theory Comput. 2008;4:819–834.
- Poma AB, Cieplak M, Theodorakis PE. Combining the MARTINI and structure-based coarse-grained approaches for the molecular dynamics studies of conformational transitions in proteins. J Chem Theory Comput. 2017;13:1366–1374.