
 ?Mathematical formulae have been encoded as MathML and are displayed in this HTML version using MathJax in order to improve their display. Uncheck the box to turn MathJax off. This feature requires Javascript. Click on a formula to zoom.
Abstract
Purpose: Ultrasound contrast agent microbubbles were combined with magnetic resonance imaging (MRI)-guided focused ultrasound (MRgFUS) as a means to achieve mild hyperthermia at reduced power levels.
Methods: MRgFUS hyperthermia (42°C for 20 min) was evaluated in rabbit thigh muscle or Vx2 tumors using infusions of microbubbles (Definity, 20 µL/kg) or saline (sham) administered over 5 min. The impact of treatments on drug uptake was assessed with liposomal doxorubicin (Caelyx, 2.5 mg/kg). Applied power levels before and after the injection of microbubbles or saline were compared, and drug uptake was evaluated with fluorometry of tissues harvested 24 hr post-treatment.
Results: MRgFUS hyperthermia in muscle and tumors resulted in accurate temperature control (mean =42.0°C, root mean square error (RMSE) = 0.3°C). The power dropped significantly following the injection of microbubbles in muscle and tumors compared to exposures without microbubbles (–21.9% ± 12.5% vs –5.9% ± 7.8%, p = .009 in muscle; –33.8% ± 9.9% vs –3.0% ± 7.2%, p < .001 in tumors). Cavitation monitoring indicated emission of subharmonic, ultraharmonic, and elevated levels of fourth to sixth harmonic frequencies following microbubble injection. The drug delivery was elevated significantly in muscle with the use of microbubble-assisted relative to conventional heating (0.5 ± 0.5 ng/mg vs 0.20 ± 0.04 ng/mg, p = .05), whereas in tumors similar levels were found (11 ± 3 ng/mg vs 16 ± 4 ng/mg, p = .13).
Conclusions: The finding that microbubbles reduce the applied power requirements for hyperthermia has considerable clinical implications. The elevated levels of drug found in muscle but not tumor tissue suggest a complex interplay between the heating effects of microbubbles with those of enhanced permeabilization and possible vascular damage.
Introduction
Hyperthermia has long been used in cancer therapy and has the potential to significantly improve patient outcomes [Citation1,Citation2]. Mild hyperthermia exposures (39°C–45°C) applied for tens of minutes and even as long as several hours are capable of improving the effects of radiotherapy and chemotherapy [Citation3]. Radiotherapy is promoted through temperature-induced radio sensitization of tumors and through increased blood flow and oxygenation that accompanies mild hyperthermia [Citation4]. Chemotherapy is promoted through temperature-enhanced drug response, along with possible increased delivery associated with elevated blood flow and the increased size of endothelial pores in the tumor vasculature [Citation5–7]. Hyperthermia has also been shown to specifically increase the permeability of tumor vessels and decrease interstitial fluid pressure which can further leverage what is known as the enhanced permeability and retention (EPR) effect [Citation8] in tumors to improve drug delivery and treatment efficacy.
An historical barrier to the widespread clinical adoption of hyperthermia has been the availability of effective delivery and temperature verification systems [Citation9,Citation10]. One promising method of achieving non-invasive hyperthermia in deep-seated tissues is with focused ultrasound (FUS) which has been employed for decades in thermal therapy for both hyperthermia and ablative purposes [Citation11–14]. By combining FUS with magnetic resonance imaging (MRI) thermometry [Citation15], a completely non-invasive thermal procedure can be performed [Citation16]. The soft tissue delineation of MRI combined with the ability of FUS to heat deep-seated tissues allows for precisely targeted and controlled hyperthermia exposures capable of adequately exposing the whole tumor while avoiding the thermal destruction of surrounding normal tissue. This technique is currently being applied in several oncological applications [Citation17,Citation18] and has significant clinical potential to improve the effectiveness of radiotherapy and chemotherapy. The latter includes conventional chemotherapeutic agent formulations [Citation19], as well as thermosensitive nanoparticles capable of releasing their drug payload at mild hyperthermia temperatures. The latter is an active area of investigation with several groups performing research in this field [Citation20–23]. Much of the relevant work has been reviewed in [Citation24].
There are, however, cancers located at sites that pose significant challenges for current ultrasound-based heating approaches. For example, liver tumors are shielded by bone, which absorbs ultrasound energy, thereby giving rise to unintended off-target heating. With liver, there is an additional issue of respiration-induced tissue motion that can make imaging for targeting and monitoring difficult. Many tumors can be highly perfused and in proximity to large blood vessels which act as heat sinks [Citation25,Citation26] and inhibit the ability to elevate temperatures by conventional heating schemes that employ continuous ultrasound exposures [Citation27]. New heating methods are therefore required to overcome these issues to expand the range of tumor types that can be effectively treated. One approach to doing this, the subject of the present paper, may be to combine the sonication with microbubble contrast agents. Microbubbles have been found to increase the temperature elevation in the focus of an ultrasound field [Citation28,Citation29] through two main mechanisms [Citation30]. The first is the backscatter of higher harmonics which are preferentially absorbed by the surrounding tissue [Citation31] and the second is the viscous oscillation of the microbubbles in the bloodstream [Citation32,Citation33]. In addition, by combining FUS with microbubbles, several therapeutically relevant bioeffects can be elicited (see review [Citation34]). Most notably, this technique has shown its capacity to transiently permeabilize microvessels without causing permanent damage [Citation35] which presents a unique avenue for safe, non-invasive targeted delivery of large molecule therapeutics [Citation36,Citation37]. Similarly, ultrasound exposure with microbubbles has been shown to cause vascular occlusions [Citation38] potentially resulting in reduced heat transfer by blood perfusion. However, the potential of reduced perfusion may also result in reduced drug delivery when chemotherapy enhancement or thermal drug release is the aim of the hyperthermia treatment.
In this work, we investigate the use of microbubbles in combination with ultrasound-based hyperthermia. A primary objective is to determine whether it can reduce the power requirements to achieve hyperthermia. This is accomplished using MRgFUS that incorporates temperature feedback control, and experiments are carried out in both muscle and experimental tumors. Furthermore, the experiments were carried out with the systemic injection of Caelyx, a clinically approved liposomal formulation of doxorubicin, which if successful would provide a shortened path to clinical testing.
Materials and methods
Animals and Vx2 tumors
All animal procedures were approved by the Animal Care Committee at Sunnybrook Research Institute, Toronto, Canada. Experiments were performed in 39 male New Zealand white rabbits that ranged in weight from 2.5 to 3.7 kg. Tumors were initiated in a subset of animals (22/39) 6–7 days before treatment through the injection of 0.8 million Vx2 carcinoma cells suspended in 100 µL of Hank’s balanced salt solution in both thigh muscles. The tumor initiation protocol resulted in tumors of at least 8 mm in diameter visible on contrast-enhanced T1-weighted imaging. A further subset of tumor-bearing rabbits (11/22) received bilateral tumor injections for doxorubicin quantification, one tumor was heated and the other served as a control.
In all groups, long-circulating liposomal doxorubicin (Caelyx®, 2.5 mg doxorubicin/kg body weight, Janssen Inc., Toronto, Canada) diluted in equal parts of 5% dextrose solution was administered intravenously as a slow bolus injection over 5 min during MRgFUS hyperthermia once the prescribed temperature of 42°C was reached (i.e., 5 min into the heating paradigm). Rabbits in this study were assigned into one of two treatment groups and this was the case for both animals with and without Vx2 tumors. In the first group, rabbits received contrast agent microbubbles (Definity®, 20 µL/kg, Lantheus Medical Imaging, North Billerica, MA) whose half-life in vivo is 1.3 min [product insert], diluted in 5 mL of saline following the injection of Caelyx, and in the second group, rabbits received saline without microbubbles following the injection of Caelyx. Injections of microbubbles or saline were administered manually at 10 min into the heating paradigm and were complete at 15 min into heating. Manual injections are subject to variation in the infusion rate and in an effort to minimize these variations the same author performed the injections for all experiments.
Prior to treatment, rabbits were anaesthetized with a mixture of 50 mg/kg of ketamine (Vétoquinol, Magny-Vernois, France) and 5 mg/kg of xylazine (Bayer Inc., Toronto, Canada) given as an intramuscular bolus away from the heated region. The animals were then intubated and anesthesia was maintained with 2%–3% isoflurane inhalation. The marginal ear vein was catheterized to allow the injection of liposomal doxorubicin, microbubbles, and gadolinium-based MRI contrast agent. To facilitate acoustic coupling, the hair from the thighs was removed with an electric shaver and depilatory lotion (Nair; Church and Dwight Co., Princeton, NJ). To minimize the risk of hot spots created at skin–air interfaces in the far-field [Citation39], a degassed saline bag was placed between the rabbit’s legs and coupled to the skin with ultrasound gel following hair removal.
Body (rectal) and thigh muscle temperatures away from the focal region were recorded using fiber-optic probes (Reflex Signal Conditioner; Neoptix, Québec City, Canada) and averaged to provide a baseline temperature for MR thermometry. The rabbits were placed on their side on a water blanket through which temperature-controlled water was circulated to maintain the core body temperature of the animal. A second pump sent heated water through a heating coil below the targeted thigh to help maintain temperature uniformity within the imaging plane. The thigh was coupled to the degassed water bath of the positioning system with ultrasound gel atop an acoustically transparent 25 µm thick polyimide membrane (Kapton; DuPont, Wilmington, DE).
MRI-guided FUS hyperthermia
FUS system
Temperature elevation in rabbit thigh muscle was achieved using continuous wave sonication with an in-house constructed spherically curved air-backed transducer (resonant frequency, f0, 1.169 MHz, 60 mm radius of curvature, 75 mm aperture, 20 mm diameter central fenestration for hydrophone insertion) equipped with a mode 4 sector-vortex lens designed to heat large volumes [Citation40–42] made from 3D-printed stereolithography material (2190 m/s speed of sound measured with pulse-echo technique in water, ClearVue; 3D Systems, Valencia, CA). The total acoustic power with the lens was 40% of the applied electrical power (forward minus reflected) when measured with a radiation force technique using a laboratory balance (AE200; Mettler Instruments, Hightown, NJ) as the force detector [Citation43]. The half-intensity diameter of the annular focal region produced by the transducer and lens was found to be 5 mm from the relative pressure amplitude distribution squared in water measured with a fiber-optic hydrophone (10 µm active element, Precision Acoustics, Dorchester, UK).
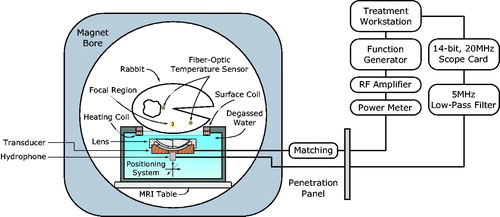
The transducer was mounted within an MRI-compatible preclinical FUS system (LP-100; FUS Instruments, Toronto, Canada) with a three-axis motorized stage to allow precise anatomical targeting of the focal region [Citation44] (). The transducer was driven with an arbitrary waveform generator (33220A; Agilent, Santa Clara, CA) and radiofrequency amplifier (NP2519; NP Technologies, Newbury Park, CA). The forward and reflected electrical power to the transducer was monitored with a power meter (E4419B; Agilent, Santa Clara, CA) and a dual-directional coupler (C2625; Werlatone, Brewster, NY). An impedance matching circuit was constructed using passive components to minimize the reflections along the transmission line.
Figure 1. Experimental setup used for MRgFUS hyperthermia. Missing from the schematic are the heavy mineral oil phantoms used for magnetic field drift correction and the degassed saline bag placed between the animals legs.
Real-time MRI thermometry
Experiments were performed with the LP-100 system placed in a clinical MRI suite (MR750 Discovery 3T; GE Healthcare, Milwaukee, WI). A single-loop receive-only coil with a square opening of 11 cm was placed underneath the animal above the polyimide membrane to improve the signal-to-noise ratio in the heated region. To protect the coil from water damage, it was sealed with epoxy in a 3D-printed case. Before heating, anatomical images were acquired with T1, T2, and T2*-weighting () for target definition and verification of acoustic coupling as illustrated in .
Figure 2. Anatomical MRI images of the experimental setup used to verify acoustic coupling and select the target anatomy. (A) T2*-weighted image of healthy rabbit thigh muscle with heavy mineral oil phantoms placed around the animal and a degassed saline bag placed between the animals legs. Flow artefacts from the water in the heating coil are visible along the phase-encoding direction and therefore the warm water pump was turned off for the duration of the hyperthermia treatments. (B) Gadolinium-enhanced fat-saturated T2*-weighted image of rabbit thigh muscle with bilateral Vx2 tumors (white arrows).
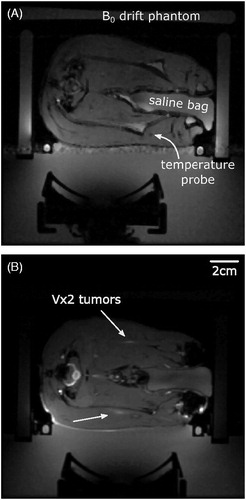
Table 1. MR imaging parameters.
During sonication, temperature maps were obtained in a 3 mm thick slice in the axial plane of the transducer using the proton resonance frequency (PRF) shift method [Citation15]. A fast-spoiled gradient-echo sequence was used for thermometry (5 s temporal resolution) and both the real and imaginary parts of the MR image data were used to process the temperature maps as in Ref. [Citation45]. Two thermometry images were acquired prior to the start of sonication with the second image used as the baseline for calculating the complex phase subtraction in the subsequent images. Ultrasound exposure began simultaneously with the third phase in the MR thermometry sequence and following sonication, T2*-weighting, T2-weighting, and contrast-enhanced T1-weighted images (0.2 mmol/kg gadobutrol, Gadovist; Bayer Inc., Mississauga, Canada) were acquired to evaluate tissue and perfusion changes related to tissue damage and drug release. Although non-thermosensitive liposomal doxorubicin was used in this work, previous literature has shown that mild hyperthermia temperatures can release some of the drug payload from stable liposomal doxorubicin, albeit at much lower levels than their thermosensitive counterparts [Citation46].
To correct for magnetic field drift during the hyperthermia treatment, three heavy mineral oil phantoms were placed within the imaging field-of-view. The change in phase measured in these regions was fit to a linear plane in 2D [Citation47] and subtracted from the change in phase across the entire image in the following way:
(1)
(1)
where the coefficients were solved for using a weighted least squares regression with image magnitude weighting that minimized the phase change in the oil phantoms. Temperature maps were then reconstructed in the following way:
(2)
(2)
Where α is the temperature dependence of the PRF shift in rabbit skeletal muscle, –0.00909 ppm/°C [Citation48], γ/2π is the gyromagnetic ratio of protons, 42.58 MHz/T, TE is the echo time in seconds, and B0 is the flux density of the main magnetic field.
Temperature-based PID feedback control
The mean temperature in a 7 mm circular ROI was used for proportional, integral and derivative (PID) feedback control of the applied power to the transducer during the experiment. The applied power was updated with each received image in the following way:
(3)
(3)
(4)
(4)
where e(i) is the difference between the measured temperature and the ideal temperature response, KP is the proportional gain, KI is the integral gain, and KD is the derivative gain which were empirically determined to be 800, 1, and 75 mW/°C, respectively. The starting acoustic power level was 5.5 W and the maximum power level, Pmax, was 10 W acoustic. At Pmax, the in situ spatial-peak temporal average intensity (ISPTA) was 28.7 W/cm2 and the in situ peak pressure amplitude was 975 kPa. These values account for propagation through 2 mm of skin (17 Np/m) and 10 mm of muscle tissue (4.7 Np/m) whose attenuation was based on the frequency-dependent tissue parameters reported in Refs. [Citation49,Citation50] for a frequency of 1.169 MHz. To reduce the initial accumulation of error during heating, the ideal temperature response was prescribed as an exponential ramp instead of a step function [Citation51]:
(5)
(5)
Where Tgoal was 42°C and the time constant τ was chosen to be 5 min. The root mean square error (RMSE) of the mean temperature in the ROI used for real-time feedback control was calculated according to:
(6)
(6)
Thermal dose in the target region was calculated in cumulative equivalent minutes at 43°C (CEM43) using the Sapareto–Dewey time–temperature equation [Citation52].
Change in applied power following the injection of microbubbles
To quantify the change in acoustic power following the injection of microbubbles (or saline), the mean acoustic power in a 4-min time window before and after the start of the injection (buffered by 60 s both before and after) was compared. The percent change in acoustic power was calculated in the following way:
(7)
(7)
This analysis was performed for all four treatment groups.
Acoustic cavitation during hyperthermia
Cavitation signals were monitored passively with a circular 4.8 mm diameter wideband polyvinylidene fluoride (PVDF) hydrophone [Citation53] mounted within the center of the transducer. During some experiments (4/39), the PVDF hydrophone had a damaged connection in the pre-amplifier circuit and was exchanged with a piezo-ceramic receiver (PZT-4, 3 mm square aperture, 580 kHz resonant frequency, ∼ 0.5 f0). The hydrophone signal was sent through an anti-aliasing 5 MHz low-pass filter (BLP-5+; Mini-Circuits, Brooklyn, NY) before being captured by a 14-bit personal computer scope card (ATS460; AlazarTech, Pointe-Claire, Canada).
Cavitation data were acquired in 10 ms intervals, sampled at 20 MHz, and separated by 312 ms (8× the repetition time, TR =39 ms), gated by the MRI scanner during MR thermometry for the duration of the sonication. Power spectra, PSD(f), were calculated from the Fast Fourier Transform (FFT) of each 10 ms acquisition. The relative signal strength in dB during each acquisition was calculated in the following way:
(8)
(8)
Where PSDBL(f) is the baseline power spectra that takes into account noise from the MR scanner by averaging the frequency-dependent FFT data during the acquisition of the first two MRI thermometry images before the start of sonication.
The time dependence of signals in different frequency bands within the above spectra was achieved by integrating the power within a 300 Hz bandwidth centered about the subharmonic, fundamental, 1.5 and 2.5 ultraharmonics, second to sixth harmonics and an inertial cavitation band (1.90 MHz, ∼13/8 f0) that was outside the other frequency ranges.
Finally, to provide an indication of the change in signals within the above frequency bands associated with microbubbles, the average power was estimated in a 5-min window following microbubble injection and expressed as a change relative to the level in a 1-min window prior to injection. The percent change in the peak pressure was also reported and was calculated in a manner which follows Equation (7). Inertial cavitation was deemed to have occurred if the integrated signal within the inertial cavitation band was elevated to 15 dB above baseline during sonication.
Tissue doxorubicin quantification by fluorometry
Approximately 24 h after drug injection doxorubicin remaining in the systemic circulation was eliminated by cardiac perfusion with saline under deep anesthesia. For evaluation of tissue drug concentrations, samples of tumor and adjacent muscle were harvested from both the heated and unheated thighs, immediately frozen in liquid nitrogen and stored at –80°C. Samples were also acquired from the skin adjacent to the heated region along the ultrasound beam path, in a similar location away from the ultrasound beam on the contralateral thigh as well as from the heart, lung, liver, kidney, and spleen.
Tissue doxorubicin concentrations were measured by the fluorescence intensity of doxorubicin extracted from homogenized tissue samples as described previously [Citation54–56]. Tissue samples were diced, weighed to ∼75 mg, and added to 13.3 volumes of acidified ethanol extraction solvent (0.3 N HCl in 50% ethanol) before homogenization with 500 µL each of 1 mm and 2 mm zirconia beads in a bead mill homogenizer (Mini-BeadBeater 16; BioSpec Products Inc., Bartlesville, OK). Tissue homogenates added to 13.3 volumes of acidified ethanol were refrigerated overnight prior to centrifugation (16000 g, 30 min) and subsequent storage of supernatants in the dark at –20°C. Fluorescence intensity of doxorubicin was measured in 0.5 mL aliquots of supernatant added to 1.5 mL of acidified ethanol in 3 mL fluorometry cuvettes using a benchtop fluorometer (VersaFluor; Bio-Rad Laboratories, Hercules, CA) with 480 nm excitation and 590 nm emission filters. Relative fluorescence intensities were scaled to doxorubicin concentrations using a fluorescence calibration curve of serial dilution of free doxorubicin added to 0.5 mL blank tissue supernatants in 1.5 mL of acidified ethanol. The lower limit of detection was found to be 2.5 ng/mL of doxorubicin as determined from 3× the noise floor of the fluorescence detector when a doxorubicin-naïve muscle tissue sample was measured.
Statistical analysis
To compare the changes in applied power following the injection of microbubbles or saline, a one-way analysis of variance (ANOVA) with Bonferroni post-hoc tests for multiple comparisons was performed. To compare the change in pressure as well as the change in cavitation within a specific frequency bands before and after the injection of microbubbles or saline, a paired t-test was performed. To compare the doxorubicin concentration in heated and unheated Vx2 tumors and muscle tissue, paired and unpaired t-tests were performed. Measured data are reported as mean ± standard deviation (SD) in all cases. All p values were two-sided, a value of p < .05 was considered statistically significant and all statistical analyses were performed in Matlab (2016b; The Mathworks, Natick, MA).
Results
MRI-guided FUS hyperthermia
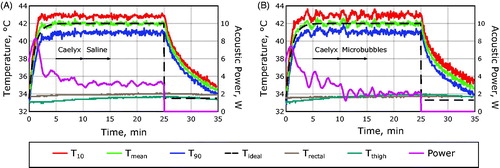
The temperature uncertainty of the MR temperature measurements used to control the thermal exposures was found to be 0.5°C ± 0.2°C, inversely proportional to the signal-to-noise ratio in the thermometry imaging sequence [Citation45,Citation57,Citation58]. The RMSE across all hyperthermia exposures was found to be 0.3°C ± 0.1°C which is less than the uncertainty of the temperature measurements, indicating successful temperature control. illustrates the heating paradigm for exposures with and without microbubbles. In both cases, a smooth temperature response was observed for the duration of the sonication.
Figure 3. The experimental heating paradigm. (A) Hyperthermia curves measured from a 7 mm circular ROI centered on the acoustic focus of the transducer in a rabbit Vx2 receiving Caelyx and saline without microbubbles. (B) Hyperthermia curves measured in a rabbit Vx2 receiving Caelyx and microbubbles. Mean temperatures within the ROI are shown (green) as well as the temperatures that 90% (T90, blue) and 10% (T10, red) of the region exceeds. The fiber-optic temperature measurement of the rectum (brown) and the thigh muscle away from the focus (teal) are shown along with the ideal temperature response (black dashed line) and the acoustic power (purple).
The spatial distribution of heating during MRgFUS hyperthermia is shown in and sonications with microbubbles did not results in preferential heating within the near field. The 7 mm circular ROI used for feedback control and subsequent temperature analysis is shown in . A summary of the MR thermometry measurements made in all 39 rabbits in this study are summarized in . The mean temperature achieved in the target region 42.0°C with 10th and 90th percentile temperatures of 43.2°C and 40.7°C and a median thermal dose in the target region of 12.2 CEM43. In 2/62 sonications, the ultrasound exposure was turned off pre-maturely due to sudden animal motion but the data were retained because in both cases motion occurred after more than 15 of the 20 min of prescribed hyperthermia to 42°C.
Figure 4. Spatial temperature distribution during hyperthermia. (A) Magnitude image prior to sonication showing rabbit thigh anatomy with an implanted Vx2 tumor (white arrow) and the regions of B0 drift correction regions indicated with the dashed cyan regions. (B) Temperature response during MRgFUS hyperthermia with microbubbles injected at 10 min into the heating paradigm. (C) Temperature maps in color overlaid upon the magnitude anatomical image in grey (white inset from (A)) at representative time points during heating indicated by the numbers in (B). The 7 mm circular ROI used for feedback control is shown in purple.
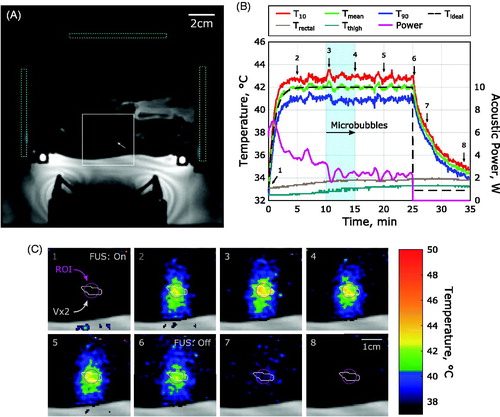
Table 2. Summary of MRgFUS hyperthermia exposures.
Applied power reduction following the injection of microbubbles
Rabbits receiving microbubbles during hyperthermia saw a significant reduction in the applied power required to maintain the temperature elevation, illustrated in . In healthy muscle, the power reduction observed following the administration of microbubbles was significantly lower than what was observed in the case of saline administration without microbubbles (–21.9% ± 12.5% vs –5.9% ± 7.8%, p = .009).
Figure 5. Change in applied power following the injection of microbubbles or saline. (A) Applied power summary in a rabbit Vx2 tumor with microbubble administration of 10 min into heating, shaded regions indicate the time window when the applied power was averaged for comparison. (B) Applied power summary in a rabbit Vx2 tumor with saline administration at 10 min into heating. (C) Comparison of the change in applied power across all treatment groups in this study. Data were compared with one-way ANOVA and Bonferroni post-hoc tests for multiple comparisons, **p < .01, ***p < .001.
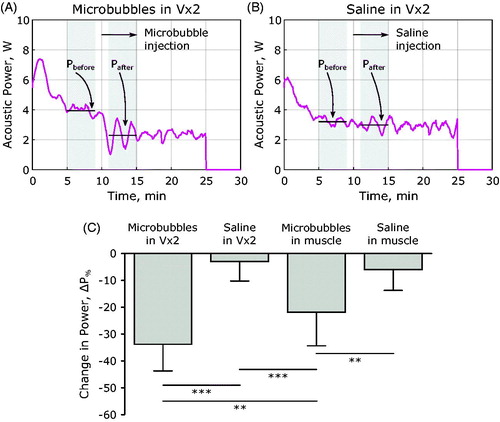
This was also the case for rabbits bearing Vx2 tumors, when microbubbles were administered the applied power dropped significantly compared to not only cases in Vx2 without microbubbles (–33.8% ± 9.9% vs –3.0% ± 7.2%, p < .001) but also compared to exposures in healthy muscle tissue with microbubbles (–33.8% ± 9.9% vs –21.9% ± 12.5%, p = .007). A comparison of the power drop across treatment groups is shown in .
Cavitation during MRgFUS hyperthermia
Cavitation associated with microbubble oscillation is indicated by increased harmonic signals (n · f0, n = 1, 2, 3 …) and the presence of subharmonic (0.5 f0) and ultraharmonic (1.5 f0, 2.5 f0, 3.5 f0 …) signals (). These cavitation phenomena were observed in 3/10 sonications in healthy rabbit thigh muscle that received microbubbles and in 30/35 sonications in rabbit Vx2 tumors that received microbubbles. Without microbubbles, these effects were not observed.
Figure 6. Cavitation spectra obtained during MRgFUS hyperthermia in combination with microbubbles. (A) Pressure at the focus as a function of time during the hyperthermia exposure and example cavitation spectra overlaid upon one another at two time points, one before microbubble injection (green circle) and one after microbubble injection (blue circle) are displayed in (C). (B) Pressure as a function of time during the hyperthermia exposure and example cavitation spectra overlaid upon one another at two time points, one before microbubble injection (green circle) and one after microbubble injection (blue circle) which resulted in inertial cavitation are displayed in (D).
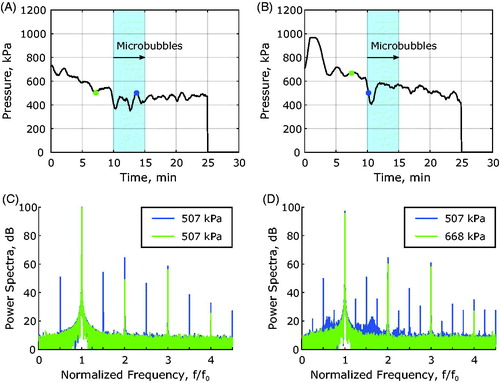
Inertial cavitation which results from violent microbubble collapse is characterized by broadband cavitation signals. This type of cavitation was observed in 4/35 sonications in rabbit Vx2 tumors () that received microbubbles and was not observed in healthy muscle with microbubbles or any of the sonications without microbubbles.
Representative time-dependent power levels within different frequency bands are shown in during sonication in a Vx2 tumor. Pronounced signal enhancements were observed in the subharmonic, ultraharmonic, and fourth to sixth harmonic frequency bands which is summarized in . In the third harmonic frequency band, the average power was significantly reduced.
Figure 7. Change in cavitation during MRgFUS hyperthermia in a Vx2 tumor. (A) Pressure as a function of time during MRgFUS hyperthermia with a 1-min baseline time window for signal averaging shaded in dark grey, and the 5-min signal region for comparison with baseline levels of cavitation after microbubble or saline injection shaded in light grey. (B) The fundamental signal, f0, integrated over a 300 Hz bandwidth as a function of time as well as (C) the second harmonic, 2 f0, (D) the third harmonic, 3 f0, (E) and the fourth harmonic, 4 f0. Frequency bands indicative of microbubble oscillation are also shown, including (F) the subharmonic, 0.5 f0, (G) the first ultraharmonic, 1.5 f0, (H) the second ultraharmonic, 2.5 f0, and (I) an inertial band chosen to be 13/8 f0.
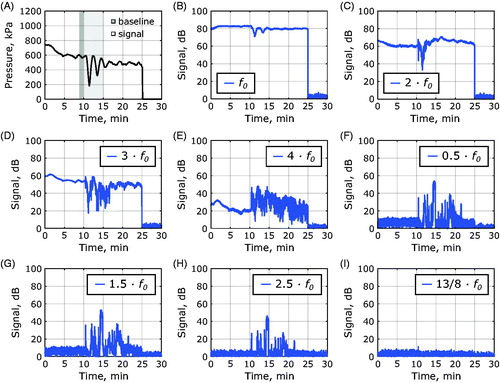
Table 3. Quantification of cavitation data before and after the injection of microbubbles or saline without microbubbles.
Localized doxorubicin delivery to Vx2 tumors and heated tissue
and summarize the drug concentrations in tissue homogenates. For the case of healthy thigh muscle, rabbits receiving microbubbles had higher levels of doxorubicin present in heated muscle tissue on average compared to rabbits receiving saline without microbubbles (0.5 ± 0.5 vs 0.20 ± 0.04 ng/mg, respectively, p = .05). The doxorubicin concentration in microbubble-assisted heated muscle tissue approached a statistically significant elevation relative to unheated muscle tissue in the same animal (0.5 ± 0.5 vs 0.17 ± 0.06 ng/mg, respectively, p = .07). Heated muscle in the absence of microbubbles had similar doxorubicin levels to unheated muscle tissue in the same animal (0.20 ± 0.04 vs 0.15 ± 0.02 ng/mg, respectively, p = .6).
Figure 8. Summary of doxorubicin delivery to heated and unheated tissues. (A) Delivery directly to heated and unheated muscle tissues without Vx2 inoculation. (B) Delivery to heated and unheated Vx2 tumors and the adjacent muscle surrounding the tumors in both cases. (C) Doxorubicin distribution following 24 h circulation of Caelyx (2.5 mg/kg doxorubicin) in different organ tissues. Comparisons were made with a two-sided paired t-test between heated and unheated tissues, *p < .05, **p < .01.
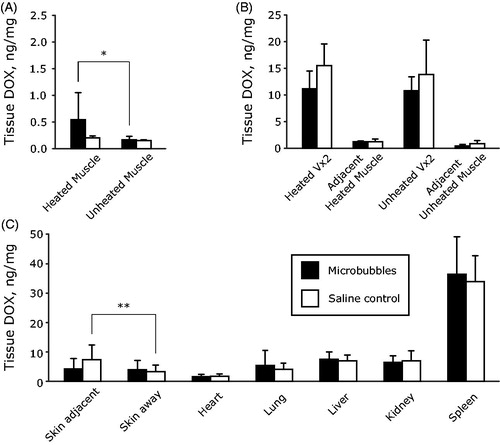
Table 4. Analysis of doxorubicin concentration in rabbit tissues 24 h post injection of Caelyx at a dose of 2.5 mg/kg of doxorubicin.
Rabbits receiving microbubbles during sonication had similar levels of doxorubicin present in tumor tissue on average compared to rabbits receiving saline without microbubbles (11 ± 3 vs 16 ± 4 ng/mg, respectively, p = .13). The mean doxorubicin concentration in heated tumors was also similar to that in unheated tumors, either with microbubbles (11 ± 3 vs 11 ± 3 ng/mg, p = .8) or without microbubbles (16 ± 4 vs 14 ± 6 ng/mg, p = .7).
Delivery to heated skin was significantly higher than unheated skin in rabbits receiving saline without microbubbles (7.3 ± 5 vs 3.3 ± 2 ng/mg, p = .005). With microbubbles, doxorubicin delivery to the skin was not elevated significantly (4.3 ± 3 vs 3.9 ± 3 ng/mg, p = .7).
Discussion
It has been previously shown that tissue can be ablated with ultrasound at lower powers when cavitation is induced, either in the presence [Citation29,Citation59,Citation60] or absence [Citation61,Citation62] of systemically circulating microbubbles. The results reported here provide a first demonstration of the ability of microbubbles to reduce the applied power required to maintain the temperature elevation during MRgFUS hyperthermia. An issue reported with microbubble mediated ablation was that off-target heating occurred within the pre-focal region [Citation29]. This pattern was not evident in the present study (), which may be due to the reduced power levels employed with hyperthermia compared to ablation. The degree of power drop was more pronounced in tumors compared to muscle, which is hypothesized to be due to the higher levels of blood volume and flow within tumors relative to resting muscle tissue which would increase the local microbubble concentration. Collectively, these findings have important implications for the hyperthermia treatments of tumors situated in anatomic locations where power deposition presents challenges due to overlying bone or the proximity of large vessels.
The cavitation data show that elevated signals were present in the subharmonic and ultraharmonic bandwidths following microbubble injection, and that these were sustained during infusion. This is consistent with the presence of pronounced microbubble oscillations, as would be expected when thermally significant cavitation is occurring. The presence of subharmonic and ultraharmonic cavitation several minutes after the end of the microbubble infusion suggests that persistent cavitation nuclei remain within the focus of the transducer which will contribute to cavitation based heating. Following a bolus injection of Definity, the nonlinear backscattered signal which provides vascular contrast from ultrasound imaging pulses remains present for only a few minutes [Citation63]. It remains an open question, however, as to how long after microbubble administration therapeutic ultrasound exposures can achieve cavitation and other microbubble bioeffects [Citation64]. In contrast to imaging exposures, therapeutic ultrasound typically consists of longer pulse durations and higher peak pressures. Therefore, one should not expect similar microbubble behavior in both cases. Cavitation monitoring is critical for discerning the duration of microbubble bioeffects, both in stable and inertial cavitation regimes and this is true for time periods well past the documented half-life of microbubbles in circulation. The overwhelming majority of microbubble half-lives have been characterized through imaging as opposed to therapeutic ultrasound metrics.
Inertial cavitation was only detected in a subset of cases in the present work, suggesting that it may not be a prominent contributor to sustained cavitation based heating under the particular exposure levels employed. Fundamental and second harmonic signals were present at baseline and were not found to be significantly elevated during infusion. Interestingly, the fourth to sixth harmonic signals, present at baseline due to nonlinear propagation, did increase significantly. The cause of this remains to be established, but it is possible that it is linked to the frequency-dependent scattering response of Definity. It should also be noted that the received signals are influenced by the superposition of the receive transducer beam, which is unfocused, and the distribution of cavitation within the transmit beam. The spatial mapping of cavitation within the beam, as well as on shorter timescales, warrants investigation.
The impact of microbubbles on the uptake of Caelyx into tissue was also assessed. Caelyx is a clinically employed liposomal formulation of doxorubicin, which is designed to preferentially accumulate in tumors through the EPR effect [Citation65]. In healthy muscle, the microbubble-assisted heating group showed significant (p = .05) elevations of drug relative to the non-microbubble heating group. Such an elevation is consistent with the ability of microbubbles to promote the extravasation of drugs through permeability increases and mechanical streaming effects [Citation36]. The level of drug accumulation in both heated and unheated tumors was significantly higher than in healthy muscle. This is consistent with tumor tissue having more leaky vasculature relative to muscle tissue. A corresponding elevation in tumors for the microbubble versus saline (control) heating groups was not observed. The reason for this remains to be established. One explanation may be that the microbubbles are not eliciting a significant increase in extravasation under the exposure conditions that were employed. A second may be that a degree of vascular damage may have been occurring that offset increases in permeability.
Vascular damage was not assessed in this study, but has been previously shown to occur within tumors due to microbubbles [Citation66,Citation67], albeit under conditions that were associated with high levels of inertial cavitation which were only observed in a subset of cases in the present study. Vascular damage with associated reduction in blood perfusion would result in reduced heat transfer by blood thus further contributing to the decrease in the required power. It is also notable that heated (with or without microbubbles) tumors did not show significantly enhanced drug uptake relative to unheated tumors. This is in apparent contrast to a previous study employing 41°C hyperthermia with a liposomal formulation similar to Caelyx, where a modest yet significantly enhanced accumulation was observed in heated versus unheated Vx2 tumors. A contributing factor to the differences in results may be that our tumors were harvested at the 24 h point compared to the 4 h point employed in [Citation19]. In addition, the tumor sizes employed in the present study were relatively small compared to these previous studies which may have resulted in different sensitivities to hyperthermia promoting drug uptake.
The observation that the skin overlying the sonicated tissue showed enhanced drug concentration when compared with unsonicated skin. This was likely the result of insufficient washing of the depilatory lotion from the skin on the treated side which led to irritation and skin reddening even away from the path of ultrasound propagation in some cases. It is important to note that skin tissue which did not receive depilatory lotion was not sampled in this study.
It is also important to note that the benchtop fluorometry method used to quantify the drug delivery in this work is an antiquated technique and makes several simplifying assumptions, including that the homogenization method extracts 100% of doxorubicin bound in tissue. Correlating the fluorescence of doxorubicin directly to its concentration is confounded by the fact that doxorubicin’s fluorescent properties can change as a function of its environment [Citation68]. It has been shown, for example, that doxorubicin fluorescence is highly quenched when interacting with DNA while its fluorescent intensity is amplified when interacting with histones [Citation69,Citation70]. Future work will entail using a high-performance liquid chromatography technique with daunorubicin as an internal standard which is a much more accurate analytical technique for measuring doxorubicin concentration in tissue.
Clinically, mild MRgFUS hyperthermia treatment durations can last for 30 min to as long as several hours to increase vessel permeability, induce expression of heat shock proteins as well as to induce other biological effects on both the tissue and cellular levels. Due to the short circulation time of microbubbles in the bloodstream, it remains an open question how to administer the microbubbles to maximize their therapeutic effect in the clinical context. We envision that the total dose of microbubbles can be fractionated into several low-dose bolus injections or slowly infused over a longer duration to be able to impact a larger fraction of the clinical hyperthermia treatment. Further investigation to this end is warranted.
In this work, we have also employed a relatively simple approach which was to use a single focal zone with continuous wave insonation and employ only temperature feedback to determine the applied power level. With this method, it was established that microbubbles reduced the acquired power levels to achieve hyperthermia. The approach did not however take into account pressure dependent bioeffects related to either drug delivery or drug potentiation, or the possibility that microbubbles were being disrupted within the focal zone. The investigation of more sophisticated exposure schemes and feedback control systems that take these effects into consideration is warranted, in particular through the combined use of temperature and cavitation signals [Citation71]. For example, this could entail intermittent pauses in exposures to permit reperfusion, and the use of different exposure amplitudes that are designed to both achieve heating and microbubble-related bioeffects. In this regard, it is also of interest to carry out longitudinal experiments that capture possible interacting bioeffects of hyperthermia, chemotherapy, and microbubbles.
It has long been recognized that hyperthermia can promote the antitumor effects of chemotherapeutic agents and, separate from this, microbubble-induced vascular damage has been shown to enhance the effects of chemotherapeutic agents [Citation38,Citation67]. In addition to conventional chemotherapeutic agents such as Caelyx, the use of this approach with drug formulations that release their payload at mild hyperthermia temperatures such as ThermoDox® should be examined, in part, due to the many pre-clinical successes using such formulations [Citation72–74]. Furthermore, the investigation of microbubble-assisted hyperthermia in combination with radiotherapy is also warranted as both hyperthermia [Citation75,Citation76] and ultrasound stimulated microbubbles [Citation77] have been shown to enhance the effects of radiotherapy.
Conclusions
This study has demonstrated the potential of using microbubbles during mild MRgFUS hyperthermia to reduce the applied power requirements which has considerable clinical implications for treating tumors. The elevated levels of drug found in muscle but not in tumor tissue suggest a complex interplay between the heating effects of microbubbles with those of enhanced permeabilization and possible vascular damage. This requires further investigation, which will entail more sophisticated control approaches that integrate temperature and cavitation feedback, as well as assessing their collective antitumor effects.
Acknowledgments
The authors would like to thank Dr. Yuexi Huang for many helpful discussions, as well as his assistance and instruction on how to operate the MRI scanner; Shawna Rideout-Gros, Viva Chan and Sylvia Lam for their help with animal preparation and monitoring during experiments; Anthony Chau and Rooke Reyes for their help with the MR-compatible positioning system; Dr. Meaghan A. O’Reilly and Sanjana Seerala for their help with the wideband acoustic receiver fabrication; Moe Kazem for his help manufacturing the acoustic lens; Woey (William) Li for manufacturing the MRI receive coil; and Kairavi Shah for her instruction regarding tissue homogenization procedures.
Disclosure statement
Kullervo Hynynen is a co-founder and has shares in FUS Instruments, a company that is commercializing the preclinical FUS system used in these experiments. Marc A. Santos works as a paid consultant for FUS Instruments.
Additional information
Funding
References
- Dewhirst MW, Vujaskovic Z, Jones E. Re-setting the biologic rationale for thermal therapy. Int J Hyperthermia. 2005;21:779–790.
- Issels RD, Kampmann E, Kanaar R, et al. Hallmarks of hyperthermia in driving the future of clinical hyperthermia as targeted therapy: translation into clinical application. Int J Hyperthermia. 2016;32:89–95.
- Datta NR, Ordóñez SG, Gaipl US, et al. Local hyperthermia combined with radiotherapy and-/or chemotherapy: recent advances and promises for the future. Cancer Treat Rev. 2015;41:742–753.
- Horsman MR, Overgaard J. Hyperthermia: a potent enhancer of radiotherapy. Clin Oncol (R Coll Radiol)). 2007;19:418–426.
- Kong G, Braun RD, Dewhirst MW. Hyperthermia enables tumor-specific nanoparticle delivery: effect of particle size. Cancer Res. 2000;60:4440–4445.
- Chen B, Zhou M, Xu LX. Study of vascular endothelial cell morphology during hyperthermia. J Therm Biol. 2005;30:111–117.
- Issels RD. Hyperthermia adds to chemotherapy. Eur J Cancer. 2008;44:2546–2554.
- Maeda H. Macromolecular therapeutics in cancer treatment: the EPR effect and beyond. J Control Release. 2012;164:138–144.
- Myerson RJ, Moros EG, Diederich CJ, et al. Components of a hyperthermia clinic: recommendations for staffing, equipment, and treatment monitoring. Int J Hyperthermia. 2014;30:1–5.
- Mallory M, Gogineni E, Jones GC, et al. Therapeutic hyperthermia: the old, the new, and the upcoming. Crit Rev Oncol Hematol. 2016;97:56–64.
- Guthkelch AN, Carter LP, Cassady JR, et al. Treatment of malignant brain tumors with focused ultrasound hyperthermia and radiation: results of a phase I trial. J Neurooncol. 1991;10:271–284.
- Wu F, Wang Z-B, Cao Y-D, et al. A randomised clinical trial of high-intensity focused ultrasound ablation for the treatment of patients with localised breast cancer. Br J Cancer. 2003;89:2227–2233.
- Kennedy JE. High-intensity focused ultrasound in the treatment of solid tumours. Nat Rev Cancer. 2005;5:321–327.
- Elias WJ, Lipsman N, Ondo WG, et al. A randomized trial of focused ultrasound thalamotomy for essential tremor. N Engl J Med. 2016;375:730–739.
- Ishihara Y, Calderon A, Watanabe H, et al. A precise and fast temperature mapping using water proton chemical shift. Magn Reson Med. 1995;34:814–823.
- Jolesz FA, Hynynen K. MRI guided focused US. New York, NY: Informa Healthcare; 2008.
- Lee J, Farha G, Poon I, et al. Magnetic resonance-guided high-intensity focused ultrasound combined with radiotherapy for palliation of head and neck cancer—a pilot study. J Ther Ultrasound. 2016;4:12.
- Chu W, Staruch RM, Pichardo S, et al. Magnetic resonance–guided high-intensity focused ultrasound hyperthermia for recurrent rectal cancer: MR thermometry evaluation and preclinical validation. Int. J Radiat Oncol. 2016;95:1259–1267.
- Ping X, Angang D, Xia G, et al. Improved efficacy of liposomal doxorubicin treatment of superficial tumors by thermotherapy. Technol Cancer Res Treat. 2016;15:314–321.
- Ponce AM, Viglianti BL, Yu D, et al. Magnetic resonance imaging of temperature-sensitive liposome release: drug dose painting and antitumor effects. J Natl Cancer Inst. 2007;99:53–63.
- Staruch RM, Chopra R, Hynynen K. Localised drug release using MRI-controlled focused ultrasound hyperthermia. Int J Hyperthermia. 2011;27:156–171.
- Ranjan A, Jacobs GC, Woods DL, et al. Image-guided drug delivery with magnetic resonance guided high intensity focused ultrasound and temperature sensitive liposomes in a rabbit Vx2 tumor model. J Control Release. 2012;158:487–494.
- de Smet M, Hijnen NM, Langereis S, et al. Magnetic resonance guided high-intensity focused ultrasound mediated hyperthermia improves the intratumoral distribution of temperature-sensitive liposomal doxorubicin. Invest Radiol. 2013;48:395–405.
- Hijnen NM, Langereis S, Grüll H. Magnetic resonance guided high-intensity focused ultrasound for image-guided temperature-induced drug delivery. Adv Drug Deliv Rev. 2014;72:65–81.
- Hynynen K, DeYoung D, Kundrat M, et al. The effect of blood perfusion rate on the temperature distributions induced by multiple, scanned and focused ultrasonic beams in dogs’ kidneys in vivo. Int J Hyperthermia. 1989;5:485–497.
- Hynynen K. Effect of tissue perfusion on temperature elevation. Ultrasound Med Biol. 1989;15 Suppl 1:41–43. discussion 45-46.
- Hynynen K, Shimm D, Anhalt D, et al. Temperature distributions during clinical scanned, focused ultrasound hyperthermia treatments. Int J Hyperthermia. 1990;6:891–908.
- Holt RG, Roy RA. Measurements of bubble-enhanced heating from focused, MHz-frequency ultrasound in a tissue-mimicking material. Ultrasound Med Biol. 2001;27:1399–1412.
- McDannold NJ, Vykhodtseva NI, Hynynen K. Microbubble contrast agent with focused ultrasound to create brain lesions at low power levels: MR imaging and histologic study in rabbits. Radiology. 2006;241:95–106.
- Coussios CC, Roy RA. Applications of acoustics and cavitation to noninvasive therapy and drug delivery. Annu Rev Fluid Mech. 2008;40:395–420.
- Coussios CC, Farny CH, Ter Haar G, et al. Role of acoustic cavitation in the delivery and monitoring of cancer treatment by high-intensity focused ultrasound (HIFU). Int J Hyperthermia. 2007;23:105–120.
- Stride E, Saffari N. The potential for thermal damage posed by microbubble ultrasound contrast agents. Ultrasonics. 2004;42:907–913.
- Klotz AR, Lindvere L, Stefanovic B, et al. Temperature change near microbubbles within a capillary network during focused ultrasound. Phys Med Biol. 2010;55:1549–1561.
- Goertz DE. An overview of the influence of therapeutic ultrasound exposures on the vasculature: high intensity ultrasound and microbubble-mediated bioeffects. Int J Hyperthermia. 2015;31:134–144.
- Hynynen K, McDannold N, Vykhodtseva N, et al. Noninvasive MR imaging-guided focal opening of the blood-brain barrier in rabbits. Radiology. 2001;220:640–646.
- Price RJ, Skyba DM, Kaul S, et al. Delivery of colloidal particles and red blood cells to tissue through microvessel ruptures created by targeted microbubble destruction with ultrasound. Circulation. 1998;98:1264–1267.
- Skyba DM, Price RJ, Linka AZ, et al. Direct in vivo visualization of intravascular destruction of microbubbles by ultrasound and its local effects on tissue. Circulation. 1998;98:290–293.
- Todorova M, Agache V, Mortazavi O, et al. Antitumor effects of combining metronomic chemotherapy with the antivascular action of ultrasound stimulated microbubbles. Int J Cancer. 2013;132:2956–2966.
- Hynynen K. Hot spots created at skin-air interfaces during ultrasound hyperthermia. Int J Hyperthermia. 1990;6:1005–1012.
- Cain CA, Umemura S. Concentric-ring and sector-vortex phased-array applicators for ultrasound hyperthermia. IEEE Trans Microwave Theory Techn. 1986;34:542–551.
- Umemura S, Cain CA. The sector-vortex phased array: acoustic field synthesis for hyperthermia. IEEE Trans Ultrason Ferroelectr Freq Control. 1989;36:249–257.
- Fjield T, Sorrentino V, Cline H, et al. Design and experimental verification of thin acoustic lenses for the coagulation of large tissue volumes. Phys Med Biol. 1997;42:2341–2354.
- Hynynen K. Acoustic power calibrations of cylindrical intracavitary ultrasound hyperthermia applicators. Med Phys. 1993;20:129–134.
- Ellens NPK, Kobelevskiy I, Chau A, et al. The targeting accuracy of a preclinical MRI-guided focused ultrasound system. Med Phys. 2015;42:430–439.
- Chung AH, Hynynen K, Colucci V, et al. Optimization of spoiled gradient-echo phase imaging for in vivo localization of a focused ultrasound beam. Magn Reson Med. 1996;36:745–752.
- Huang SK, Stauffer PR, Hong K, et al. Liposomes and hyperthermia in mice: increased tumor uptake and therapeutic efficacy of doxorubicin in sterically stabilized liposomes. Cancer Res. 1994;54:2186–2191.
- Poorter JD, Wagter CD, Deene YD, et al. Noninvasive MRI thermometry with the proton resonance frequency (PRF) method: in vivo results in human muscle. Magn Reson Med. 1995;33:74–81.
- Chung AH, Jolesz FA, Hynynen K. Thermal dosimetry of a focused ultrasound beam in vivo by magnetic resonance imaging. Med Phys. 1999;26:2017–2026.
- Duck FA. Physical properties of tissue a comprehensive reference book. London: Academic Press; 1990.
- Moros EG, Dutton AW, Roemer RB, et al. Experimental evaluation of two simple thermal models using hyperthermia in muscle in vivo. Int J Hyperthermia. 1993;9:581–598.
- Hutchinson E, Dahleh M, Hynynen K. The feasibility of MRI feedback control for intracavitary phased array hyperthermia treatments. Int J Hyperthermia. 1998;14:39–56.
- Sapareto SA, Dewey WC. Thermal dose determination in cancer therapy. Int J Radiat Oncol Biol Phys. 1984;10:787–800.
- Oreilly MA, Hynynen K. A PVDF receiver for ultrasound monitoring of transcranial focused ultrasound therapy. IEEE Trans Biomed Eng. 2010;57:2286–2294.
- Bachur NR, Moore AL, Bernstein JG, et al. Tissue distribution and disposition of daunomycin (NCS-82151) in mice: fluorometric and isotopic methods. Cancer Chemother Rep. 1970;54:89–94.
- Treat LH, McDannold N, Vykhodtseva N, et al. Targeted delivery of doxorubicin to the rat brain at therapeutic levels using MRI-guided focused ultrasound. Int J Cancer. 2007;121:901–907.
- Staruch RM, Chopra R, Hynynen K. Hyperthermia in bone generated with MR imaging-controlled focused ultrasound: control strategies and drug delivery. Radiology. 2012;263:117–127.
- Conturo TE, Smith GD. Signal-to-noise in phase angle reconstruction: dynamic range extension using phase reference offsets. Magn Reson Med. 1990;15:420–437.
- Rieke V, Butts Pauly K. MR thermometry. J Magn Reson Imaging. 2008;27:376–390.
- Sanghvi NT, Fry FJ, Foster RS, et al. High intensity focused ultrasound treatment of prostate tissue in the presence of an US contrast agent. J Ultrasound Med. 1995;14:S17.
- Tran BC, Jongbum S, Hall TL, et al. Microbubble-enhanced cavitation for noninvasive ultrasound surgery. IEEE Trans Ultrason Ferroelectr Freq Control. 2003;50:1296–1304.
- Hynynen K. The threshold for thermally significant cavitation in dog's thigh muscle in vivo. Ultrasound Med Biol. 1991;17:157–169.
- Sokka SD, King R, Hynynen K. MRI-guided gas bubble enhanced ultrasound heating in in vivo rabbit thigh. Phys Med Biol. 2003;48:223–241.
- Goertz DE, Wright C, Hynynen K. Contrast agent kinetics in the rabbit brain during exposure to therapeutic ultrasound. Ultrasound Med Biol. 2010;36:916–924.
- Choi JJ, Coussios CC. Spatiotemporal evolution of cavitation dynamics exhibited by flowing microbubbles during ultrasound exposure. J Acoust Soc Am. 2012;132:3538–3549.
- Maeda H, Nakamura H, Fang J. The EPR effect for macromolecular drug deliver to solid tumors: improvements of tumor uptake, lowering of systemic toxicity, and distinct tumor imaging in vivo. Adv Drug Deliv Rev. 2013;65:71–79.
- Burke CW, Klibanov AL, Sheehan JP, et al. Inhibition of glioma growth by microbubble activation in a subcutaneous model using low duty cycle ultrasound without significant heating: Laboratory investigation. J Neurosurg. 2011;114:1654–1661.
- Goertz DE, Todorova M, Mortazavi O, et al. Antitumor effects of combining docetaxel (taxotere) with the antivascular action of ultrasound stimulated microbubbles. PloS One. 2012;7:e52307.
- Eetezadi S, De Souza R, Vythilingam M, et al. Effects of doxorubicin delivery systems and mild hyperthermia on tissue penetration in 3D cell culture models of ovarian cancer residual disease. Mol Pharmaceutics. 2015;12:3973–3985.
- Mohan P, Rapoport N. Doxorubicin as a molecular nanotheranostic agent: effect of doxorubicin encapsulation in micelles or nanoemulsions on the ultrasound-mediated intracellular delivery and nuclear trafficking. Mol Pharm. 2010;7:1959–1973.
- Karukstis KK, Thompson EHZ, Whiles JA, et al. Deciphering the fluorescence signature of daunomycin and doxorubicin. Biophys Chem. 1998;73:249–263.
- Arvanitis CD, McDannold N. Integrated ultrasound and magnetic resonance imaging for simultaneous temperature and cavitation monitoring during focused ultrasound therapies: simultaneous temperature and cavitation mapping. Med Phys. 2013;40:112901.
- Tagami T, Ernsting MJ, Li SD. Efficient tumor regression by a single and low dose treatment with a novel and enhanced formulation of thermosensitive liposomal doxorubicin. J Control Release. 2011;152:303–309.
- Grull H, Langereis S. Hyperthermia-triggered drug delivery from temperature-sensitive liposomes using MRI-guided high intensity focused ultrasound. J Control Release. 2012;161:317–327.
- Lokerse WJM, Bolkestein M, Hagen T, et al. Investigation of particle accumulation, chemosensitivity and thermosensitivity for effective solid tumor therapy using thermosensitive liposomes and hyperthermia. Theranostics. 2016;6:1717–1731.
- Datta NR, Bose AK, Kapoor HK, et al. Head and neck cancers: results of thermoradiotherapy versus radiotherapy. Int J Hyperthermia. 1990;6:479–486.
- Jones EL, Oleson JR, Prosnitz LR, et al. Randomized trial of hyperthermia and radiation for superficial tumors. J Clin Oncol. 2005;23:3079–3085.
- Czarnota GJ, Karshafian R, Burns PN, et al. Tumor radiation response enhancement by acoustical stimulation of the vasculature. Proc Natl Acad Sci USA. 2012;109:E2033–E2041.