
 ?Mathematical formulae have been encoded as MathML and are displayed in this HTML version using MathJax in order to improve their display. Uncheck the box to turn MathJax off. This feature requires Javascript. Click on a formula to zoom.
Abstract
Objective: This retrospective study aimed (1) to investigate the magnetic resonance imaging (MRI) features influencing a nonperfused volume ratio (NPVr) ≥ 90% after high-intensity focussed ultrasound (HIFU) ablation of adenomyosis, and (2) to assess the safety, which was defined in terms of adverse events (AEs) and changes in anti-Mullerian hormone (AMH) concentrations, and clinical efficacy, which was defined in terms of adenomyosis volume reduction and symptom improvement at 6 months’ follow-up.
Methods: Sixty-six women who underwent HIFU treatment were divided into groups A (NPVr ≥90%; n = 26) and B (NPVr <90%, n = 40). Multivariate logistic regression analyses of MRI features were conducted to identify the potential predictors of an NPVr ≥90%.
Results: Generalized estimating equation (GEE) analysis was used to model the prediction of an NPVr ≥90% with four significant predictors from multivariate analyses: the thickness of the subcutaneous fat layer, adenomyosis volume, T2 signal intensity (SI) ratio of adenomyosis to myometrium, and the Ktrans ratio of adenomyosis to myometrium. Clinical efficacy was significantly greater in group A than in group B. The findings showed no serious AEs and no significant differences between AMH concentrations before and 6 months after treatment.
Conclusions: The present retrospective study demonstrated that achievement of NPVr ≥90% as a measure of clinical treatment success in MRI-guided HIFU treatment of adenomyosis using multivariate analyses and a prediction model is clinically possible without compromising the safety of patients.
Introduction
Adenomyosis, which is categorized as diffuse or focal according to the extent of the lesion, is a common gynecological condition with multiple symptoms that negatively affect the health of women of reproductive age. The primary characteristic of adenomyosis involves infiltration of the endothelial tissue of the endothelium layer into the smooth muscle tissue in the myometrium [Citation1–4]. Although hysterectomy can be performed for treatment of symptomatic adenomyosis, the procedure requires general anesthesia and hospitalization and has a long recovery period. Other preservative options, which can be used depending on patient preference, symptom severity, adenomyosis lesion characteristics and fertility, include laparoscopic surgery, gonadotropin-releasing hormone agonist (GnRHa) treatment, uterine artery embolization and either magnetic resonance imaging (MRI)- or ultrasonography (US)-guided high-intensity focussed ultrasound (HIFU).
HIFU, one of the most promising non-invasive ablation techniques, uses ultrasound to thermally ablate adenomyotic lesions. In addition, MRI does provide not only for superior soft tissue contrast, three-dimensional imaging and real-time temperature measurement but also facilitates patient selection and treatment planning and strategies, as well as monitor the response of adenomyosis to therapies and evaluate the outcome. In the last decade, several studies [Citation5–17] have documented the close relationship between the nonperfused volume ratio (NPVr), which is the ratio of the adenomyosis volume that was not enhanced in T1-weighted (T1W) perfusion MR images acquired immediately after HIFU treatment to the adenomyosis volume in T2-weighted (T2W) images obtained before HIFU treatment, and mid- and long-term improvement in patients with adenomyosis.
In terms of symptom improvement, the clinical effectiveness of HIFU for the treatment of adenomyosis has been reported to be associated with an NPVr >50% by Wang et al. [Citation6] and Zhou et al. [Citation7], and >70% by Zhang et al. [Citation10]. Recently, a new classification method based on MRI T1 perfusion-based time–signal intensity (SI) curves for adenomyosis tissue compared with those for the myometrium in screening MRI was introduced [Citation17] for predicting the treatment outcome of HIFU ablation. In the preliminary findings throughout the mid-term follow-up period, patients with NPVr ≥80% showed significantly greater adenomyosis volume reduction and symptom improvement than those with NPVr <80%. Furthermore, the Food and Drug Administration has set an immediate NPVr target of up to 100% for MRI-guided HIFU treatment in cases of uterine disease [Citation18].
Considering the importance of high post-treatment NPVr in achieving good treatment outcomes, the aim of this retrospective study was two-fold: (1) to investigate the MRI features influencing an immediate NPVr ≥90% after HIFU ablation of adenomyosis, which was a measure of clinical treatment success, and (2) to assess the safety, in terms of adverse events (AEs) and changes in anti-Mullerian hormone (AMH) concentrations, and clinical efficacy, defined as adenomyosis volume reduction and the symptom severity score improvement at 6 months’ follow-up, associated with an NPVr ≥90%.
Materials and methods
Ethics statement and patient characteristics
This retrospective study was approved by the institutional review board and was performed in accordance with the 1964 Helsinki declaration. Written informed consent was obtained from each patient prior to initiation of any study-related procedures. Premenopausal women who were aged 18 years or older, diagnosed with symptomatic adenomyosis, showed tolerance to MRI contrast agents, communicated clearly with a physician during HIFU treatment, and agreed to undergo MRI examinations before and at 6 months after HIFU treatment were included in this study.
Of the 130 Vietnamese women screened for MRI-guided HIFU treatment in this study, 66 (40.6 ± 6.6 years; range, 30–56 years; median body mass index [BMI] of 19.5 ± 1.5 kg/m2 [17.9–24.1 kg/m2]) with symptomatic adenomyosis who underwent HIFU treatment over a 22-month period beginning in June 2015 were reviewed and divided into two groups: group A included patients with an NPV ratio ≥90% (n = 26) and group B included patients with an NPVr <90% (n = 40). Baseline characteristics of the study population are summarised in . Based on the findings of previous studies [Citation6,Citation7,Citation10], patients in group B were further subdivided into three groups: subgroup I included patients with an NPVr <50% (n = 13); subgroup II included patients with an NPVr ≥50% and <70% (n = 9); and subgroup III included patients with an NPVr ≥70% and <90% (n = 18).
Table 1. Comparison of the baseline characteristics in patient groups with NPVr ≥90% and NPVr <90%.
The most frequent reasons for exclusion of participants (n = 64; 49.2%) were (i) MRI findings such as adenomyosis located deep in the pelvis (n = 18; 28.1%), ovarian tumour (n = 16; 25%), endometriosis (n = 5; 7.8%), pelvic inflammation (n = 5; 7.8%), systematic disease (n = 2; 3.1%), cancer disease (n = 1; 1.6%), and (ii) preference for alternative treatment options for personal reasons (n = 17; 26.6%).
MRI protocols
The HIFU treatments were conducted using a clinical HIFU system (Sonalleve; Profound Medical Inc., Canada) integrated with a 1.5 T MR scanner (Ingenia; Philips, The Netherlands).
The patients underwent routine screening with dynamic contrast-enhanced (DCE) perfusion MRI after initiation of intravenous administration of Gd-DO3A-butrol (0.1 mmol/kg of body weight; Gadovist; Bayer Schering Pharma, Germany). T2W 3 D turbo spin echo images were acquired for screening, treatment planning, and 6 months’ follow-up assessments. A fat-saturated T1W fast field echo sequence for assessment of adenomyosis characteristics was acquired immediately after HIFU treatment and at 6 months’ follow-up. The RF-spoiled gradient-recalled echo planar imaging sequence was used for monitoring MR thermometry in three coronal slices perpendicular to the beam axis centred at the focus, and one sagittal slice aligned along the beam propagation direction along with two additional slices positioned to monitor potential excessive near-field (e.g., over the thick abdominal muscle covering the whole beam path) and far-field (e.g., in front of the sciatic nerve and large intestine) tissue heating. The details regarding MRI protocols have been described elsewhere [Citation17].
MRI features of adenomyosis
The following baseline characteristics features were assessed on T2W MR images: uterus position (anteverted or retroverted); adenomyosis position (anterior, posterior, or anterior-posterior); adenomyosis type (focal or diffuse); adenomyosis volume; distance from the posterior surface of the adenomyosis lesion to the skin; and thickness of the subcutaneous fat layer. In addition, the SI of the adenomyosis, the SI ratio of the adenomyosis to the myometrium, and the number of foci inside the adenomyosis were determined as T2 MRI features.
The following quantitative perfusion MRI features were assessed using the MR Permeability tool on the IntelliSpace Portal software (version 6.0, Philips): volume transfer constant, Ktrans; reverse reflux rate constant, Kep; volume fraction of extravascular extracellular space, Ve; and volume fraction of plasma, Vp. To quantify the time-SI curves on T1W perfusion MRI, which were derived from DCE-MRI data, the ratio of each quantitative perfusion parameter was defined as the ratio of the SI of the adenomyosis to that of the myometrium.
Regions of interest were manually placed over the center of the adenomyosis lesion without any overlap of the poorly defined borderlines between the endometrium and myometrium, and over the normal myometrium while avoiding the surrounding structures from both the T1W perfusion MR and screening T2W images.
AEs and therapeutic efficacy
Any complications and AEs during HIFU treatment and the follow-up period were recorded and classified according to the Society of Interventional Radiology (SIR) guidelines [Citation19]. AMH is an effective indicator of ovarian reserve. Given the concern that an NPVr ≥90% could negatively affect ovarian function, AMH serum concentrations were assessed in a single run via enzyme-linked immune analysis with an AMH Gen II enzyme-linked immunosorbent assay kit (Beckman Coulter Inc., Brea, CA) before treatment and before treatment and at 6 months after treatment [Citation20].
The clinical efficacy of MRI-guided HIFU ablation of adenomyosis was based on the symptom severity score (SSS) index, which was assessed using a questionnaire described by Spies et al. [Citation21] and the adenomyosis volume reduction ratio, which was calculated using the following formula:
where adenomyosis volume was calculated assuming the volume (v) of a prolate ellipsoid with the equation v = 1/6 π × a × b × c, where a, b, and c are diameters measured in orthogonal planes on T2W images at baseline before treatment and at 6 months after treatment.
Statistical analysis
Continuous variables were expressed as mean values ± standard deviation and range. Comparisons of baseline features, adenomyosis and HIFU procedure characteristics, and therapeutic responses in groups A and B were performed using the appropriate statistical test (chi-squared test, Fisher’s exact test, Mann–Whitney U test, one-way analysis of variance [ANOVA] test, or Wilcoxon test). Post-hoc analysis between subgroups was performed with the Bonferroni correction method to adjust for multiple comparisons.
Multivariate logistic regression analyses were carried out with MRI features of adenomyosis (e.g., baseline, T2-MRI and quantitative perfusion MRI features) to identify the potential predictors of an NPVr ≥90% as seen in . Using all the significant screening MRI features acquired from the multivariate analyses, a generalized estimating equation (GEE) was created to predict the treatment outcome with an immediate NPVr ≥90% [Citation22].
Table 2. Independent factors associated with an NPVr ≥90%: Multivariate analysis.
The cut-off values, sensitivity, specificity and area under the curve (AUC) for the prediction of achieving the treatment intent (i.e., NPVr ≥90%) were determined on the basis of receiver operating characteristic (ROC) curve analysis. The Youden index method was used to define the optimal cut-off value as the value whose sensitivity and specificity are the closest to the value of the area under the ROC curve and the absolute value of the difference between the sensitivity and specificity values is minimum [Citation23].
A two-sided p values less than .05 (p < .05) was defined as the level of significance. Statistical analysis was performed using SPSS software (version 24.0, 64-bit edition, IBM Corp., Armonk, NY).
Results
Characteristics of MRI-guided HIFU treatment of adenomyosis
Of the 66 patients, 54 had adenomyosis alone, whereas the remaining 12 were diagnosed with adenomyosis and coexistent intramural fibroids, which were less than 3 cm in diameter. The latter cases were not excluded from our data analysis because the size and location of the coexisting intramural fibroids were assumed to have little or no effect on the symptoms of adenomyosis or the treatment outcomes [Citation5]. There were no significant intergroup differences in baseline characteristics except adenomyosis volume, which was larger in group A (p = .002).
To ensure that the volume of adenomyotic tissue was heated sufficiently, but not excessively, several low-power (<60 W) initial HIFU test sonications were performed to determine a suitable initial therapeutic power level for each treatment cell size at the target location, and the power level was adjusted based on the results of the previous sonicated treatment cells. The mean acoustic sonication power in groups A and B was 143.8 ± 22.3 W (90–170 W) and 171.2 ± 41.1 W (90–240 W; p = .003), respectively, and the corresponding mean treatment duration measured from the first sonication to the last sonication was 115.3 ± 32.3 min (68.0–165.0 min) and 108.1 ± 35.2 min (32.0–164.0 min; p = .408), respectively. The mean treatment speed was 1.15 ± 0.30 ml/min (0.32–1.61 ml/min) and 0.56 ± 0.35 ml/min (0.06–1.43 ml/min) in groups A and B, respectively (p < .001).
The mean NPVr for groups A and B was 93.7 ± 3.4% (90.5–100%) and 60.1 ± 24.7% (10.4–89.6%), respectively. In a subgroup analysis of patients with an NPVr <90%, the mean NPVr was as follows: 30.4 ± 13.5% (10.4–47.6%) in subgroup I; 56.5 ± 4.2% (50.4–62.7%) in subgroup II; and 83.4 ± 3.0% (80.0–89.6%) in subgroup III. In group A, the NPVr was 100% in four patients and at least 90% but less than 100% in 22 patients. Furthermore, in group A, the mean NPVr was 93.5 ± 3.2% (90.5–100.0%; n = 16) for patients with focal adenomyosis and 93.9 ± 3.8% (90.5–100.0%; n = 10) for patients with diffuse adenomyosis, whereas that in group B was 57.2 ± 25.2% (10.4–89.6%; n = 26) for patients with focal adenomyosis and 65.6 ± 23.8% (17.8–88.2%; n = 14) for patients with diffuse adenomyosis.
The NPVr was significantly higher in group A than in group B (p < .001) and significantly different among the three subgroups of group B (p < .001 between subgroups I and II; p < .001 between subgroups I and III; and p < .001 between subgroups II and III). However, there was no statistically significant difference in the immediate treatment outcome between patients with focal adenomyosis and those with diffuse adenomyosis in groups A (p = .765) and B (p = .309).
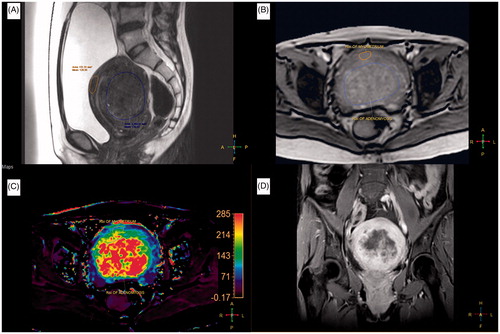
and show examples of a pre-HIFU T2W MR image, pre-HIFU quantitative perfusion MR image, pre-HIFU Ktrans map, and immediately post-HIFU CE-T1W MR image with NPVr ≥90% and <90%, respectively.
Figure 1. A 39-year-old woman with a 138 ml adenomyosis was treated with magnetic resonance imaging (MRI)-guided high-intensity focussed ultrasound (HIFU) ablation. (A) A sagittal T2-weighted (T2W) MR image of the adenomyosis prior to HIFU treatment. (B) A quantitative perfusion MR image was analyzed by drawing a region of interest (ROI) within the area of the adenomyosis lesion and the myometrium on one of the perfusion MR images. (C) The generated Ktrans map. (D) A contrast-enhanced T1-weighted (CE-T1W) MR image obtained immediately after MRI-guided HIFU treatment.
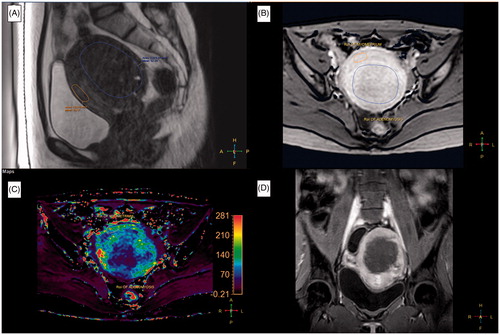
Figure 2. A 38-year-old woman with a 116 ml adenomyosis was treated with magnetic resonance imaging (MRI)-guided high-intensity focussed ultrasound (HIFU) ablation. (A) A sagittal T2-weighted (T2W) MR image of the adenomyosis prior to HIFU treatment. (B) A quantitative perfusion MR image was analyzed by drawing a region of interest (ROI) within the area of the adenomyosis lesion and the myometrium on one of the perfusion MR images. (C) The generated Ktrans map (lower left, left section). (D) A contrast-enhanced T1-weighted (CE-T1W) MR image obtained immediately after MRI-guided HIFU treatment.
Analysis of MRI features influencing an NPVr ≥90%
Multivariate logistic regression analyses were performed to identify independent variables () that significantly and independently influenced achievement of an immediate NPVr ≥90% after HIFU ablation. The Ve ratio of the adenomyosis to myometrium was excluded from the logistic regression analysis due to the multicollinearity phenomenon (), which is based on assessments of the variance inflation factor (VIF) to determine how much the variance of an estimated regression coefficient increases when predictors are correlated; if the VIF exceeds 10, it can be assumed that the regression coefficients are poorly estimated due to multicollinearity [Citation24]. As shown in , the results of the multivariate logistic regression test showed four statistically significant factors (p < .05): the thickness of the subcutaneous fat layer, adenomyosis volume, T2 SI ratio of adenomyosis to myometrium, and Ktrans ratio of adenomyosis to myometrium.
Prediction model: GEE analysis
GEE analysis was used to model the prediction of an NPVr ≥90% with the four statistically significant predictors determined from multivariate analyses,
where x1 = thickness of the subcutaneous fat layer (millimeters), x2 = adenomyosis volume (ml), x3 = T2 SI ratio of adenomyosis to myometrium, and x4 = Ktrans ratio of adenomyosis to myometrium.
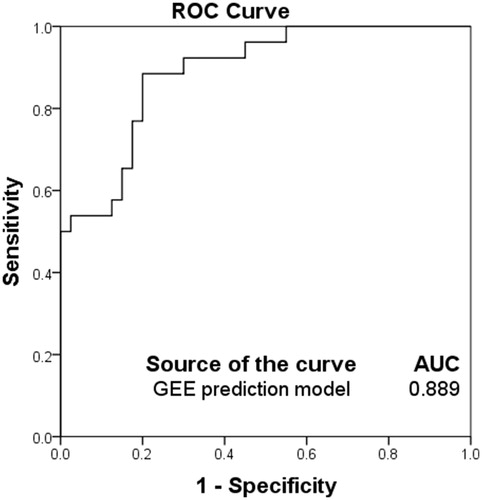
In the ROC analysis performed in this study, a cut-off value of 0.349 to predict the achievement of treatment intent in terms of an NPVr ≥90% yielded a sensitivity value of 0.885, specificity of 0.8 and an AUC of 0.889 (.
Figure 3. The receiver operating characteristic (ROC) curves of the prediction model in predicting the treatment outcome of high-intensity focussed ultrasound (HIFU) ablation with an immediate nonperfused volume ratio (NPVr) ≥ 90%. Sensitivity, specificity and area under the curve were 0.885, 0.8 and 0.889, respectively.
Adverse events
No serious AEs (SAEs) were reported. Four patients in group A and two patients in group B had a superficial skin burn (first degree) that recovered within 12 h without intervention. Seventeen patients reported pain during and after HIFU treatment: back pain (n = 3), leg pain (n = 3), pelvic pain (n = 6) and buttock pain (n = 4), all of which resolved within 3–7 days. Vaginal discharge appeared in 16 patients in both groups and then disappeared after 14–21 days. Numbness of the leg automatically resolved after 14–30 days. Self-limiting nausea occurred in four patients and resolved within 1 h.
Foley catheterization–related cystitis symptoms recovered after treatment with the antibiotics amoxicillin-clavulanic acid (1 gram; 2 per day for 7 days). All these were regarded as minor complications according to the SIR guidelines ().
Table 3. Complications and adverse events (AEs) after HIFU ablation in patient groups with NPVr ≥90% and NPVr <90%.
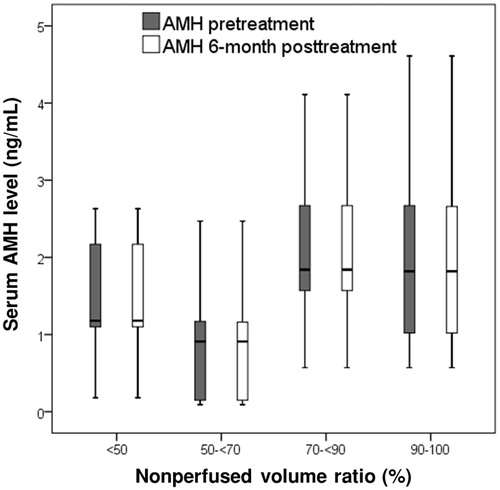
The AMH concentrations before and 6 months after treatment were respectively 1.98 ± 1.15 (0.57–4.61) and 1.98 ± 1.15 (0.57–4.61; p = .327) in group A and 1.65 ± 0.94 (0.09–4.11) and 1.65 ± 0.95 (0.09–4.11; p = .160) in group B (. In the subgroup analysis of patients with NPVr <90%, the AMH concentrations before and 6 months after treatment were respectively 1.49 ± 0.74 (0.18–2.63) and 1.49 ± 0.74 (0.18–2.63; n = 13; p > .05) in subgroup I, 1.00 ± 0.88 (0.09–2.47) and 0.99 ± 0.88 (0.09–2.47; n = 9; p > .05) in subgroup II, and 2.10 ± 0.93 (0.57–4.11) and 2.10 ± 0.93 (0.57–4.11; n = 18; p > .05) in subgroup III (. Furthermore, in group A, the AMH concentrations before and 6 months after treatment were respectively 2.05 ± 1.26 (0.071–4.61) and 2.05 ± 1.26 (0.071–4.61; p > .05) for patients with focal adenomyosis and 1.89 ± 1.02 (0.57–3.61) and 1.89 ± 1.02 (0.57–3.61; p > .05) for patients with diffuse adenomyosis, whereas those in group B were respectively 1.54 ± 0.82 (0.09–3.40) and 1.54 ± 0.82 (0.09–3.40; p > .05) for patients with focal adenomyosis and 1.86 ± 1.15 (0.15–4.11) and 1.86 ± 1.15 (0.15–4.11; p > .05) for patients with diffuse adenomyosis.
Figure 4. The box plot presents the serum anti-Mullerian hormone (AMH) concentrations before and 6 months after magnetic resonance imaging (MRI)-guided high-intensity focused ultrasound (HIFU) treatment in patients with a nonperfused volume ratio (NPVr) of ≥90% and <90%. Data are presented as box-and-whisker plots.
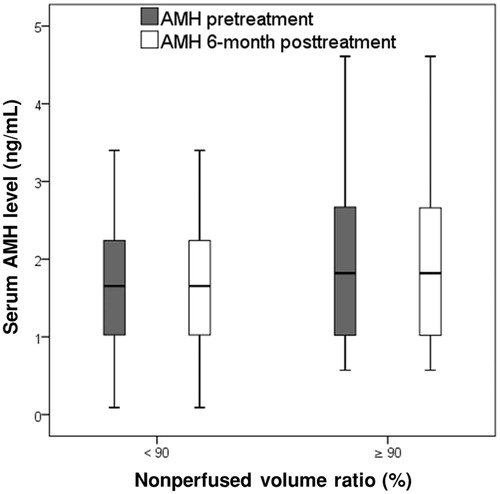
Figure 5. The box plot presents the serum anti-Mullerian hormone (AMH) concentrations before and 6 months after magnetic resonance imaging (MRI)-guided high-intensity focused ultrasound (HIFU) treatment in patients with a nonperfused volume ratio (NPVr) of <50%, ≥50% and <70%, ≥70% and <90% and ≥90%. Data are presented as box-and-whisker plots.
Clinical outcomes 6 months after treatment
The adenomyosis volume reduction ratio 6 months after treatment was 0.34 ± 0.07 (0.17–0.53; n = 26) in group A and 0.17 ± 0.09 (0.0–0.35; n = 40; p < .001) in group B (, ). In the subgroup analysis of patients with NPVr <90%, the volume reduction ratio was 0.09 ± 0.06 (0.0–0.23; n = 13) in subgroup I, 0.12 ± 0.05 (0.02–0.18; n = 9) in subgroup II, and 0.25 ± 0.05 (0.13–0.35; n = 18) in subgroup III (. Furthermore, in group A, the volume reduction ratio was 0.34 ± 0.07 (0.25–0.53; n = 16) for patients with focal adenomyosis and 0.33 ± 0.08 (0.17–0.43; n = 10) for patients with diffuse adenomyosis, whereas that in group B was 0.17 ± 0.10 (0.0–0.35; n = 26) for patients with focal adenomyosis and 0.18 ± 0.08 (0.0–0.27; n = 14) for patients with diffuse adenomyosis.
Figure 6. The box plot demonstrates the 6-month fibroid volume reduction ratios and transformed symptom severe score (tSSS) improvement ratios among different groups as a function of a nonperfused volume ratio (NPVr) of ≥90% and <90%. p < .001 is regarded as highly statistically significant.
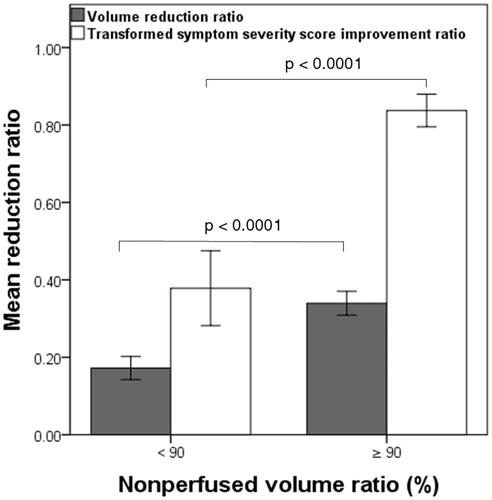
Figure 7. The scatter plot demonstrates tSSS improvement ratios and adenomyosis volume reduction ratios at 6 months for each patient among different groups and subgroups as a nonperfused volume ratio (NPVr) of <50%, ≥50% and <70%, ≥70% and <90% and ≥90%.
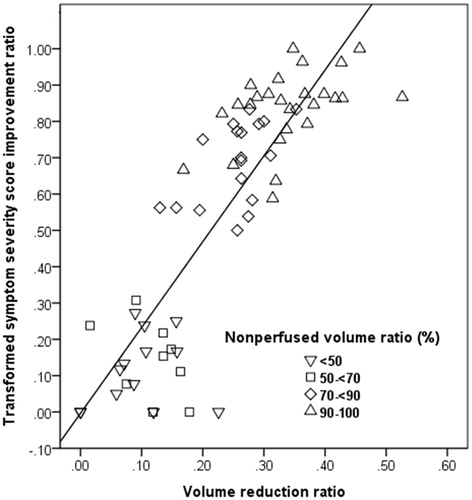
Table 4. Adenomyosis volume and symptom changes in patient groups with NPVr ≥90% and NPVr <90%.
With respect to symptom improvement, the tSSS in groups A and B had respectively decreased from 68.14 ± 15.93 (43.7–90.6) and 68.28 ± 18.29 (28.1–100) at baseline to 11.06 ± 6.92 (0.0–25.0) and 41.88 ± 21.60 (6.3–75.0) at 6 months post-treatment, corresponding to improvement ratios of 0.84 ± 0.10 (0.59–1.0) and 0.38 ± 0.30 (0.0–0.83; p < .001), respectively (, ). In addition, the mean tSSS improvement ratio was 0.11 ± 0.10 (0.0–0.27; n = 13) in subgroup I, 0.14 ± 0.1 (0.0–0.31; n = 9) in subgroup II, and 0.68 ± 0.11 (0.5–0.83; n = 18) in subgroup III (. Moreover, in group A, the mean tSSS improvement ratio was 0.85 ± 0.09 (0.64–1.0; n = 16) for patients with focal adenomyosis and 0.81 ± 0.12 (0.59–0.96; n = 10) for patients with diffuse adenomyosis, whereas that in group B was 0.36 ± 0.32 (0.0–0.83; n = 26) for patients with focal adenomyosis and 0.41 ± 0.28 (0.0–0.79; n = 14) for patients with diffuse adenomyosis.
Adenomyosis volume reduction and symptom improvement were significantly higher in group A than in group B (p < .001) and significantly different among subgroups of group B (p < .001 between subgroups I and III; and p < .001 between subgroups II and III). However, there was no significant difference between subgroups I and II (p > .05). Moreover, there were no statistically significant differences in the adenomyosis volume reduction ratio and tSSS improvement between patients with focal adenomyosis and those with diffuse adenomyosis in groups A and B (p > .05).
Discussion
Adenomyomectomy has been considered as the first-line approach to treat adenomyosis. The procedure aims to achieve thorough excision of the adenomyosis lesion through the margin of tumour and myometrium out of the uterus in order to provide symptom relief and avoid rapid recurrence [Citation25,Citation26]. Furthermore, the current achievements in HIFU treatment for adenomyosis have also demonstrated that symptom relief and the resultant improvement in the patient’s quality of life are related to the amount of adenomyosis tissue being ablated or devascularized [Citation5,Citation7–10,Citation12,Citation13,Citation17]. However, on the basis of our literature search, no studies have focussed on using the immediate NPVr ≥90% as a measure of clinical treatment success and an indicator of the extent of HIFU ablation that should be performed without compromising the safety of patients with adenomyosis, which is one of the most critical aspects of HIFU treatment.
Multivariate analysis of the baseline features in our study suggested that the thickness of the subcutaneous fat layer and the adenomyosis volume might be valuable predictors of HIFU ablation with an NPVr ≥90% (p < .05, ). The beam of focussed ultrasound energy penetrates through several tissue layers, including the skin, subcutaneous fat tissue, muscle and other soft tissues, and causes localized high temperatures (>55 °C) at the target location. Because of the acoustic properties of adipose tissue, an increase in deposited energy can inevitably lead to elevated temperatures in the subcutaneous tissue (e.g., fat burn) and the associated defocusing of ultrasound might result in insufficient HIFU energy delivery to the target location. Previous studies by Zhang et al. [Citation10] and Gong et al. [Citation14] reported that the abdominal subcutaneous fat thickness was one of the significant parameters negatively correlated with the NPVr because of the absorption and distortion of sonication energy by adipose tissue. In a study by Mikami et al [Citation27], based on early experience, the HIFU procedure was technically successful in 32 of 48 patients with a symptomatic uterine fibroid. The mean thickness of subcutaneous and ventral visceral fat tissue in the technical success group was less than 20 mm. However, of the seven patients in the technical failure group, the mean thickness of the subcutaneous and ventral visceral fat tissue was larger than 20 mm. In our study, the mean subcutaneous fat thickness of Vietnamese patient populations was less than 13 mm in both groups. Thus, patients with thicker subcutaneous fat might have a higher risk of subcutaneous fat burn and a lower chance of achieving high NPVr. With regard to adenomyosis volume, Gong et al. [Citation14] reported that the adenomyosis volume was positively correlated with the NPVr, suggesting that the NPVr will be higher in patients with larger adenomyosis lesions. This could be explained by the combination of direct HIFU damage and cumulative heating effect phenomenon due to high energy deposition per sonication that might result in thrombotic occlusion of the blood supply within the adenomyosis [Citation28]. The findings in our study are in agreement with the results of previous HIFU studies [Citation10,Citation14,Citation27].
The T2W MR images suggested that various imaging features of adenomyosis lesions, including the degree of vascularity, water content of the smooth muscle, ectopic glands, haemorrhage and fibrous content might have different effects on HIFU energy deposition [Citation4,Citation14,Citation29]. In a clinical study by Kim et al. [Citation30], the SI of adenomyosis on T2W MRI was classified as ‘dark’ (if the SI of the adenomyosis was lower than that of the rectus abdominis muscle), ‘low’ (if the SI of the adenomyosis was between that of the rectus abdominis muscle and the normal myometrium), or ‘heterogeneous’ (if the SI of the adenomyosis was equal to that of the myometrium). The results of their study demonstrated that an adenomyosis with dark or low SI was associated with better results than that with heterogenous SI. In our study, among the T2 MRI group features, the SI ratio of the adenomyosis to the myometrium was the only significant feature for predicting an NPVr ≥90% (p < .001), suggesting that the SI of the adenomyosis relative to that of the myometrium in T2W imaging might play an important role in predicting an NPVr ≥90%.
The Ktrans is one of the most important parameters in the quantitative perfusion data extracted from DCE-MRI and predominantly reflects blood perfusion and vascular permeability, which critically cause inevitable heat diffusion out of the target lesion in HIFU ablation of adenomyosis. Kim et al. [Citation31] showed the ability of baseline DCE-MRI to predict the ablation efficacy of HIFU treatment of symptomatic uterine fibroids under various parameter settings and found that a high Ktrans value in baseline DCE-MRI might be a significant predictor of poor treatment results. In addition, a recent study by Keserci et al. [Citation17] suggests that HIFU treatment has minimal effects on the normal myometrium due to low tissue density of the myometrium and its high moisture content [Citation32]. In our study, the multivariate analysis of quantitative perfusion MR features showed that the Ktrans ratio of the adenomyosis to the myometrium was another significant feature for predicting an NPVr ≥90%. This finding indicates that an adenomyosis with significantly higher Ktrans values in comparison with the normal myometrium shows higher perfusion and rapid blood flow, which may lead to clinical inefficiency in HIFU therapy. Our findings concur with Pennes’ model and the results of previous studies [Citation17,Citation31,Citation33–35].
The present work introduces a GEE model for predicting an NPVr ≥90% with four statistically significant MRI parameters obtained from multivariate analyses: the thickness of the subcutaneous fat layer, adenomyosis volume, T2 SI ratio of adenomyosis to myometrium, and the Ktrans ratio of the adenomyosis to the myometrium. The determination of an optimal cut-off value to discriminate patients with low and high chances of achieving an NPVr <90% will have a critical impact on the treatment outcome. The primary findings from the ROC curve analysis in our study confirm that the GEE prediction model can predict the possibility of an NPVr ≥90%, as a measure of clinical treatment success, in MRI-guided HIFU treatment of adenomyosis and suggest a cut-off value based on the Youden index () [Citation23].
In the present study, the incidence of mainly SIR class A (no medical intervention required) or class B (require nominal therapy but show no clinical consequence) HIFU-related AEs or complications during HIFU treatment in both groups A and B () was consistent with the findings reported in previous studies [Citation5,Citation9,Citation11,Citation16,Citation17]. The encountered AEs were mainly related to either the temperature increase in the near-field of the acoustic beam path due to the increase in deposited energy or far-field heat absorption by distant bony structures. They typically occurred during treatment and recovered shortly thereafter. There were no significant intergroup differences in the incidences of each type of complication (p > .05).
One of the major concerns regarding HIFU ablation of adenomyosis with an immediate NPVr ≥90% is the possibility of a negative impact on the ovarian reserve. Despite this potential concern, we found that there was no statistically significant change in AMH concentrations before and 6 months after HIFU treatment in (i) patients in group A; (ii) patients in group B; (iii) patients in all subgroups; (iv) between patients with focal adenomyosis and those with diffuse adenomyosis in group A; and (v) between patients with focal adenomyosis and those with diffuse adenomyosis in group B. These findings suggest that HIFU ablation even with an NPVr ≥90% did not damage the ovary and its blood flow, which is in agreement with the findings of previous studies [Citation36,Citation37].
With regard to clinical efficacy, our study demonstrated that the adenomyosis volume reduction and improvement in symptoms were significantly greater in group A than in group B (). These findings are in agreement with those of earlier studies [Citation5,Citation9,Citation11,Citation17]. In the subgroup analysis of patients with NPVr <90% (n = 40), the adenomyosis volume reduction and improvement in symptoms were significantly different not only between subgroup I (n = 13) and subgroup III (n = 18, p < .001) but also between subgroup II (n = 9) and subgroup III (n = 18, p < .001). However, there was no statistically significant difference between subgroup I (n = 13) and subgroup II (n = 9, p > .05), indicating that patients with an NPVr <70% are less likely to benefit from HIFU treatment. Based on our findings in this study, even though patients with an NPVr ≥70% and <90% would more likely benefit from this treatment, adenomyosis volume reduction and symptom improvement were significantly higher in patients with an NPVr ≥90% than in subgroup III of group B (p < .001). This was in agreement with the previously reported outcomes of HIFU treatment for adenomyosis [Citation6,Citation7,Citation10,Citation17].
The primary limitation of this study was its single-center retrospective nature and the 6-month follow-up period because of the follow-up protocol in our institution. Another drawback was the considerable overlap in the patient population (i.e., 31 of 66), which reported in this and one of our previous studies [Citation17]. However, the aim of our previous study [Citation17] was to evaluate the role of MR T1 perfusion-based time–SI curves of adenomyosis and the myometrium in classification of adenomyosis for predicting treatment outcomes of HIFU treatment, defined by the immediate NPVr, whereas, in this study, we investigated the MRI features influencing an immediate NPVr ≥90% after HIFU ablation of adenomyosis. Thus, it is not likely that a considerable overlap in the patient population affected our results. Furthermore, a recent retrospective study [Citation38] demonstrated that the achievement of NPVr ≥90% in MRI-guided HIFU treatment of uterine fibroids using multivariate analyses and GEE prediction model. Despite the similar study design and prediction model between our previous [Citation38] and present studies, it is worth to note that uterine fibroids and adenomyosis, two common gynecological benign tumours, have different histopathologic characteristics that generate different baseline, cellular and vascular features. In addition, in contrast with previous study [Citation38], the present study assessed quantitative perfusion MRI features for investigating the potential predictors of the NPV ratio of at least 90%. Lastly, prospective studies with larger patient populations and longer follow-up periods are essential to confirm the validity of (i) the MRI features influencing an NPVr ≥90% in HIFU ablation of adenomyosis, (ii) the prediction model introduced in this retrospective study, and (iii) the safety and clinical efficacy of this approach.
Conclusions
The preliminary findings of this retrospective study indicate that gynaecologists and interventional radiologists should evaluate the significant MRI features we have identified for achieving an NPVr ≥90% in HIFU treatment of adenomyosis and consider using the prediction model introduced in this study. Moreover, the findings for clinical efficacy at the 6-month follow-up examination demonstrated that an NPVr ≥90% produced better prognosis without SAEs in patients with adenomyosis and had a negligible impact on the ovarian reserve.
Ethics approval and consent to participate
The relevant institutional review board (IRB) approved this study on 22 May 2015 and written informed consent was obtained from each patient prior to initiation of high intensity focussed ultrasound-related procedures.
Availability of data and materials
The datasets used and/or analyzed during the current study are not publicly available due the terms of consent to which the participants agreed but are available from the corresponding author on reasonable request.
Disclosure statement
No potential conflict of interest was reported by the authors.
References
- Bergholt T, Eriksen L, Berendt N, et al. Prevalence and risk factors of adenomyosis at hysterectomy. Hum Reprod. 2001;16:2418–2421.
- Kepkep K, Tuncay YA, Goynumer G, et al. Transvaginal sonography in the diagnosis of adenomyosis: which findings are most accurate? Ultrasound Obstet Gynecol. 2007;30:341–345.
- Fedele L, Bianchi S, Dorta M, et al. Transvaginal ultrasonography in the diagnosis of diffuse adenomyosis. Fertil Steril. 1992;58:94–97.
- Atzori E, Tronci C, Sionis L. Transvaginal ultrasound in the diagnosis of diffuse adenomyosis. Gynecol Obstet Invest. 1996;42:39–41.
- Fukunishi H, Funaki K, Sawada K, et al. Early results of magnetic resonance guided focused ultrasound surgery of adenomyosis: analysis of 20 cases. J Minim Invasive Gynecol. 2008;15:571–579.
- Wang W, Wang Y, Tang J. Safety and efficacy of high intensity focused ultrasound ablation therapy for adenomyosis. Acad Radiol. 2009;16:1416–1423.
- Zhou M, Chen JY, Tang LD, et al. Ultrasound-guided high-intensity focused ultrasound ablation for adenomyosis: the clinical experience of a single center. Fertil Steril. 2011;95:900–905.
- Kim KA, Yoon SW, Lee C, et al. Short-term results of magnetic resonance imaging-guided focused ultrasound surgery for patients with adenomyosis: symptomatic relief and pain reduction. Fertil Steril. 2011;95:1152–1155.
- Fan TY, Zhang L, Chen W, et al. Feasibility of MRI-guided high intensity focused ultrasound treatment for adenomyosis. Eur J Radiol. 2012;81:3624–3630.
- Zhang X, Li K, Xie B, et al. Effective ablation therapy of adenomyosis with ultrasound-guided high-intensity focused ultrasound. Int J Gynaecol Obstet. 2014;124:207–211.
- Lee JS, Hong GY, Park BJ, et al. Ultrasound-guided high-intensity focused ultrasound treatment for uterine fibroid and adenomyosis: a single center experience from the Republic of Korea. Ultrason Sonochem. 2015;27:682–687.
- Shui L, Mao S, Wu Q, et al. High-intensity focused ultrasound (HIFU) for adenomyosis: two-year follow-up results. Ultrason Sonochem. 2015;27:677–681.
- Liu X, Wang W, Wang Y, et al. Clinical predictors of long-term success in ultrasound guided high-intensity focused ultrasound ablation treatment for adenomyosis: a retrospective study. Medicine. 2016;95:e2443.
- Gong C, Yang B, Shi Y, et al. Factors influencing the ablative efficiency of high intensity focused ultrasound (HIFU) treatment for adenomyosis: a retrospective study. Int J Hyperthermia. 2016;32:496–503.
- Ferrari F, Arrigoni F, Miccoli A, et al. Effectiveness of Magnetic Resonance-guided Focused Ultrasound Surgery (MRgFUS) in the uterine adenomyosis treatment: technical approach and MRI evaluation. Radiol Med. 2016;121:153–161.
- Gong C, Setzen R, Liu Z, et al. High intensity focused ultrasound treatment of adenomyosis: the relationship between the features of magnetic resonance imaging on T2 weighted images and the therapeutic efficacy. Eur J Radiol. 2017;89:117–122.
- Keserci B, Duc NM. The role of T1 perfusion-based classification in predicting the outcome of magnetic resonance-guided high-intensity focused ultrasound treatment of adenomyosis. Int J Hyperthermia. 2018;34:306–314.
- FDA approves label change for non-invasive fibroid treatment. April 7, 2009. InSightec Ltd. Available at: https://www.insightec.com/us/news-events/press-releases/fda-approves-label-change-for-non-invasive-fibroid-treatment. [Cited 21 June, 2018].
- Sacks D, McClenny TE, Cardella JF, et al. Society of interventional radiology clinical practice guidelines. J Vasc Interv Radiol. 2003;14:S199–S202.
- Practice Committee of the American Society for Reproductive Medicine. Testing and interpreting measures of ovarian reserve: a committee opinion. Fertil Steril. 2015;103:e9–17.
- Spies JB, Coyne K, Guaou N, et al. The UFS-QOL, a new disease-specific symptom and health-related quality of life questionnaire for leiomyomata. Obstet Gynecol. 2002;99:290–300.
- Bewick V, Cheek L, Ball J. Statistics review 14: logistic regression. Crit Care. 2005; 9:112–118.
- Youden WJ. Index for rating diagnostic tests. Cancer. 1950;3:32–35.
- O’Brien RM. A Caution regarding rules of thumb for variance inflation factors. Qual Quant. 2007;41:673–690.
- Kwack JY, Kwon YS. Laparoscopic surgery for focal adenomyosis. JSLS. 2017;21:e2017.00014.
- Huang X, Huang Q, Chen S, et al. Efficacy of laparoscopic adenomyomectomy using double-flap method for diffuse uterine adenomyosis. BMC Womens Health. 2015;15:24.
- Mikami K, Murakami T, Okada A, et al. Magnetic resonance imaging-guided focused ultrasound ablation of uterine fibroids: early clinical experience. Radiat Med. 2008;26:198–205.
- Chen L, ter Haar G, Hill CR. Influence of ablated tissue on the formation of high-intensity focused ultrasound lesions. Ultrasound Med Biol. 1997;23:921–931.
- Ascher SM, Arnold LL, Patt RH, et al. Adenomyosis: prospective comparison of MR imaging and transvaginal sonography. Radiol. 1994;190:803–806.
- Kim MD, Kim YM, Kim HC, et al. Uterine artery embolization for symptomatic adenomyosis: a new technical development of the 1-2-3 protocol and predictive factors of MR imaging affecting outcomes. J Vasc Interv Radiol. 2011;22:497–502.
- Kim YS, Lim HK, Kim JH, et al. Dynamic contrast-enhanced magnetic resonance Imaging predicts immediate therapeutic response of magnetic resonance-guided high-intensity focused ultrasound ablation of symptomatic uterine fibroids. Invest Radiol. 2011;46:639–647.
- Zhao WP, Chen JY, Chen WZ. Effect of biological characteristics of different types of uterine fibroids, as assessed with T2-weighted magnetic resonance imaging, on ultrasound-guided high intensity focused ultrasound ablation. Ultrasound Med Biol. 2015;41:423–431.
- Keserci B, Duc NM. The role of T1 perfusion-based classification in magnetic resonance-guided high-intensity focused ultrasound ablation of uterine fibroids. Eur Radiol. 2017;27:5299–5308.
- Pennes HH. Analysis of tissue and arterial blood temperatures in the resting human forearm. J Appl Physiol. 1948;1:93–122.
- Kim YS, Lim HK, Park MJ, et al. Screening magnetic resonance imaging–based prediction model for assessing immediate therapeutic response to magnetic resonance imaging–guided high-intensity focused ultrasound ablation of uterine fibroids. Invest Radiol. 2016;51:15–24.
- Cheung VY, Lam TP, Jenkins CR, et al. Ovarian reserve after ultrasound-guided high-intensity focused ultrasound for uterine fibroids: preliminary experience. J Obstet Gynaecol Can. 2016;38:357–361.
- Lee JS, Hong GY, Lee KH, et al. Changes in anti-müllerian hormone levels as a biomarker for ovarian reserve after ultrasound-guided high-intensity focused ultrasound treatment of adenomyosis and uterine fibroid. BJOG: Int J Obstet Gy. 2017;124:18–22.
- Keserci B, Duc NM. Magnetic resonance imaging parameters in predicting the treatment outcome of high-intensity focused ultrasound ablation of uterine fibroids with an immediate nonperfused volume ratio of at least 90%. Acad Radiol. 2018; DOI: 10.1016/j.acra.2018.01.022.