
Abstract
Aim: Exercise modulates glucose tolerance and homeostasis in both healthy and diabetic individuals. Heat stress is a fundamental element of exercise. The acute glycemic response and alterations in glucose clearance following whole body passive heat stress in the absence of muscle activity has yet to be examined in humans. Knowledge of this relationship may prove useful, particularly in populations with compromised glucoregulation from reduced activity.
Purpose: To determine insulin/glucose levels before and after an acute bout of heat stress in healthy, lean individuals and examine the effects of whole body heat stress (WBHS) and exercise on acute glucose tolerance in an expanded cohort.
Methods: Ten subjects (24.1 ± 0.7 years) participated in a randomized control/WBHS session (up to 30 minutes at 73 °C) with fasting glucose (FG) and insulin drawn at baseline, immediately after and 30 minutes post heat stress. In the follow-up experiment, 20 anthropometrically diverse subjects (24.6 ± 2.1 years) underwent an oral glucose tolerance test (OGTT) under the conditions above.
Results: FG levels rose 10% immediately following heat stress (8.6 (±5.6) mg/dl, p < .01) and returned to near baseline levels 30 minutes following WBHS. Insulin release showed its greatest increase at 30 minutes post WBHS (2.7 ± 3.5) uU/ml p < .05). WBHS resulted in a decrease in glucose uptake [AUC increased 8.2% (1430.6 ± 1957.03) mg/dl (p = .005)], particularly in nonlean individuals.
Conclusion: WBHS modulates physiologic markers of metabolism. An acute bout of WBHS increases glucose and insulin levels in healthy individual and decreases glucose uptake in response to a glucose challenge, particularly those who are non-lean.
Introduction
Metabolic inflexibility, defined as an impaired ability to regulate glucose/insulin levels throughout the day, is reaching epidemic levels. Metabolic inflexibility is associated with chronic inflammation, obesity, and insulin resistance [Citation1–3]. An important goal of a healthy lifestyle is to regulate glucose/insulin peaks and valleys that occur throughout the day. Exercise is a time honored method that is effective at regulating metabolic dysfunction. However, adherence to physical activity programmes is poor [Citation4] despite evidence that regular exercise may, at times, be successful at managing early phases of diabetes [Citation5,Citation6]. Importantly, some individuals that have poor adherence to exercise are unable to exercise because of an impaired neuro-musculoskeletal system [Citation7,Citation8].
The underlying mechanisms that regulate glucose and insulin are well studied [Citation1,Citation9–11]. Regular controlled stress (physical activity) challenges the autonomic nervous system, causing adaptations that are thought to trigger some of the benefits of exercise [Citation12,Citation13]. A bout of exercise is associated with increased heart rate, increased core body temperature, and increased sweat production from increased autonomic activity. The balance between the parasympathetic and sympathetic divisions of the autonomic nervous system tightly influences blood flow of actively contracting skeletal muscle [Citation14]. Skeletal muscle energy sources are increased by sympathetically driven gluconeogenesis along with improved insulin sensitivity for glucose uptake. A single bout of exercise has been shown to regulate blood glucose during physical activity for up to 1 hour after activity [Citation15]; causing a lasting improvement in glucose homeostasis for long periods [Citation10,Citation16]. The daily additive effect of each bout of exercise is postulated to trigger the long-term improvement in glycemic regulation associated with regular physical activity [Citation16–18].
Increased heart rate, increased core body temperature, and increased sweat production are physiological responses that are not unique to exercise. Heat exposure triggers autonomic nervous system activity, increased core body temperature, and increased sweat production [Citation19]. Importantly, several blood biomarkers including epinephrine, norepinephrine, prolactin, and extra-cellular heat shock proteins are elevated during whole body heat stress [Citation19]; similar to that observed during physical exercise. Based on the aforementioned findings, we pondered whether exposure to an environmental stressor that creates a similar sympathetic response to exercise, like heat stress, also influences metabolic regulation of glucose and insulin in humans.
The key difference between exercise and heat stress is that the systemic stress response is induced in the absence of skeletal muscle contraction. The extreme peripheral vasodilation to the skin during heat stress serves to increase peripheral blood volume necessitating an increased heart rate to sustain cardiac output. Under extreme heat stress conditions, or in people with known heart disease, heat stress drives the left ventricle without the benefit of the stretch induced influence of blood venous return. While the risks associated with heat stress combined with or without exercise are well documented [Citation20–23], there is a knowledge gap regarding the influence of acute heat stress on glucose and insulin blood metabolic markers.
Recent basic science research highlights the possible influence of passive heat stress on metabolism. Specifically, a whole body heat stress ‘treatment’ improved glucose tolerance and insulin stimulated glucose uptake in high-fat fed insulin resistant rats [Citation24]. Cellular stress responses and hyperthermia, associated with induction of a brief heat shock, also has been purported to improve the metabolic state of whole animals [Citation25]. We are not aware of any studies that have examined the extent to which passive whole body heat stress regulates glucose responses in humans; nor has any previous report put forth an implementation strategy to deliver heat stress in a controlled experimental environment in humans. Interestingly, a recent retrospective epidemiologic study supported that people who received regular passive heat stress had a decreased mortality risk for heart disease [Citation26].
The aims of this study are twofold: (1) to determine if acute heat stress regulates fasting glucose (FG) and insulin levels in healthy individuals, and, (2) to compare the effects of acute heat stress on glucose tolerance in healthy lean and nonlean people. A secondary aim was to explore if a comparable heartrate stress, induced by exercise, produces a glucose/insulin response that is similar to that induced by heat. We hypothesise that whole body heat stress will increase glucose levels with the response being greatest in nonlean individuals in direct response to sympathetic drive. We also expect that glucose response/uptake will be scaled according to body type (lean versus nonlean). Finally, we expect that heat and exercise will show distinct effects on glucose and insulin, despite similar levels of heart rate elevation.
Methods
Subjects
A total of 30 subjects were recruited (15 males, 15 females; ). In experiment 1, we studied 10 lean subjects (body mass index <24.3). In experiment two, we recruited lean (n = 10; 6 female) and non-lean (n = 10; 4 female) subjects. Subjects were young adults with varying levels of activity [Citation27] and health [Citation28]). Subjects with neurological and musculoskeletal diseases, injury or prior history of repeated exposure to heat stress were excluded. Prior to participation in each session, we asked subjects to refrain from exhaustive exercise and caffeine intake for 24 h. Each subject maintained a similar activity level and caloric intake prior to each session. All females were questioned as to their menstrual cycle and were eliminated if they were within the time of ovulation. The study was approved by the institution review board at the University of Iowa and all subjects gave written informed consent.
Table 1. Subject characteristics.
Instrumentation
Heat stress chamber
We used a custom designed heat stress chamber that was specially developed and instrumented so that heart rate and temperature could be sampled via an access port. A heater under feedback control from sensors maintained the temperature to within 0.5 C at the head level. We used a temperature of 73 °C for heat sessions and 26 °C for nonheat sessions. Chamber humidity was monitored and maintained at 10% relative humidity. Subjects sat upright with feet supported in the same position in the chamber for both the heat and nonheat sessions. During the sessions, subjects were able to speak freely, although conversations were kept to a minimum.
Experimental protocol
General testing procedures
In both experiments, each subject participated in two sessions, in random order, consisting of a heat stress session and a nonheat stress control session. Each session began following an 8-h overnight fast and was separated by a minimum of 48 h. The only difference between the heat and nonheat session was the temperature of the chamber. The precise dose of heat stress was developed based on preliminary experiments wherein we verified a change in heart rate up to 60% of age predicted maximal in young healthy individuals [Citation19,Citation29].
At each session, each subject underwent anthropometric measurements including weight, height, body mass index, waist to hip ratio, visceral adipose tissue measurement (VAT via abdominal ultrasound, GE LOGIQ e, Fairfield, CT), and percent body fat using bioimpedance (Tanita, TBF-300A, Arlington Heights, IL). We had a subset of 10 subjects return for a third control session where rather than sit in the no heat chamber, they performed low level stationary biking at a workload that matched their heart rate from the heat stress condition. By having a repeated control condition, we could establish if the degree of heart rate elevation alone was contributing to any changes in glucose tolerance.
Temperature, heart rate, and thermal comfort
Heart rate was measured using beat by beat recording with a chest strap (Polar Electro Inc, Kempele, Finland) and wireless online recorder (MSR Electronics GmbH, Henggart, Switzerland). Tympanic temperature (Welch Allyn, Braun Thermoscan, Skaneateles Falls, NY) was monitored and recorded prior to entering the chamber and every 5 min throughout heat stress. Thermal tolerance was assessed using a thermo-sensation scale [Citation30] which ranged from 1 (so cold I am helpless) to 13 (so hot I am sick and nauseated). Subjects verbalised a subjective whole number rating before entering the chamber, at entry into the chamber and every 5 min after they entered the chamber.
Blood sample
We collected venous blood samples from seated subjects from the forearm in 6 ml tubes containing ethylenediaminetetraacetic acid at three different intervals. Participants had draws prior to, immediately following and 30 min following exposure to whole body heat stress. Subjects were assessed in seated position during blood draws and heat stress in order to minimise postural influence [Citation31,Citation32]. We measured packed cell volume, fasting plasma glucose, and fasting total insulin. Packed cell volume was assessed in order to determine plasma volume changes in response to heat stress and ensure changes in glucose and insulin were not the result of a change in plasma volume.
Blood samples were immediately centrifuged at 3000 RPM for 6 min within 11–25 °C.Plasma glucose was measured using hexokinase method (Roche COBAS Integra 300 analyser with Glucose HK Gen 3 reagent). Plasma insulin was assessed with chemiluminescent immunometric assay (Immulite 2000, Imtermedico).
In the follow-up study, baseline fasting blood glucose was assessed prior to the start of the session using finger prick method to test capillary glucose levels (Contour® USB Blood Glucose Monitoring System, Bayer HealthCare, Tarrytown, NY). For heat, nonheat, and exercise-matched sessions, we performed an oral glucose tolerance test using standard 75 g/10 ounce dextrose solution (Trutol, Thermo Scientific Inc., Waltham, MA). Capillary samples were collected at 7 consistent intervals; preintervention, postintervention, post glucose load, 30, 60, 90, and 120 min post glucose solution load.
Experimental protocol
Upon arrival in the laboratory, subjects were weighed without clothing and then changed into swimsuits. In experiment 1, baseline blood samples for FG and insulin were taken prior to entering the heat stress chamber. While in the chamber, heart rate, tympanic temperature, thermal comfort was assessed every 5 min for a maximum of 30 min. After the final measurement, subjects exited the chamber and towelled off, removed suits and weighed again. Blood samples were acquired immediately after weighing and at 30 min following heat stress. Heart rate, blood pressure and tympanic temperature were also recorded for 30 min following whole body heat stress. Participants drank enough to return to pre heat stress body weight prior to blood draw.
In experiment two, capillary finger prick samples were taken prior to entering the whole body heat stress chamber. Heart rate, tympanic temperature and thermal comfort were assessed as in the first study while the subject was in the chamber. In this study, the subject consumed 2 ounces of water in the chamber during the final 5 minutes to begin rehydration. Sweat loss was calculated by reweighing subjects following heat stress. Participants drank enough water to return pre-heat stress body weight prior to further blood sampling and oral glucose load. Capillary samples were acquired at the following points: immediately after weighing, post consumption of oral glucose load, 30, 60, 90, and 120 min following glucose load.
A subset of nine subjects returned on a separate day for a follow-up assessment to serve as an ‘active’ control group. Specifically they did not undergo heat stress, but did have an oral glucose tolerance test following a session of low work load cycling for the same amount of time a heart rate that matched their previous heart rate that was induced with heat stress only. Capillary samples were acquired as per the prior two sessions following glucose load.
Data reduction and statistical analysis
Descriptive analysis (mean ± standard deviation) was performed for subject age, height, weight, body mass index, body fat percentage, waist circumference, waist hip ratio, and visceral abdominal tissue thickness in both experiments one and two. In experiment two, subjects were subdivided into two age and height matched groups, identified as ‘lean’ and ‘nonlean’ according to anthropometric variables. Non-lean subjects in experiment two met two of three standard obesity criteria including the following: body fat (males >25%, females >30%), body mass index >30 and waist circumference (males >102 cm, females >88 cm). The subset of individuals who returned for the active control session consisted of four lean and five non lean subjects. Glucose area under the curve (AUC) was calculated from the capillary blood glucose levels using the trapezoid method [Citation33,Citation34].
Statistical analysis was conducted using Sigma Plot 11.0 (San Jose, CA). Results are represented as means (±SD). Comparative analysis between the conditions and time was performed using repeated measures analysis of variance (with Holm-Sidak post hoc test). Overall significance was p < .05. Pearson product moment correlation was used to explore predictive relationships with serum factors or glucose load response.
Results
A total of 30 subjects completed the study. All subjects were similar between experiments one and two with the exception of the ten non-lean participants in experiment two ().
Experiment 1
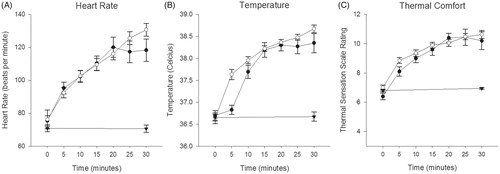
The goal of experiment 1 was to determine if WBHS modulates FG and insulin in healthy people. Participant’s thermosensitivity, [tympanic] temperature, and heart rate responses to whole body heat stress are reported collectively in . There was no difference in responses between participants in studies 1 and 2.
Figure 1. Heart rate (A), tympanic temperature (B) and thermal comfort (C) responses to heat (
 Experiment 2) and control session (
 ).
).
Dehydration reduced body mass by 0.34 (±0.13) kg (p < .01) in study one and by 0.46 (±0.22) kg (p < .01) in study two. While fluid loss was significant immediately post heat (p < .01), total loss was less than 0.51(± 0.20)% and 0.56 (±0.23)% in experiments 1 and 2, respectively, which is well below the established biochemical pertubation functional threshold of ≥2% body mass [Citation35]. Subject rehydration in the final five minutes and following heat stress normalized fluid homeostasis at 30 min.
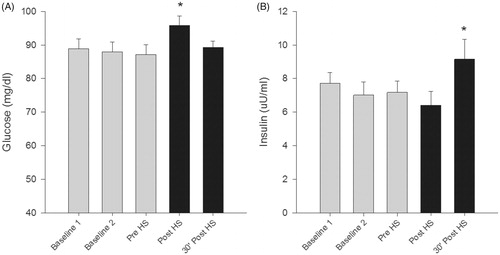
Fasting plasma glucose increased 10.15% (± 7.13) which corresponds to 8.60 (±5.58) mg/dL (p < .01) following exposure to whole body heat stress (). Within 30 min following WBHS, glucose levels dropped to near baseline levels. Insulin response was delayed until 30 min following whole body heat stress, increasing 70.4% (± 140.4) from post heat stress which corresponds to a 2.74 ((±3.55) uU/ml (p = .03) increase ().
Figure 2. Fasting Plasma Glucose and Fasting Insulin values in response to control and heat stress sessions. Glucose (A) levels rose immediately following heat stress while insulin (B) response was delayed following heat stress. (*p < .05)
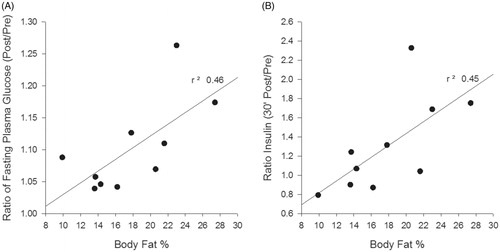
Body fat percentage, as an objective index of leanness, was associated with the glycemic response following WBHS. The R2 values equalled 0.45 () and 0.46 () immediately and 30 min post WBHS, respectively ().
Figure 3. Body fat percentage modulates normalised glucose (A) and insulin (B) ratios.
Experiment 2
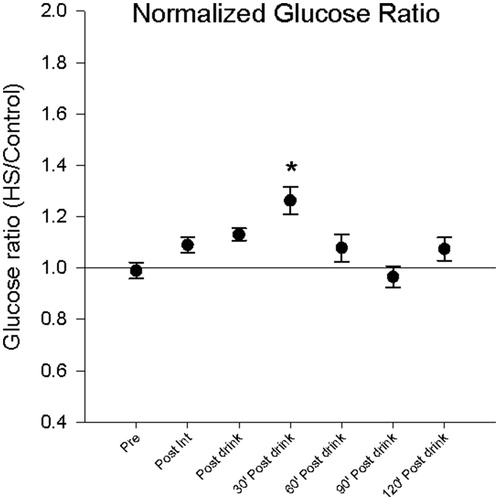
The purpose of experiment 2 was to determine how lean and nonlean people respond to a glucose challenge before and after WBHS. Acute capillary glucose levels were influenced by exposure to WBHS. Capillary glucose levels increased after consumption of glucose load and 30 min after load by 13.07% (±10.76) which corresponds to 11.4 (± 9.56) mg/dl (p < .01) and 26.27% (± 24.13) which corresponds to 31.60 (±24.12) mg/dl (p < .01), respectively (). Normalized glucose levels at 30 min were higher following heat stress (). The total area under the curve was increased by 8.18% (±10.4) which corresponds to a 1430.6 (± 1957.03) mg/dl (p = .005) increase after heat stress as compared to the control session.
Figure 4. Acute responses to glucose load with oral glucose tolerance test in experiment 2. Glucose levels rose 30 min following a bout of heat stress compared to control sessions (A). Inset area under the curve (A) for oral glucose tolerance test in experiment 2 (*p < .05). Lean individuals (B) have a blunted response following a bolus of glucose than age matched non-lean individuals (C). No difference exists between control and exercise sessions (D). Heat stress does modulate this response in both lean and nonlean individuals.
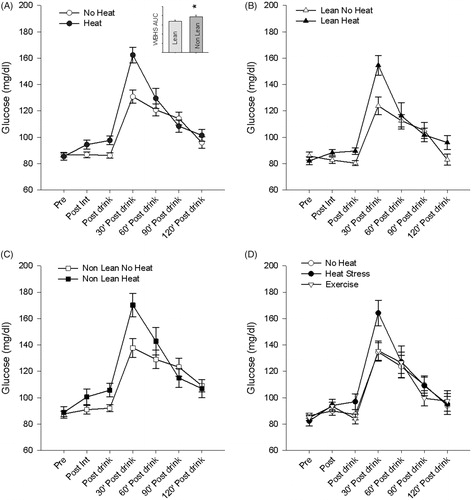
Figure 5. Normalized glycemic response (heat stress/control ratio) indicates heat stress does modulate glucose metabolism. Capillary glucose levels were greatest thirty minutes following glucose load (*p < .001) than all conditions except for post glucose load.
We found main effects for groups and session when comparing the area under the curve (p = .008 and p = .006, respectively), but no significant interaction (p = .98). Specifically, non lean individuals had a significantly higher AUC than lean individuals both in the control and heat stress sessions (p < .01 control and p = .03 heat stress) ().
We had nine subjects return and received a similar HR stress, using exercise (bike ergometer), as compared to their individualised heat stress HR session. There were no differences in the AUC for this exercise group as compared to the non-heat control session group, but distinct differences when compared with the heat stress group (p = .008) (). This finding may support a different mechanism leading to glucose response in the nonexercise group.
Discussion
The major findings of this study are: (1) whole body heat exposure acts as a physiological stressor which influences glucoregulation; (2) an acute bout of heat stress increased glucose and insulin levels in healthy people; (3) an acute bout of heat stress decreased glucose uptake in response to a glucose challenge, to a greater extent in people who are nonlean; (4) an acute bout of exercise that induced a similar increase in HR, did not trigger the same response to the glucose challenge as that induced by heat stress. Taken together, these findings suggest that heat stress offers a unique stressor unlike exercise but with some shared physiological responses.
It is well known that exercise induces widespread systemic physiological adaptations including improvements in glucoregulation and insulin sensitivity [Citation36]. Our prior research has validated that induction of the heat stress response, via an identical 30 min of exposure to WBHS, elicits some alterations similarly seen in exercise; specifically elevated core temperature, increased heart rate, HSP72 release, and increases in norepinephrine and prolactin [Citation19]. The underlying similarity between exercise and whole body heat stress is the increase in core temperature and sweat production. What remains unknown is what, if any, glycemic changes occur with induction of a stress response in the absence of skeletal muscle contraction.
In our study, whole body heat stress significantly increased plasma glucose immediately following the intervention and returned to near baseline within 30 min. In the absence of muscle contraction, the specific mechanism by which this may be explained remains unclear. Hepatic gluconeogenesis may drive fasting plasma glucose elevation in response to heat stress. In animal models, rapid depletion of hepatic glycogen content in response to heat stress was identified as a source for peripheral glucose increase [Citation37]. In our study, it remains unclear what occurs with liver glycogen content following exposure of an acute bout of heat stress. Regardless of the mechanism, endogenous glucose production seen with heat stress is likely controlled by neural and endocrine responses, quite similar to that seen in exercise [Citation38]. This insulin-independent glucose modulation and subsequent uptake may also be driven by the stress response, including changes in norepinephrine and other stress hormones. We recently reported clear modulation of these stress hormones using the identical heat dose that was used in this study [Citation19].
The hormonal response to elevated glucose is seen in the homeostatic changes in fasting plasma insulin immediately after heat stress and at 30 min following heat stress. Our findings parallels that seen by others studying the effects of stressors such as exercise on glycemic parameters in diabetic persons [Citation39]. Improved insulin sensitivity and binding at the cellular level induces further glucose uptake to maintain homeostasis in a ‘rebound’-type response. Expansion of this study to examine the effects of heat stress on 24–48 h glucose homeostasis may further elucidate the value of heat on glucoregulation. Acute and chronic exposure to exercise is known to activate certain metabolic challenge acutely that, when properly adhered to regularly, triggers adaptive responses increasing sensitivity to exercise [Citation40].
Studies using animal models have examined glycemic responses to heat stress. Metabolic adaptations associated with induction of heat stress in mice exposed to whole body heat (infrared room) showed positive metabolic responses with regards to glucoregulation and insulin sensitivity with chronic exposure [Citation41,Citation42]. In as little as two weeks of exposure (6–30 min sessions), significant decreases in fasting plasma glucose in diabetic mice was found with whole body heat stress [Citation42]. A limitation of our work is that we do not know if FG levels were changeds 24–48 h after the heat stress. However, most studies suggest that a chronic training intervention would be necessary to detect any long term adaptations.
The ability to predict one’s response to a dose of heat stress holds value, particularly in those who are considered metabolically inflexible. Induction of glucose modulation in the absence of physical activity may hold promise or compromise for individuals who are physically unable to exercise. While individuals with a lack of movement due to morbid obesity or an injury may benefit from alternative stressors to initiate or progress desired physiological adaptations, caution may be in order as this stressor could push them ‘over the brink’ and cause an acute episode of deleteriously high glucose levels. Building a progression of appropriately dosed heat stress along with the advancement of physical activity as tolerated may prove useful for improving wellness in an otherwise unhealthy population. In our study, body fat percentage in active young individuals was a moderate predictor of both the glucose and insulin response following a dose of whole body heat stress. In our expanded cohort, individuals classified as nonlean demonstrated greater glycemic uptake resistance in response to a bolus of sugar following heat stress. Glycemic response was found to moderately correlate with body mass index in subjects classified as nonlean.
While these findings hold value in expanding the breadth of knowledge for safe and appropriate dosing of heat stress they are not without limitations. We did assess an anthropometrically diverse population in our expanded cohort but did not explore a variety of ages or those with known metabolic instability, hence, our findings cannot be generealized to other populations. In addition, there is no consensus with regards to type of blood sampling for greatest accuracy and clinical relevance in glucose sampling [Citation43,Citation44]. Lastly, although our study was adequately powered (>0.80), our sample size limits the generalizability to the more variant population at large supporting the need for future large scale investigations. Despite these limitations, the significance of the research lays groundwork for further studies that gradually increase tolerance to heat stress in order to better understand the value, safety, and clinical relevance for people from divergent backgrounds and with/without pathology.
Conclusion
Whole body heat stress modulated both physiological and glycemic responses in anthropometrically diverse individuals. Glucose and insulin increased in response to a 30 min dose of whole body heat stress. This dose of heat, by virtue of the increase in heart rate and known changes in stress hormones, supports that the sympathetic–parasympathetic balance changes. The increased heart rate induced by heat was similar to that of a bout of moderate intensity exercise (61% of age predicted maximum heart rate), despite the fact that exercise, at this level, did not induce a corresponding increase in core body temperature. While the impact of whole body heat stress needs to be investigated further, facilitation of glucoregulatory mechanisms may prove beneficial in improving insulin sensitivity. It remains unclear what mechanisms are upregulated in response to heat stress at the cellular level and further research is warranted to investigate local changes. In addition, the effects of chronic training in whole body heat stress warrant further examination. While exercise remains the single most powerful stressor, it also remains underutilized as a powerful tool to modulate the progression of metabolic disease. Whole body heat stress may offer promise as an adjunct to exercise and rehabilitation by improving tolerance to physiological changes such as sweating and elevated core temperature in an effort to improve metabolic homeostasis.
Acknowledgments
We acknowledge Anna Towne DPT for assistance with this study.
Disclosure statement
No potential conflict of interest was reported by the authors.
Additional information
Funding
References
- Jorge ML, de Oliveira VN, Resende NM, et al. The effects of aerobic, resistance, and combined exercise on metabolic control, inflammatory markers, adipocytokines, and muscle insulin signaling in patients with type 2 diabetes mellitus. Metabolism. 2011;60:1244–1252.
- Kondo T, Koga S, Matsuyama R, et al. Heat shock response regulates insulin sensitivity and glucose homeostasis: pathophysiological impact and therapeutic potential. CDR. 2011;7:264–269.
- Metcalfe RS, Babraj JA, Fawkner SG, et al. Towards the minimal amount of exercise for improving metabolic health: beneficial effects of reduced-exertion high-intensity interval training. Eur J Appl Physiol. 2012;112:2767–2775.
- National Center for Health Statistics (US). Hyattsville (MD). 2014 May. Report No.:2014-1232.
- Smith LL, Burnet SP, McNeil JD. Musculoskeletal manifestations of diabetes mellitus. Br J Sports Med. 2003;37:30–35.
- Naci H, Ioannidis JP. Comparative effectiveness of exercise and drug interventions on mortality outcomes: metaepidemiological study. BMJ. 2013;347:f5577
- Duckworth WC, Jallepalli P, Solomon SS. Glucose intolerance in spinal cord injury. Arch Phys Med Rehabil. 1983;64:107–110.
- Dudley-Javoroski S, Shields RK. Muscle and bone plasticity after spinal cord injury: review of adaptations to disuse and to electrical muscle stimulation. J Rehabil Res Dev. 2008;45:283–296.
- Baynard T, Franklin RM, Goulopoulou S, et al. Effect of a single vs multiple bouts of exercise on glucose control in women with type 2 diabetes. Metab Clin Exp. 2005;54:989–994.
- Richter EA, Hargreaves M. Exercise, GLUT4, and skeletal muscle glucose uptake. Physiol Rev. 2013;93:993–1017.
- Norton L, Norton K, Lewis N. Exercise training improves fasting glucose control. Open Access J Sports Med. 2012;3:209–214.
- Joyner MJ, Green DJ. Exercise protects the cardiovascular system: effects beyond traditional risk factors. J Physiol. 2009;587:5551–5558.
- Fu Q, Levine BD. Exercise and the autonomic nervous system. Handb Clin Neurol. 2013;117:147–160.
- Buckwalter JB, Clifford PS. The paradox of sympathetic vasoconstriction in exercising skeletal muscle. Exerc Sport Sci Rev. 2001;29:159–163.
- Adams OP. The impact of brief high-intensity exercise on blood glucose levels. Diabetes Metab Syndr Obes. 2013;6:113–122.
- Goodyear LJ, Kahn BB. Exercise, glucose transport, and insulin sensitivity. Annu Rev Med. 1998;49:235–261.
- Terada T, Friesen A, Chahal BS, et al. Exploring the variability in acute glycemic responses to exercise in type 2 diabetes. J Diabetes Res. 2013;2013:591574.
- Duclos M, Virally ML, Dejager S. Exercise in the management of type 2 diabetes mellitus: what are the benefits and how does it work?. Phys Sportsmed. 2011;39:98–106.
- Iguchi M, Littmann AE, Chang SH, et al. Heat stress and cardiovascular, hormonal, and heat shock proteins in humans. J Athl Train. 2012;47:184–190.
- Kenney WL, Craighead DH, Alexander LM. Heat waves, aging, and human cardiovascular health. Med Sci Sports Exerc. 2014;46:1891–1899.
- Bouchama A, Knochel JP. Heat stroke. N Engl J Med. 2002;346:1978–1988.
- Cheung SS. Neuromuscular response to exercise heat stress. Med Sport Sci. 2008;53:39–60.
- Crandall CG, Gonzalez-Alonso J. Cardiovascular function in the heat-stressed human. Acta Physiol (Oxf)). 2010;199:407–423.
- Gupte AA, Bomhoff GL, Swerdlow RH, et al. Heat treatment improves glucose tolerance and prevents skeletal muscle insulin resistance in rats fed a high-fat diet. Diabetes. 2009;58:567–578.
- Hooper PL, Balogh G, Rivas E, et al. The importance of the cellular stress response in the pathogenesis and treatment of type 2 diabetes. Cell Stress Chaperones. 2014;19:447–464.
- Laukkanen T, Khan H, Zaccardi F, et al. Association between sauna bathing and fatal cardiovascular and all-cause mortality events. JAMA Intern Med. 2015;175:542–548.
- Baecke JA, Burema J, Frijters JE. A short questionnaire for the measurement of habitual physical activity in epidemiological studies. Am J Clin Nutr. 1982;36:936–942.
- McHorney CA, Ware JE, Jr, Raczek AE. The MOS 36-Item Short-Form Health Survey (SF-36): II. Psychometric and clinical tests of validity in measuring physical and mental health constructs. Med Care. 1993;31:247–263.
- Iguchi M, Shields RK. Prior heat stress effects fatigue recovery of the elbow flexor muscles. Muscle Nerve. 2011;44:115–125.
- Fiber Society Inc. Clothing comfort: interaction of thermal, ventilation, construction, and assessment factors. The Fiber Society, Inc. Comfort Symposium proceedings. 1977, Ann Arbor, MI: Ann Arbor Science Publishers. p. 189.
- Harrison MH. Effects on thermal stress and exercise on blood volume in humans. Physiol Rev. 1985;65:149–209.
- Ahlgrim C, Pottgiesser T, Robinson N, et al. Are 10 min of seating enough to guarantee stable haemoglobin and haematocrit readings for the athlete's biological passport?. Int J Lab Hematol. 2010;32:506–511.
- Allison DB, Paultre F, Maggio C, et al. The use of areas under curves in diabetes research. Diabetes Care. 1995;18:245–250.
- Tschritter O, Fritsche A, Shirkavand F, et al. Assessing the shape of the glucose curve during an oral glucose tolerance test. Diabetes Care. 2003;26:1026–1033.
- American College of Sports, Sawka MN, Burke LM, et al. American College of Sports Medicine position stand. Exercise and fluid replacement. Med Sci Sports Exerc. 2007;39:377–390.
- Wojtaszewski JF, Richter EA. Effects of acute exercise and training on insulin action and sensitivity: focus on molecular mechanisms in muscle. Essays Biochem. 2006;42:31–46.
- Miova B, Dinevska-Kjovkarovska S, Djimrevska A, et al. Prior heat stress induces moderation of diabetic alterations in glycogen metabolism of rats. Cent Eur J Biol. 2014;9:249.
- Camacho RC, Galassetti P, Davis SN, et al. Glucoregulation during and after exercise in health and insulin-dependent diabetes. Exerc Sport Sci Rev. 2005;33:17–23.
- Dela F, von Linstow ME, Mikines KJ, et al. Physical training may enhance beta-cell function in type 2 diabetes. Am J Physiol Endocrinol Metab. 2004;287:E1024–E1031.
- Beigi P, Rohling R, Salcudean SE, et al. Spectral analysis of the tremor motion for needle detection in curvilinear ultrasound via spatiotemporal linear sampling. Int J Cars. 2016;11:1183–1192.
- Gupte AA, Bomhoff GL, Touchberry CD, et al. Acute heat treatment improves insulin-stimulated glucose uptake in aged skeletal muscle. J Appl Physiol (1985). 2011;110:451–457.
- Kokura S, Adachi S, Manabe E, et al. Whole body hyperthermia improves obesity-induced insulin resistance in diabetic mice. Int J Hyperthermia. 2007;23:259–265.
- Tonyushkina K, Nichols JH. Glucose meters: a review of technical challenges to obtaining accurate results. J Diabetes Sci Technol. 2009;3:971–980.
- Colagiuri S, Sandbaek A, Carstensen B, et al. Comparability of venous and capillary glucose measurements in blood. Diabet Med. 2003;20:953–956.