
Abstract
Purpose: Modulated electro-hyperthermia (mEHT), known as oncothermia, is an anticancer therapy that induces radiofrequency thermal damage to the cancer tissues. This study aimed to evaluate the potential effectiveness of mEHT as a therapeutic tool in ovarian and cervical cancer.
Materials and methods: We used both tumor-bearing mice and ovarian and cervical OVCAR-3, SK-OV-3, HeLa and SNU-17 cancer cell lines to investigate the effects of mEHT in vivo and in vitro, respectively, and determine whether it was enhanced by cotreatment with an autophagy inhibitor.
Results: We discovered that phosphorylation of p38, a stress-dependent kinase, was induced at the Thr180/Tyr182 residue in cancer cells exposed to mEHT. Apoptotic markers such as cleaved caspase-3 and poly-ADP ribose polymerase (PARP) were increased in OVCAR-3 and SNU-17 cells. Fluorescence-activated cell sorting (FACS) analysis showed a significant increase in the population of sub-G1 mEHT-exposed cells, which are dying and apoptotic cells. mEHT also reduced both weight and volume of xenograft tumors in mice transplanted with ovarian and cervical cancer cells and patient-derived cancer tissues. We determined that mEHT-induced cellular damage recovery was mediated by autophagy and, therefore, expectedly, cotreatment with mEHT and 3-methyladenine (3-MA), an autophagy inhibitor, more effectively inhibited cancer cell growth than individual treatment did.
Conclusions: mEHT treatment alone was sufficient to inhibit cancer growth, while a combined treatment with mEHT and an autophagy inhibitor amplified this inhibition effect.
Introduction
Worldwide, 766,000 women were diagnosed with gynecologic cancer (ovarian, cervical, and uterine) [Citation1], and gynecological cancer have the fifth and sixth highest mortality rates of all cancers affecting women in the US [Citation2]. Although considerable efforts have been made to improve the 5-year survival rate of both ovarian and cervical cancer, the rates are still as low as ≤45% and approximately 30–60%, respectively [Citation3,Citation4]. One effort to improve the survival rate was reported by the Cancer Genome Atlas (TCGA), which has created a growing interest in targeted therapy [Citation5,Citation6]. To date, numerous targeted therapeutic drugs such as Olaparib have been approved by the US Food and Drug Administration (FDA) for clinical trials, but the results have not been as expected [Citation7–10].
Hyperthermia, also known as thermotherapy, refers to the method of treating cancer by raising the tumor temperature to up to 45 °C for a period [Citation11]. This is followed by the exposure to temperatures of ≤42 °C or below for a certain period, and under these conditions, cancer tissues with structurally abnormal blood vessels are unable to dissipate the heat rapidly. Consequently, heat is accumulated, leading to a rapid increase in temperatures in cancer tissue, which enhances their sensitivity to heat damage compared to normal tissues because of chronic hypoxia, acidosis, and energy deprivation [Citation11,Citation12]. Hyperthermia is used diversely depending on the energy source (microwave, radiofrequency and ultrasound) and characteristics of the cancer tissues [Citation11]. Previous clinical reports suggest that the use of hyperthermia as a combination treatment could enhance cancer tissue sensitivity to radiotherapy, chemotherapy, gene therapy, or immunotherapy [Citation11,Citation13,Citation14].
Modulated electro-hyperthermia (mEHT), known as oncothermia, refers to a loco-regional hyperthermic method using a specific radiofrequency (RF) that was used to treat tumors approximately 20 years ago [Citation15,Citation16]. The principle of mEHT for anticancer therapy is that it leads to the accumulation of heat-induced damage mostly in tumor cell membranes, especially the lipid rafts, at capacitive-coupled energy of 13.56 MHz radiofrequency [Citation15–17]. This targeted effect occurs because the electromagnetic properties of lipid rafts (electrical conductivity and permittivity) of cancer cells are different from those of surrounding normal tissue. Thus, the normal tissues are minimally damaged in the course of mEHT treatment [Citation15]. According to a comparative study of conventional hyperthermia (water bath or Thermotron RF-8) and mEHT (Lab-EHY-100) in the human lymphoma (U937) and hepatocarcinoma (HepG2) cell lines, the biological effect differed depending on the heating method, and mEHT induced stronger oxidative stress and apoptosis than that by other heating methods [Citation15,Citation17]. In addition, in vitro and in vivo experiments using colorectal HT29 cancer cells showed induction of caspase-independent apoptosis [Citation18]. In the CT-26 murine colon cancer model, heat shock protein 70 (HSP70) was released in the extracellular region after mEHT treatment, accompanied by immunological responses and eosinophil infiltration in the surrounding tumor regions [Citation19]. In glioma, mEHT increased E2F1-induced apoptosis, and reduced spheroid formation and migration ability [Citation20]. Studies have been conducted on the anticancer effects of mEHT and its molecular mechanism in various cancers; however, its effects on gynecological cancers are still unexplored.
Macroautophagy is the process of packaging the constituents of cells, breakdown of cellular components or recycling decomposition products [Citation21]. Macroautophagy is increased by various stresses, the most well known being nutrient deprivation [Citation22]. Hypoxia, infection, DNA damage, and hyperthermia are also known to enhance autophagy [Citation23–26]. Autophagy is generally considered to be an important mechanism for cellular protection against extra-stimuli [Citation22], but can be a pathogenic feature as dysregulated autophagy involved in cancer, cardiovascular disease, and autoimmune disease [Citation27–29]. In cells and tissues exposed to hyperthermia, a significant amount of misfolded proteins and aggregates accumulate in the cell [Citation23,Citation25], thereby promoting many cellular mechanisms, including cell death [Citation30]. Among them, macroautophagy is activated to decompose the misfolded proteins and aggregates through lysosome protease, thereby increasing cell survival [Citation26].
Therefore, this study evaluated the anticancer effect of mEHT in ovarian and cervical cancers and investigated whether cotreatment with an autophagy inhibitor enhances the effect of mEHT.
Material and methods
Cell culture and materials
OVCAR-3, SK-OV-3 and HeLa cell lines were purchased from American Type Culture Collection (ATCC, Manassas, VA, USA) and SNU-17 cells were obtained from Korean Cell Line Bank (KCLB). OVCAR-3 cells were maintained in Dulbecco’s modified Eagle’s medium (DMEM) supplemented with 10% fetal bovine serum (FBS) with antibiotics. SK-OV-3, while HeLa and SNU-17 cells were maintained in Roswell Park Memorial Institute (RPMI), supplemented with 10% FBS with antibiotics. Anti-HSP90 (sc-69703), anti-HSP70 (sc-24), anti-unc-51-like autophagy activating kinase 1 (Ulk-1, sc-33182), and anti-β-tubulin (sc-9104) antibodies were purchased from Santa Cruz Biotechnology (Santa Cruz, CA, USA). Anti-phospho-p38 (#4511), anti-p38 (#9212), anti-cleaved caspase-3 (#9664), anti-poly-ADP ribose polymerase (PARP, #9542), anti-Beclin-1 (#3495), and anti-light-chain 3 (LC3) A/B (#12741) antibodies were obtained from Cell Signaling Technology (Danvers, MA, USA). Lysotrack® Green DND-26 were purchased from Molecular Probes (Life Technologies, Eugene, OR, USA) while 3-methyladenine (3-MA) was purchased from Tocris Bioscience (Bristol, UK). The 5 and 20 mg/mL stock solutions for cultured cells and the in vivo mouse experiments, respectively, were dissolved in saline (0.9% sodium chloride [NaCl]).
Protein extraction and Western blotting
Total cell lysates were isolated using cell lysis buffer [150 mM NaCl, 50 mM Tris pH 7.4, 1% NP-40, and 1 mM each of ethylenediaminetetraacetic acid (EDTA), sodium orthovanadate, sodium fluoride (NaF), and sodium pyrophosphate] containing proteinase inhibitor cocktail (Roche, Nutley, NJ, USA). Cells were harvested on ice, lysed, the lysates were centrifuged at 13 000 rpm for 15 min, protein concentrations were determined using the bicinchoninic acid (BCA) assay (Sigma-Aldrich, St. Louis, MO, USA), and the samples were subsequently stored at −20 °C. For the western blot analysis, the proteins were separated using sodium dodecyl sulfate-polyacrylamide gel electrophoresis) (SDS-PAGE) and then transferred to 0.2 µm nitrocellulose membranes (Pall Corporation, Port Washington, NY, USA). The protein bands were visualized using a chemiluminescence detection kit (Santa Cruz Biotechnology, Santa Cruz, CA, USA) after binding with the horseradish peroxidase (HRP)-conjugated secondary antibody.
Cell viability measurement
Cancer cells were exposed to mEHT or general hyperthermia (at 43 °C for 1 h), detached using 0.25% trypsin-EDTA (HyCloneTM, Logan, UT, USA), and then they were seeded in a 24-well plate at a density of 4 × 10⁴ cells/well. After the indicated incubation times, cells were fixed using 10% acetic acid solution with 10% methanol and stained with 0.5% crystal violet for 1 h, photographed, and extracted using 1% SDS solution. The absorbance of the crystal violet cell extract was measured at 595 nm using the VERSA maxTM microplate reader (Molecular Devices, Sunnyvale, CA, USA). To count the cell number directly, cancer cells were seeded in a 24-well plate at a density of 4 × 10⁴ cells after mEHT or general hyperthermia and were cultured for 24 or 48 h. Subsequently, 10 μL of 100 μL resuspended cells was measured using the LUNAIITM automated cell counter (Logos Biosystems, Inc., Republic of Korea). All experiments were performed for eight times.
Fluorescence-activated cell sorting (FACS) analysis
Cancer cells were exposed mEHT or general hyperthermia (at 43 °C for 1 h), cultured for the indicated periods, total cells were harvested using trypsinization, collected by centrifugation, and then washed in PBS for propidium iodide (PI) staining. The cells were subsequently fixed with 70% ethanol and resuspended in PBS containing 50 µg/mL PI and 0.1 mg/mL RNase A. The fluorescence intensity was measured using the FACScan flow cytometer (BD Biosciences) at excitation and emission wavelengths of 488 and 620 nm, respectively. Samples were gated based on the forward versus side scatter of cell size or intracellular granularity, respectively, and the sub-G1 results are presented as the percentage of apoptotic cells.
mEHT treatment and in vivo xenograft mouse model
LabEHY-100 (Oncotherm GmbH, Troisdorf, Germany) for inducing hyperthermia in the in vivo and in vitro assays was provided by HOSPICARE, Co., Ltd., (Republic of Korea, Supplemental Figure S1A). The precision of the mEHT method used was based on the suggestions of previous studies [Citation15,Citation17]. For in vitro experiments, a LabEHY-100 device equipped with a special cuvette chamber applicator was used. Microscope cover glasses (24 × 32 mm, Paul Marienfeld GmbH, Germany) were coated with 0.2% gelatin, placed in 60 mm culture dish, and then 1 × 10⁶ cancer cells per dish were seeded. After 24 h, the cells seeded on the cover glass were inserted into the cuvette chamber filled with culture medium (Supplemental Figure S1B) and the cells were exposed to hyperthermia at 43 °C for 1 h using the machine at a power range of 6 to 10 Watt (Supplemental Figure S2B). The cells were treated with general hyperthermia for the indicated times in a CO2 incubator set at 43 °C.
Five-week-old female athymic nude mice (Envigo Korea Co., Ltd., Republic of Korea) were injected with OVCAR-3 and SNU-17 cells (3 × 10⁶ cells/mouse) in the right flank to form xenograft tumors. Three (OVCAR-3 cells) and six (SNU-17 cells) mice were included in the control and test groups, which were treated at 39 °C and 41 °C for 15 min, using direct contact with the electrode textile that was dampened with saline (Supplemental Figure S1A and S2A). Before applying mEHT at the indicated temperature for 15 min, the xenograft mice were intraperitoneally injected with 200 µL of the anesthetic agents ZoletilTM50 and Rompun® in saline at a ratio of 1:1:7, respectively.
The tumor dimensions were measured using digital calipers daily, and the tumor volume was calculated according to the following formula: tumor volume (mm3) = length × width2 × 0.5. Tumor xenografts were harvested 7 days after the first application of mEHT. Cancer tissues from patients with endometrial (PDTX-04), ovarian high-grade serous type (PDTX-09), and cervical (PDTX-19) cancer were cut into pieces of approximately 3 mm and transplanted into the left and right flanks of athymic nude mice to establish the PDTX. When the xenograft tumors reached an average of 500 mm3, they were first exposed to mEHT at 39 °C or 41 °C for 15 min. We previously tested various mEHT conditions using in vivo mouse experiments. Under our experimental conditions, we discovered that exposure to mEHT for 15 min at 41 °C caused burns in the xenograft tumor skin.
Therefore, the optimized mEHT protocol for the mouse experiment was determined to be <41 °C for 15 min for each exposure. The method used to measure the PDTX size was the same as that used for the cell line xenografts. However, the final volumes of the PDTX-04 and PDTX-09 were determined as the change in tumor size value (Δ tumor volume = final tumor volume – initial tumor volume, Supplemental figure S4). Additionally, to analyze the hematoxylin and eosin (H&E) images, the pathologist marked the damaged and whole tissue regions on the H&E slides (Supplemental Figure S5). The marked regions on the H&E slides were quantified using the Image J 1.48v software (National Institutes of Health [NIH] Bethesda, MD, USA).
All animal experiments were approved by the Institutional Animal Care and Use Committee of Yonsei University in the Republic of Korea (IACUC Approval No. 2014–0346). Before this study commenced, approval was obtained from the Institutional Review Board (IRB) of Gangnam Severance Hospital (IRB No. 3–2014-0184), written informed consent to participate in the study was obtained from each patient, and all experiments were performed in accordance with relevant guidelines and regulations. Tissue samples of patients with cancer were provided by the Korea Gynecologic Cancer Bank [KGCB] through the Bio and Medical Technology Development Program of the Ministry of Education, Science and Technology, Korea.
Autophagy detection
OVCAR-3 cells were seeded on 0.2% gelatin-coated glass coverslips and were exposed mEHT at 43 °C for 1 h. Subsequently, cells were divided into 24-well plates, incubated for 24 h, and then the live cells were stained with 1 µM Lysotrack® Green DND-26 and 1 µg/mL Hoechst 33342 for 25 min. Images of the cells were acquired using an EVOS® FL cell imaging system (ThermoFisher Scientific, Rockford, IL, USA). The images were quantified using the ImageJ 1.48v software, and all experiments were performed in triplicate.
Statistical analysis
The results are expressed as the means ± standard error (SE) and all analyses were performed using the GraphPad Prism 6 software. Differences were considered significant at a *p < .05, **p < .01, and ***p < .001.
Results
mEHT inhibited the growth rate in ovarian and cervical cancer cells
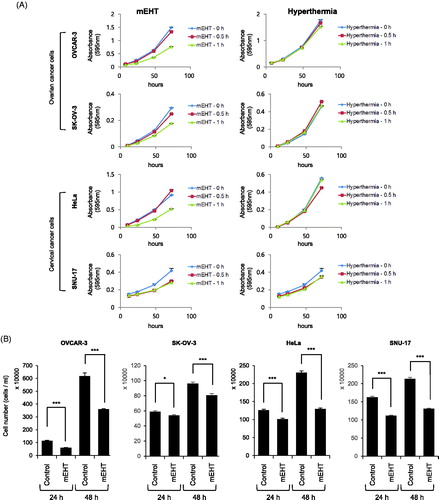
To determine the optimized mEHT conditions for the in vitro experiment, various conditions were tested using HeLa cells (treatment conditions were temperatures of 42 °C to 44 °C for 30 min and 1 h, and an incubation time of up to 72 h). The optimal condition for mEHT was confirmed to be the heat shock at 43 °C for 30 min and 1 h (Supplemental figure S3). Subsequently, to determine the effect of mEHT on ovarian and cervical cancer cells, they were heat-shocked using an mEHT device (LabEHY-100) at 43 °C for 30 min, and 1 h and the effect was compared with that of general hyperthermia under the same conditions (using a CO2 incubator). The cell viability was measured using the crystal violet assay. The result revealed that heat shock with mEHT at 43 °C for 1 h significantly reduced the cell growth rate compared with that of the untreated control cells. Additionally, mEHT showed enhanced cell growth inhibition compared with general hyperthermia (following incubation for 72 h after mEHT treatment at 43 °C for 1 h, the cell growth rate compared with the control was 51.6%, 60.3%, 57.2% and 67.4% and corresponding values of general hyperthermia were 86.8%, 101.9%, 96.4% and 84.0% in OVCAR-3, SK-OV-3, HeLa, and SNU-17 cells, respectively, ). In addition, OVCAR-3 and HeLa cells were exposed to mEHT at 43 °C for 1 h, incubated for 24 or 48 h in a 5% CO2 incubator at 37 °C, and then cell numbers were determined using the LUNAIITM automated cell counter. The results showed there were fewer mEHT-exposed OVCAR-3 and HeLa cells at 24 h or 48 h than there were control cells. The variation in the OVCAR-3 cell number was 52.2% at 24 h and 58.3% at 48 h, while that of the HeLa cells was 80.3% at 24 h and 56.3% at 48 h (). The western blot analysis revealed that OVCAR-3, SK-OV-3, HeLa, and SNU-17 cells that were heat-shocked with mEHT showed higher phosphorylation levels of p38, a stress-dependent kinase, than those by cells exposed to general hyperthermia (). In addition, the levels of cleaved apoptosis markers, caspase-3 and PARP, increased in OVCAR-3 and SNU-17 cells, whereas intracellular HSP90 and HSP70 showed no changes in expression (). Interestingly, p38 was phosphorylated at over 46 °C along with the increase in cleaved caspase-3 and PARP in cells exposed to general hyperthermia (). This result indicates that mEHT more effectively induced cellular damage under similar treatment conditions than that by general hyperthermia. After exposing OVCAR-3 cells to mEHT at 43 °C for 1 h, the sub-G1 population was monitored using FACS analysis for up to 48 h. The results revealed that OVCAR-3 cells exposed to mEHT showed the largest sub-G1 population between 5 and 7.5 h, which gradually declined with time (). These results indicate that the increased apoptosis after the initial exposure to mEHT was reduced with time. Therefore, although mEHT inhibited the growth rate of cancer cells, a single mEHT stimulus was insufficient to inhibit the growth of cancer cells completely.
Figure 1. Modulated electro-hyperthermia (mEHT) diminished growth of ovarian and cervical cancer cells. (A) OVCAR-3, SK-OV-3, HeLa, and SNU-17 cells were exposed to mEHT (at 43 °C for 0.5 or 1 h using mEHT device) or hyperthermia (at 43 °C for 0.5 or 1 h using CO2 incubator), then they were incubated for 0 to 72 h in 5% CO2 incubator at 37 °C. Cell viability was measured using crystal violet assay. Results are means ± standard error (S.E., n = 4). (B) OVCAR-3, SK-OV-3, HeLa, and SNU-17 cells were incubated for 24 and 48 h after mEHT treatment (at 43 °C for 1 h). Cell number was directly counted using LUNA IITM automated cell counter (Logos Biosystems, Inc., Republic of Korea). (C) After exposure to mEHT or hyperthermia for 30 min or 1 h at 43 °C, expression levels of indicated protein and phosphorylated form of p38 (Thr180/Tyr182) were examined using western blot analyses. (D) OVCAR-3, SK-OV-3, and HeLa cells were exposed to hyperthermia at indicated temperatures (37 °C up to 49 °C for 1 h). Expression levels of indicated protein were detected using western blot analyses. (E) OVCAR-3 cells were exposed to mEHT at 43 °C for 1 h. Further, mEHT-exposed cells were incubated for 0 to 48 h. Cell cycle was measured using propidium iodide (PI) staining with fluorescence-activated cell sorting (FACS) analysis. Representative histogram images of four separate experiments are shown (left). Line graph shows quantification of Sub-G1 population of FACS results (right). Results are means ± S.E., n = 4.
mEHT effectively suppressed tumor growth in mouse model
To examine the effectiveness of mEHT in a xenograft mouse model, 3 × 10⁶ OVCAR-3 and SNU-17 cells were injected into athymic nude mice subcutaneously. When the tumor volume reached approximately 400–500 mm3, the xenograft tumors were exposed to mEHT treatment at 39 °C and 41 °C once a day for 7 days (OVCAR-3 and SNU-17 xenografts). The growth rate of mEHT-treated tumors was markedly reduced (). The final volume and weight of xenograft tumors treated with mEHT at both 39 °C and 41 °C were also lower than those of the controls, which were not exposed to mEHT (). We sought to determine if mEHT was effective against cancer tissue from the patients with endometrial, ovarian, and cervical cancer. First, the effects of mEHT were tested on PDTX-04 and PDTX-09 (endometrial and ovarian cancer tissues, respectively). mEHT was administered at 41 °C for 15 min for each exposure (five and four times for PDTX-04 and PDTX-09, respectively). The PDTX-04 xenograft was exposed to mEHT treatment on day 35 to 44 after transplantation, and the tumor volumes were at 524.6 ± 86.5 to 940.9 ± 238.4 mm3 and 810.4 ± 201.2 mm3 to 673.1 ± 344.8 mm3 for the control and mEHT groups, respectively. For the PDTX-09 xenograft, mEHT treatment was administered from day 85 to 104 after transplantation, and the tumor volumes were at 509.5 ± 101.8 to 771.1 ± 69.66 mm3 and 838.4 ± 145.4 to 804.8 ± 156.6 mm3 for the control and mEHT groups, respectively. Finally, the variation in tumor volume in the mEHT group was less than that of the control group (PDTX-04 and PDTX-09 xenografts, p = .1668 and p < .0185, respectively, Supplemental Figure S4 and Supplemental Table S1). For the PDTX-19 cervical cancer tissue xenograft, the results showed that the growth rate following mEHT exposure was suppressed more than that of the control group was (mean volume of control and mEHT groups, 1763.0 ± 294.3 and 411.6 ± 141.8, respectively, , right and bottom, respectively). The final volume and weight of the mEHT-treated PDTX-19 tumors were lower than those of the control group (, bottom). These results indicate that mEHT significantly reduced the growth rate of tumors in an in vivo xenograft mouse model of PDTX tumors.
Figure 2. Modulated electro-hyperthermia (mEHT) suppressed xenograft tumor growth. Flanks of groups of athymic nude mice were inoculated subcutaneously with 3 × 10⁶ OVCAR-3 and SNU-17 cells, and parallel groups were transplanted subcutaneously with patient-derived tumor xenograft pieces of approximately 3 mm in length and width (patient-derived xenograft [PDX]-19, cervical cancer). mEHT was directly applied to the surface of each xenograft tumor at indicated temperature (cell line xenograft: 39 °C or 41 °C for 15 min/day, seven times; PDX-19 xenograft: 39 °C for 15 min/day, 15 times). Subsequently, xenograft tumor diameters were measured daily before applying mEHT using digital calipers. (A) Gross images of tumor masses from xenograft mice from each group. Scale bar =1 cm. (B) Xenograft tumor growth rate. (C) Final volume and weight of xenograft tumor. Results are means ± standard error (SE; OVCAR-3 and PDX-19, n = 3; SNU-1, n = 5/per group (*p <.05 and **p <.01).
![Figure 2. Modulated electro-hyperthermia (mEHT) suppressed xenograft tumor growth. Flanks of groups of athymic nude mice were inoculated subcutaneously with 3 × 10⁶ OVCAR-3 and SNU-17 cells, and parallel groups were transplanted subcutaneously with patient-derived tumor xenograft pieces of approximately 3 mm in length and width (patient-derived xenograft [PDX]-19, cervical cancer). mEHT was directly applied to the surface of each xenograft tumor at indicated temperature (cell line xenograft: 39 °C or 41 °C for 15 min/day, seven times; PDX-19 xenograft: 39 °C for 15 min/day, 15 times). Subsequently, xenograft tumor diameters were measured daily before applying mEHT using digital calipers. (A) Gross images of tumor masses from xenograft mice from each group. Scale bar =1 cm. (B) Xenograft tumor growth rate. (C) Final volume and weight of xenograft tumor. Results are means ± standard error (SE; OVCAR-3 and PDX-19, n = 3; SNU-1, n = 5/per group (*p <.05 and **p <.01).](/cms/asset/53f42dbb-9d0d-42de-b022-859a8150a4b2/ihyt_a_1528390_f0002_c.jpg)
Size and intracellular granularity of heat-shocked cancer cells were increased
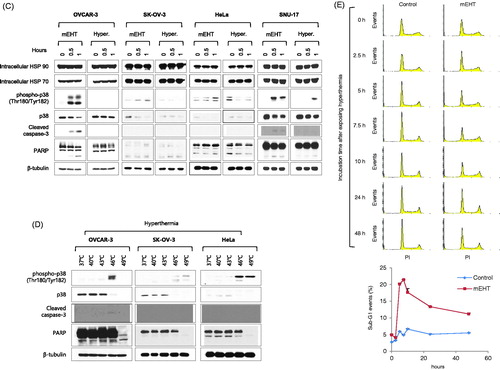
The cell number and size of mEHT-exposed cancer cells was measured using an automated cell counter, and the mEHT-treated cells were fewer than the control cells were after 24 and 48 h (). Interestingly, the mEHT-exposed cancer cells were larger than the control cells (Cell size: 11.60 ± 0.16 to 12.97 ± 0.12 µm and 10.81 ± 0.21 to 13.11 ± 0.06 µm at 24 and 48 h, respectively for OVCAR-3 cells; 14.98 ± 0.07 to 15.61 ± 0.08 µm and 14.59 ± 0.07 to 15.17 ± 0.08 µm at 24 and 48 h, respectively for HeLa cells; ). These results could be attributable to errors in the automatic cell counter, and an FACS analysis was additionally used to measure the cell size and intracellular granularity. FACS analysis of OVCAR-3 cells exposed to mEHT at 43 °C for 1 h showed increases in both intracellular granularity (side scattered light, SSC) and cell size (forward scattered light, FSC) at 24 and 48 h, compared to the control cells (increased population: SSC = 14.1%, FSC = 8.16% based on R-1 or R-2 gate, respectively at 48 h, ). These results indicate there were substantial physical or physiological changes in cancer cells after mEHT treatment.
Figure 3. Modulated electro-hyperthermia (mEHT)-exposed cancer cells increased in size and intracellular granularity. OVCAR-3 and HeLa were exposed to mEHT at 43 °C for 1 h and incubated for 0, 24, or 48 h at 37 °C in a CO2 incubator. (A) Cell size was measured at indicated times using automatic cell counter LUNA II (Logos Biosystems, Inc., Republic of Korea). Results are means ± standard error (SE, n = 10, ***p < .001). (B) Cell size (FSC) and intracellular granularity (SSC) of OVCAR-3 cells exposed to mEHT were examined using fluorescence (FACS) analysis with propidium iodide (PI) staining. Representative scatter plots of four separate experiments are shown (top). Quantification of FACS analysis results (bottom, line graph). Results are means ± SE, n = 4 (***p < .001).
Autophagy was induced in mEHT-exposedOVCAR-3 cells
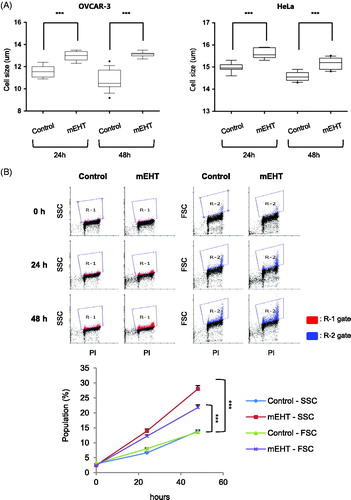
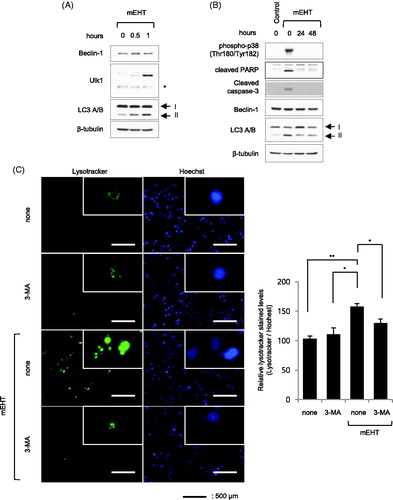
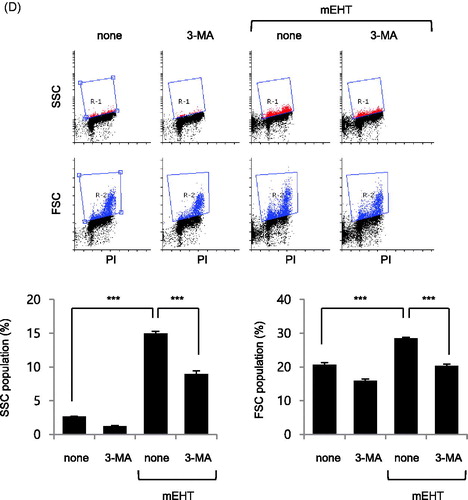
Previous reports showed that intracellular granularity was increased by autophagic vacuoles induced by intracellular autophagy processes [Citation31,Citation32]. Thus, to determine if the increased intracellular granularity was correlated with autophagy, OVCAR-3 cells were treated with mEHT (43 °C for 0.5 and 1 h), followed by western blotting to detect Beclin-1, Ulk1 and LC3 A/B, which are major proteins involved in the regulation of autophagy. The result showed that the levels of Ulk1 and type II LC3 A/B were increased in a time-dependent manner by mEHT treatment (). We investigated changes in the autophagy markers following cell damage recovery, by exposing OVCAR-3 cells to mEHT (43 °C for 1 h), followed by incubation for 24 and 48 h, and then the expression of indicated proteins was measured using western blotting (). The results revealed that all the increased phosphorylation levels of p38, cleaved PARP, and cleaved caspase-3 observed 1 h after mEHT exposure disappeared after 24 and 48 h, whereas the high-level expression of type II LC3 A/B persisted (). In addition, the increased lysotracker signal induced by mEHT was decreased by treatment with the autophagy inhibitor, 3-MA (157.8% ± 5.1 in mEHT; 129.9% ± 6.9 in mEHT with 3-MA). The results revealed that the autophagy level increased after mEHT treatment (). Moreover, inhibition of autophagy by 3-MA after mEHT exposure reduced the mEHT-induced increase in intracellular granularity and cell size (15% to 8.97% and 28.54% to 20.41% in R-1 and R-2 gates, respectively, ). Thus, it appeared that the mEHT-induced increase in intracellular granularity and cell size were mediated by autophagy.
Figure 4. Autophagy was induced in OVCAR-3 cells by modulated electro-hyperthermia (mEHT) treatment. OVCAR-3 ovarian cancer cells were exposed to mEHT at 43 °C for 1 h and harvested directly for cell lysate preparation. (A) Expression levels of indicated protein were evaluated using western blot analysis. (B) Samples were incubated long-term (24 and 48 h) after exposure to 43 °C for 1 h, followed by western blot analysis. (C) OVCAR-3 ovarian cancer cells were exposed to 43 °C for 1 h in the presence of 1 mM 3-methyladenine (3-MA) for 24 h, and then stained with 1 μg/mL Hoechst 33342 and 1 μM Lysotracker for 25 min. Representative images of three separate experiments are shown (left). Scale bar =500 μm. Fluorescence images were quantified using ImageJ 1.48v software (right, bar graph). Results are means of relative stained intensity ± standard error (SE, n = 3; *p < .05 and **p < .01). (D) Cell size (FSC) and intracellular granularity (SSC) were measured using fluorescence-activated cell sorting (FACS) analysis. Representative images of three separate experiments are shown (top, scatter plots). Quantification of R-1 (SSC) or R-2 (FSC) gate of scatter plots (bottom, bar graphs). Results are means ± SE, n = 3 (***p < .001).
Inhibition of autophagy significantly enhanced sensitivity to mEHT-induced apoptosis
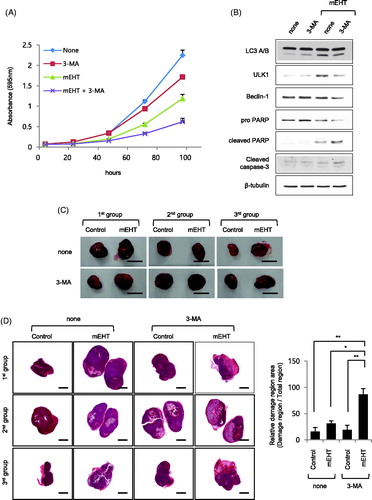
We investigated the effect of inhibiting the mEHT-induced autophagy increase in OVCAR-3 and HeLa ovarian cancer cells using 3-MA. The crystal violet assay of the cell growth rate for up to 96 h revealed that it was clearly lower following cotreatment with mEHT and 3-MA than following treatment with either agent alone ( and Supplemental Figure S5A). Moreover, the western blotting results of the OVCAR-3 cells showed that cotreatment with mEHT and 3-MA decreased levels of type II LC3 A/B, ULK1, and Beclin-1 autophagy markers, whereas it clearly increased those of the apoptosis markers, cleaved PARP, and caspase-3 (). Additionally, we determine the effects of cotreatment of OVCAR-3 cells with bafilomycin, an inhibitor of the late phase of autophagy, and mEHT. The result showed a more diminished cell growth rate occurred with cotreatment than with either agent alone, similar to the results of 3-MA cotreatment (Supplemental Figure S5B). We also determine the effect of cotreatment on an in vivo mouse model of athymic nude mice to determine the degree of tissue damage in the xenograft tumor tissues. Two xenograft tumors per one mouse using OVCAR-3 cell lines were formed in six mice. When the tumor volume reached 502.3 ± 41.43 mm3, three mice were pretreated with 2 mg/kg 3-MA and treated with one flank of xenograft tumor at mEHT 39 °C for 30 min. After 12 h, xenograft tumors were harvested. (). The results of the analysis of the pathologist showed that the area of the damaged tissue was higher following the cotreatment with mEHT and 3-MA than it was with mEHT alone (relative damaged tissue area: 16.10 ± 7.72%, 31.23 ± 5.27%, 19.23 ± 8.54%, and 86.57 ± 11.23%; control, mEHT, 3-MA, and mEHT plus 3-MA groups, respectively; and Supplemental Figure S6). These results indicate that cotreatment with mEHT and the autophagy inhibitor inhibited the growth of ovarian cancer cells more effectively than that by mEHT alone.
Figure 5. Autophagy protected against apoptosis of modulated electro-hyperthermia (mEHT)-exposed OVCAR-3 ovarian cancer cells. OVCAR-3 ovarian cancer cells were exposed to 43 °C for 1 h in the presence of 1 mM 3-methyladenine (3-MA) using mEHT device for up to 96 h. (A) Cell viability was measured using crystal violet assay. Results are means ± standard error (SE, n = 4). (B) OVCAR-3 cells were incubated for 24 h after mEHT exposure at 43 °C for 1 h, and then harvested to prepare protein lysates. Indicated protein expression levels were examined using western blot analyses. (C) Athymic nude mice were inoculated subcutaneously in one flank with 3 × 10⁶ OVCAR-3 cells. After 15 days, xenograft cancer tissues were exposed to 39 °C for 15 min in the presence of 2 mg/kg 3-MA using mEHT device. Subsequently, mice were euthanized and xenograft cancer tissues were harvested 12 h after treatment with mEHT and 3-MA. Gross images of tumor masses from xenograft mice from each group. Scale bar = 1 cm. (D) Slides of sectioned formalin-fixed paraffin-embedded (FFPE) xenograft cancer tissue blocks were stained using hematoxylin and eosin (H&E, left, tissue images). Scale bar = 2.5 mm. Measured area was quantified using ImageJ 1.48v software (right, bar graph). Results are means of relative ratio value of damage area in cancer tissue ± SE, n = 3 (*p < .05 and **p < .01).
Discussion
mEHT is a loco-regional hyperthermia method that has been proven effective in various in vitro, in vivo and clinical studies for over 20 years since its initial development [Citation15]. This study aimed to validate the anticancer effect of mEHT on ovarian cancer and investigate whether cotreatment would improve its anticancer effect. Ovarian (OVCAR-3 and SK-OV-3) and cervical (HeLa and SNU-17) cancer cells treated with mEHT showed reduced cell growth and increased apoptosis. In addition, mEHT greatly decreased tumor growth in xenograft mouse models established using cancer cell-based and patient-derived tumor xenografts. These results were consistent with those of previous studies reporting that apoptosis of U937 lymphoma [Citation33–35], HepG2 hepatocarcinoma [Citation17], and HT-29 colorectal carcinoma [Citation18] cells was induced by exposure to mEHT. Our results were unusual in that OVCAR-3 cells exposed to mEHT showed no accumulated cell damage after 24 h but, instead, the cells recovered. Interestingly, the FACS results revealed that intracellular granularity and cell size increased 24 and 48 h after mEHT exposure, and the increased cell size was confirmed using an automatic cell counter. Intracellular granularity has been reported to increase during terminal growth arrest and cell death stages after the treatment with anticancer drugs [Citation36]. This was also observed with increases in senescence [Citation37,Citation38], apoptosis [Citation39], and autophagic vacuoles induced by autophagy [Citation31,Citation32]. In addition, intracellular granularity increased with autophagic cell death when pancreatic cancer cells were treated with benzo[alpha]phenoxazines derivatives [Citation40]. During osteoblast differentiation, cell size and granularity were elevated as well as autophagy [Citation41]. Thus, it is highly likely that the larger size and higher granularity of OVCAR-3 ovarian cancer cells after mEHT treatment than before treatment could be related to autophagy. To examine this hypothesis, OVCAR-3 cells were exposed to mEHT, which elevated the expression level of the autophagy markers. Especially, the expression level of the LC3 type II form was maintained in cells even after 24 and 48 h exposure to mEHT, corresponding to the recovery stage from heat-induced damage. Furthermore, treatment with 3-MA, an autophagy inhibitor, decreased the mEHT-induced autophagy, which was accompanied by a reduction in cell size and granularity. Moreover, cotreatment with mEHT and 3-MA reduced the cell growth more markedly than that by individual treatments. Although not all the results were confirmed by the same experimental method, the results of cervical cancer HeLa cells were similar to those of the OVCAR-3 cells. Additionally, this was confirmed in the xenograft mouse model using OVCAR-3 cells. Thus, we found that autophagy was increased in the mEHT-treated ovarian and cervical cancer cells, and mEHT-induced cellular damage was recovered by autophagy.
In conclusion, we demonstrated that mEHT induced the death of ovarian and cervical cancer cells through apoptosis, and its anticancer effect was enhanced by inhibiting mEHT-induced autophagy. Therefore, it is expected that mEHT could be used to treat cancer as an adjuvant or complementary therapy. However, further, more details are required to verify these findings.
Figures S1-S6 and Table S1
Download PDF (845.7 KB)Acknowledgements
We thank Dr. Andocs Gabor of Department of Radiological Sciences, Graduate School of Medicine and Pharmaceutical sciences, University of Toyama, Toyama, Japan for technical support of LabEHY-100 device and reviewing this manuscript.
Disclosure statement
Jae-Hoon Kim received a part of research funds by HOSPICARE, Co., Ltd. (Republic of Korea). All of authors, excepted Gwan Hee Han, hold a patent about this study on Korea Intellectual Property Office (KIPO).
Additional information
Funding
Related Research Data
Reference
- McGuire S. World Cancer Report 2014. Geneva, Switzerland: World Health Organization, International Agency for Research on Cancer, WHO Press, 2015. Adv Nutr. 2016;7:418–419.
- Siegel RL, Miller KD, Jemal A. Cancer Statistics, 2017. CA Cancer J Clin. 2017;67:7.
- Hisamatsu T, Mabuchi S, Yoshino K, et al. Prediction of progression-free survival and response to paclitaxel plus carboplatin in patients with recurrent or advanced cervical cancer. Int J Gynecol Cancer. 2012;22:623–629.
- Dixon SC, Nagle CM, Wentzensen N, et al. Use of common analgesic medications and ovarian cancer survival: results from a pooled analysis in the Ovarian Cancer Association Consortium. Br J Cancer. 2017;116:1223–1228. doi: 10.1038/bjc.2017.68.
- Cancer Genome Atlas Research Network. Integrated genomic analyses of ovarian carcinoma. Nature. 2011;474:609–615.
- Cancer Genome Atlas Research Network, Albert Einstein College of Medicine, Analytical Biological Services et. al. Integrated genomic and molecular characterization of cervical cancer. Nature. 2017;543:378–384.
- Fong PC, Boss DS, Yap TA, et al. Inhibition of poly(ADP-ribose) polymerase in tumors from BRCA mutation carriers. N Engl J Med. 2009;361:123–134.
- Ledermann J, Harter P, Gourley C, et al. Olaparib maintenance therapy in patients with platinum-sensitive relapsed serous ovarian cancer: a preplanned retrospective analysis of outcomes by BRCA status in a randomised phase 2 trial. Lancet Oncol. 2014;15:852–861.
- Oza AM, Cibula D, Benzaquen AO, et al. Olaparib combined with chemotherapy for recurrent platinum-sensitive ovarian cancer: a randomised phase 2 trial. Lancet Oncol. 2015;16:87–97.
- Ledermann JA, Harter P, Gourley C, et al. Overall survival in patients with platinum-sensitive recurrent serous ovarian cancer receiving olaparib maintenance monotherapy: an updated analysis from a randomised, placebo-controlled, double-blind, phase 2 trial. Lancet Oncol. 2016;17:1579–1589.
- Chicheł A, Skowronek J, Kubaszewska M, et al. Hyperthermia – description of a method and a review of clinical applications. Rep Pract Oncol Radiother. 2007;12:267–275.
- Hildebrandt B, Wust P, Ahlers O, et al. The cellular and molecular basis of hyperthermia. Crit Rev Oncol Hematol. 2002;43:33–56.
- Wust P, Hildebrandt B, Sreenivasa G, et al. Hyperthermia in combined treatment of cancer. Lancet Oncol. 2002;3:487–497.
- Fotopoulou C, Cho CH, Kraetschell R, et al. Regional abdominal hyperthermia combined with systemic chemotherapy for the treatment of patients with ovarian cancer relapse: results of a pilot study. Int J Hyperthermia. 2010;26:118–126.
- Andocs G, Rehman MU, Zhao QL, et al. Comparison of biological effects of modulated electro-hyperthermia and conventional heat treatment in human lymphoma U937 cells. Cell Death Dis. 2016;2:16039.
- Andocs G, Szasz O, Szasz A. Oncothermia treatment of cancer: from the laboratory to clinic. Electromagn Biol Med. 2009;28:148–165.
- Yang KL, Huang CC, Chi MS, et al. In vitro comparison of conventional hyperthermia and modulated electro-hyperthermia. Oncotarget. 2016;7:84082–84092.
- Meggyeshazi N, Andocs G, Balogh L, et al. DNA fragmentation and caspase-independent programmed cell death by modulated electrohyperthermia. Strahlenther Onkol. 2014;190:815–822.
- Tsang YW, Huang CC, Yang KL, et al. Improving immunological tumor microenvironment using electro-hyperthermia followed by dendritic cell immunotherapy. BMC Cancer. 2015;15:708. doi: 10.1186/s12885-015-1690-2.
- Cha J, Jeon TW, Lee CG, et al. Electro-hyperthermia inhibits glioma tumorigenicity through the induction of E2F1-mediated apoptosis. Int J Hyperthermia. 2015;31:784–792.
- Wilde L, Tanson K, Curry J, et al. Autophagy in cancer: a complex relationship. Biochem J. 2018;475:1939–1954.
- Glick D, Barth S, Macleod KF. Autophagy: cellular and molecular mechanisms. J Pathol. 2010;221:3–12.
- Friant S, Meier KD, Riezman H. Increased ubiquitin-dependent degradation can replace the essential requirement for heat shock protein induction. EMBO J. 2003;22:3783–3791.
- Maiuri MC, Zalckvar E, Kimchi A, et al. Self-eating and self-killing: crosstalk between autophagy and apoptosis. Nat Rev Mol Cell Biol. 2007;8:741–752.
- Salomons FA, Menendez-Benito V, Bottcher C, et al. Selective accumulation of aggregation-prone proteasome substrates in response to proteotoxic stress. Mol Cell Biol. 2009;29:1774–1785.
- Zhang Y, Calderwood SK. Autophagy, protein aggregation and hyperthermia: a mini-review. Int J Hyperthermia. 2011;27:409–414.
- Lavandero S, Chiong M, Rothermel BA, et al. Autophagy in cardiovascular biology. J Clin Invest. 2015;125:55–64.
- White E. The role for autophagy in cancer. J Clin Invest. 2015;125:42–46.
- Yang Z, Goronzy JJ, Weyand CM. Autophagy in autoimmune disease. J Mol Med. 2015;93:707–717.
- Bellmann K, Charette SJ, Nadeau PJ, et al. The mechanism whereby heat shock induces apoptosis depends on the innate sensitivity of cells to stress. Cell Stress Chaperones. 2010;15:101–113.
- Monastyrska I, Klionsky DJ. Autophagy in organelle homeostasis: peroxisome turnover. Mol Asp Med. 2006;27:483–494.
- Rubinsztein DC, Gestwicki JE, Murphy LO, et al. Potential therapeutic applications of autophagy. Nat Rev Drug Discov. 2007;6:304–312.
- Kameda K, Kondo T, Tanabe K, et al. The role of intracellular Ca(2+) in apoptosis induced by hyperthermia and its enhancement by verapamil in U937 cells. Int J Radiat Oncol Biol Phys. 2001;49:1369–1379.
- Hirano H, Tabuchi Y, Kondo T, et al. Analysis of gene expression in apoptosis of human lymphoma U937 cells induced by heat shock and the effects of alpha-phenyl N-tert-butylnitrone (PBN) and its derivatives. Apoptosis. 2005;10:331–340.
- Wada S, Tabuchi Y, Kondo T, et al. Gene expression in enhanced apoptosis of human lymphoma U937 cells treated with the combination of different free radical generators and hyperthermia. Free Radic Res. 2007;41:73–81.
- Haynes MK, Strouse JJ, Waller A, et al. Detection of intracellular granularity induction in prostate cancer cell lines by small molecules using the HyperCyt high-throughput flow cytometry system. J Biomol Screen. 2009;14:596–609.
- Sherwood SW, Rush D, Ellsworth JL, et al. Defining cellular senescence in IMR-90 cells: a flow cytometric analysis. Proc Natl Acad Sci USA. 1988;85:9086–9090.
- Barranco WT, Eckhert CD. Cellular changes in boric acid-treated DU-145 prostate cancer cells. Br J Cancer. 2006;94:884–890.
- Dive C, Gregory CD, Phipps DJ, et al. Analysis and discrimination of necrosis and apoptosis (programmed cell death) by multiparameter flow cytometry. Biochim Biophys Acta. 1992;1133:275–285.
- Pal S, Salunke-Gawalib S, Konkimallaa VB. Induction of autophagic cell death in apoptosis-resistant pancreatic cancer cells using benzo[alpha]phenoxazines derivatives, 10-methyl-benzo[alpha]phenoxazine-5-one and benzo[alpha]phenoxazine-5-one. Anticancer Agents Med Chem. 2017;17:115–125.
- Kaluđerović MR, Mojić M, Schreckenbach JP, et al. A key role of autophagy in osteoblast differentiation on titanium-based dental implants. Cells Tissues Organs. 2014;200:265–277.