
Abstract
Objective: To establish a model of incomplete ablation in nude mice with hepatocellular carcinoma (HCC) and to evaluate heat shock protein (HSP) expression and autophagy and their correlation.
Materials and methods: In the first stage, 12 nude mice with HCC were randomly divided into two groups (n = 6). A sham puncture operation was performed for one group, and palliative laser ablation was performed for the other group. All mice were sacrificed after 18 h, and HSP expression, autophagy, and apoptosis were assessed. In the second stage, 16 nude mice with HCC were randomly divided into two groups (n = 8). One group was given an HSP90 inhibitor before the operation, and the other group was given dimethyl sulfoxide (DMSO) as a control. HSP expression, autophagy and apoptosis were assessed for the two groups after palliative laser ablation.
Results: In the incomplete ablation model, using nude mice with HCC, HSP90, HSP70, and HSP27 expression was up-regulated, Akt and mTOR phosphorylation was enhanced, autophagy was decreased, and apoptosis was increased. After administration of the HSP90 inhibitor, HSP90, P-Akt, and P-mTOR expression was decreased, autophagy was increased, and apoptosis was further increased.
Conclusion: Autophagy was decreased in the incomplete ablation model and might be inversely correlated with HSP expression. It is suggested that the HSP90/Akt/mTOR pathway is involved in signal transmission between autophagy and HSPs.
Introduction
Thermal ablation for hepatocellular carcinoma (HCC) has been gradually recognized as having the advantages of being effective, minimally invasive, safe, and repeatable and obtaining satisfactory long-term follow-up efficacy for localized treatment. Percutaneous laser ablation (PLA) is a newly emerging technology in the field of thermal ablation. The functional mechanism of PLA is conversion of laser energy into thermal energy, causing tumor tissue coagulation and necrosis. The residual tumor is the main factor that affects the survival rate of patients with HCC after ablation [Citation1–5].
Both autophagy and the heat stress response represent protein management alternatives for the stressed cell after heat injury. Heat shock proteins regulate the folding and repair of heat-damaged proteins; conversely, proteasomes and the autophagy system play roles in the degradation of dysfunctional proteins. Increased reactivity of the HSP90 and HSP70 HSP family members after incomplete thermal ablation has been reported in the literature and may play a protective role in reducing cell apoptosis [Citation6–13], whereas changes in autophagy after incomplete ablation have rarely been reported. Although these two processes are the major self-repair systems in cells, no study has investigated their interactions in a tumor thermal injury model. This study is the first to report changes in these two systems after heat injury and investigate the relationship between them.
Heat shock protein 90, as a molecular chaperone, is essential for the proper functioning of Akt because it forms a chaperone–substrate protein complex, and a reduction in Hsp90-Akt binding results in Akt inactivation [Citation14,15]. Akt and mammalian target of rapamycin (mTOR) are involved in molecular cross-talk between apoptosis and autophagy [Citation16]. We tested the Akt/mTOR pathway to determine if these are involved in HSP expression and autophagy after incomplete thermal ablation.
Materials and methods
Experimental design
First stage: A nude mouse model with Huh7 tumor implantation was used. A total of 12 nude mice with HCC were randomly divided into two groups with six mice in each group. The first group was the blank control group that underwent a sham puncture operation. The second group was the laser treatment group (experimental group) that underwent palliative laser ablation. Second stage: A total of 16 nude mice with HCC were randomly divided into two groups with eight mice in each group. The mice in the first group received an intraperitoneal dimethyl sulfoxide (DMSO) injection + laser ablation (DMSO group). The mice in the second group received an intraperitoneal injection of an HSP90 inhibitor + laser ablation (HSP90 inhibition group).
Animal model
Healthy female BALB/c nude mice (body weight 12–16 g, 4 weeks old) were purchased from the Shanghai Cancer Institute, China. The nude mice were housed in a specific pathogen-free (SPF) animal room and reared in accordance with the requirements of the SPF grade with sterilized drinking water, feed and litter. All experimental procedures followed the operational specifications for experimental animals at Zhejiang University. A Huh7 tumor tissue exhibiting sufficient growth was cut into 2-mm3 pieces and subcutaneously implanted into the right flanks of the nude mice using a 20-gauge trocar. A total of 28 nude mice were implanted during the two stages. After 3 weeks when the tumors grew to an average diameter of 0.8–1.0 cm, the mice were used for the experiments. The grouping was performed using the random number method.
Palliative ablation method
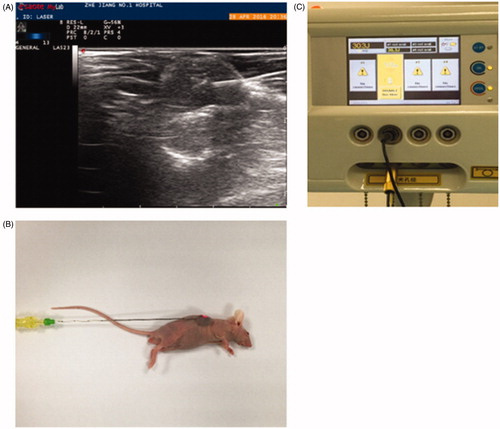
Intraperitoneal anesthesia was administered to the nude mice in the experimental and control groups with approximately 200 μl of 4% chloral hydrate in a 100 μl/10 g dose. The mouse was fixed on the operating table with local disinfection, and the tumor size was observed and measured by high-frequency ultrasound. An ultrasound-guided 21 G PTC needle was punctured into the tumor, and the inner core was smoothly withdrawn. Subsequently, a laser fiber was inserted into the needle. After the fiber was ultrasonically confirmed to be positioned at one-third of the length of the tumor, the power was set at 1 W, and the foot switch was activated for continuous laser ablation; the treatment time was 30 s (a total dose of 30 J). After the treatment, the fiber was removed, and local hemostasis was conducted by applying gentle pressure (). In the control group, a sham operation was performed. The laser fiber was introduced into the one-third of the length of the tumor for 30 s and then removed as described above, and local hemostasis was conducted by gentle pressing.
Figure 1. Mice in the experimental with laser ablation. (A) An high-frequency ultrasound-guided laser fiber into the center of the tumor. (B) When started ablation, red bright spot was seen in the tumor center. (C) Real-time display of working power on operating panel.
Drug preparation and intraperitoneal injection
After dissolving 50 mg of 17-AAG in 800 μl of DMSO, normal saline was added to dilute the solution to a total volume of 10 ml with a final concentration of 5 mg/ml.
The following medication was administered to the two groups during the second stage as follows:
First group (DMSO group): Each mouse received an intraperitoneal injection of 300 μl (0.8% concentration) of DMSO.
Second group (HSP90 group): Each mouse received an intraperitoneal injection of 200 μl (5 mg/ml concentration) of 17-AAG.
The medication was administered 25 h and 1 h before the operation.
Sample collection
The nude mice were sacrificed 18 h after the operation. The tumors were removed, and the tumor volumes were measured. The tumor was incised along the long diameter, and three-fourth of the tumor was stored in liquid nitrogen and one-fourth fixed in 4% paraformaldehyde.
TUNEL: The terminal deoxynucleotidyl transferase dUTP nick end labeling (TUNEL) was used to determine the apoptosis of the HCC underwent incompleted ablation. For each section, five or more high-magnification fields (200×) were selected with at least 500 cells to count the number of cells emitting green fluorescence and subsequently calculate the apoptosis index (Ai). The equation was as follows: Apoptosis index = (number of positive cells/total cell number) × 100% ± SD.
LC3 Immunofluorenscence: Sections were stained with LC3-EGFP and observed with a fluorescence microscope. Autophagosome numbers (mean ± sd. n > 150 cells in >10 fields of view) were calculated.
Western blotting: The small tumor samples were lysed using RIPA buffer with a protease inhibitor cocktail on ice with constantly shaking for 30 min, centrifugation 10,000 rpm for 5 min, and supernatants were harvested. For electrophoresis, 20 μl of lysate was applied to each well. After separation by electrophoresis, the proteins were transferred onto a membrane via semi-dry electrophoresis. The membrane containing the proteins was successively incubated in the blocking buffer overnight at 4 °C, with a primary antibody at 37 °C for 1 h and with a secondary antibody at 37 °C for 1 h. Chemiluminescence detection was conducted with exposure in a darkroom. After developing and fixing, the film was photographed using a gel imaging analysis system. The density of the protein bands was determined using ImageJ software (NIH Image J system, Bethesda, MD), normalized to actin expression, and quantified using Microsoft Excel software.
Statistical analysis
All data were analyzed using the SPSS 17.0 statistical software package (version 17.0; SPSS Inc., Chicago, IL). The measurement data are presented as means ± standard deviations, whereas the count data are presented as values and percentages and were assessed using the Chi-square test. Student's t-test was used to compare the means of two samples. Differences with p < .05 were considered significant.
Results
First stage
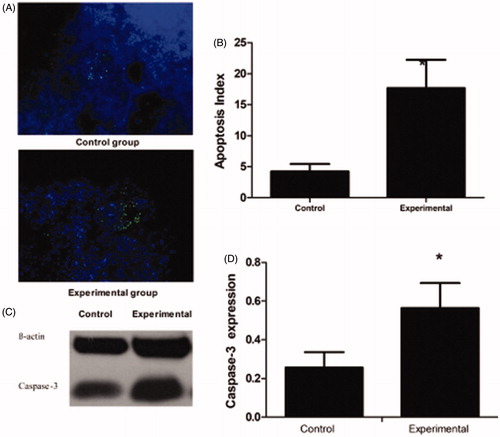
The induction of apoptosis was higher in the experimental group than in the control group. Observation of hematoxylin and eosin (HE)-stained sections under a light microscope showed that some cells appeared shrunken and rounded with a decreased volume, intact cell membrane and visible apoptotic bodies. Additionally, the nuclear chromosomes were aggregated, bordered, or formed massive chromatin. TUNEL assay showed that the apoptosis index was higher for the tumors in the experimental group than for the tumors in the control group (17.7 ± 4.55% versus 4.23 ± 1.20%, p < .05) (). Caspase-3 is essential for certain processes associated with the dismantling of the cell and the formation of apoptotic bodies. It is one of the hallmarks of apoptosis. The western blotting results suggested that caspase-3 protein expression was significantly higher in the tumors in the experimental group than in the control group (), with relative expression levels in the control and experimental groups of 0.256 ± 0.08 and 0.564 ± 0.13, respectively (p < .05) ().
Figure 2. Apoptosis expression in the control group and the experimental group in the first stage. (A) TUNEL staining showed the ratio of apoptotic cells after incompleted ablation. (B) Apoptosis Index of the control and experimental group. (C) Caspase-3 protein expression. (D) Caspase-3 protein relative expression levels. Significant differences were calculated with respect to the control group. *p < .05.
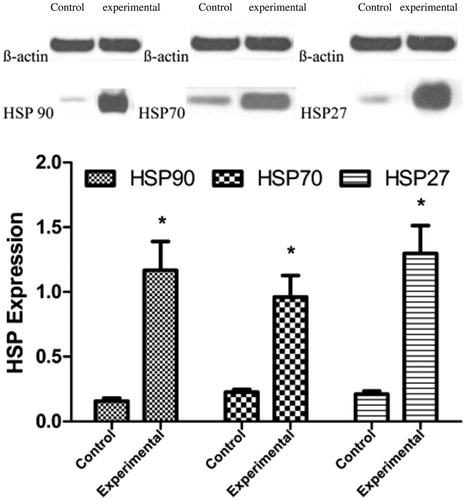
The expression levels of the three HSP proteins were increased in the experimental group. The western blotting results confirmed that the HSP90α, HSP70, and HSP27 expression levels were significantly higher in the experimental group than in the control group. The relative HSP90α, HSP70, and HSP27 expression levels in the control and experimental groups were 0.157 ± 0.024 versus 1.168 ± 0.221, 0.227 ± 0.021 versus 0.961 ± 0.165, and 0.211 ± 0.023 versus 1.298 ± 0.215, respectively (p < .05) ().
Figure 3. HSP90α, HSP70, and HSP27 expression levels in the control and the experimental group. Significant differences were calculated with respect to the control group. *p < .05.
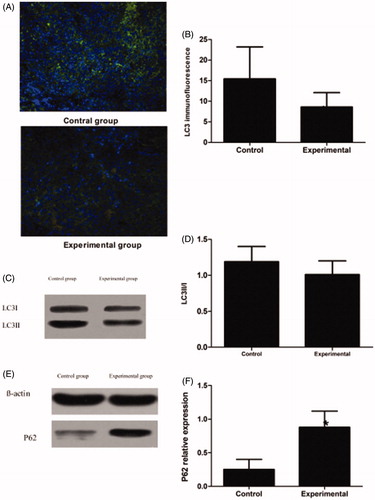
Autophagy was decreased in the tumors in the experimental group. Representative images () of LC3-EGFP puncta (green) and DAPI nuclei staining (blue) are shown. Decreased LC3 puncta per cell follows the incompleted ablation. The positive puncta rates in the control and experimental groups were 15.4 ± 7.8% versus 8.6 ± 3.5% (p < .05) (). The western blotting results indicated that the LC3 II/I ratio was lower for the tumors in the experimental group than for the tumors in the control group; the relative expression levels in the control and experimental groups were 1.19 ± 0.21 versus 1.01 ± 0.19, respectively (p > .05) (). p62 is constantly degraded via autophagy and autophagy inhibition leads to the accumulation of p62 positive aggregates. Based on these properties, monitoring degradation of p62 is used to measure autophagic flux under certain conditions. P62 expression was higher in the tumors in the experimental group than in the tumors in the control group; the relative expression levels of the control and experimental groups were 0.25 ± 0.15 versus 0.88 ± 0.24, respectively (p < .05) ().
Figure 4. Autophagy expression in the control group and the experimental group in the first stage. (A) LC3 immunofluorescence: LC3-EGFP puncta and DAPI nuclei staining are shown. (B) LC3 immunofluorescence Index (C) LC3II/I protein expression. (D) LC3II/I protein relative expression level. (E) P62 protein expression. (F) P62 protein relative expression levels. Significant differences were calculated with respect to the control group. *p < .05.
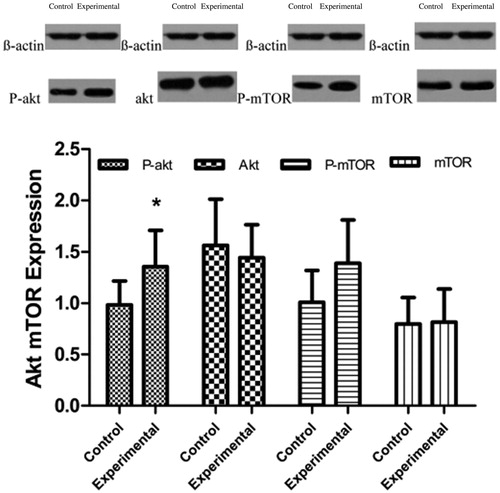
The gray scale value measurements of the western blotting bands suggested that the relative P-Akt expression levels were 0.985 ± 0.231 and 1.356 ± 0.354 in the control and experimental groups, respectively (p < .05), whereas the relative Akt expression levels in the control and experimental groups were 1.563 ± 0.451 and 1.442 ± 0.321, respectively (p > .05). The relative P-mTOR expression levels in the control and experimental groups were 1.008 ± 0.312 and 1.389 ± 0.423, respectively (p = .0531), whereas the relative mTOR expression levels in the control and experimental groups were 0.797 ± 0.258 and 0.816 ± 0.322, respectively; this difference was not significant (p > .05; ).
Figure 5. (A) The western blotting bands of P-akt, akt, P-mTOR, and mTOR in the first stage. (B) P-akt、akt、P-mTOR、mTOR expression levels in the control and experimental groups. Significant differences were calculated with respect to the control group. *p < .05.
Second stage
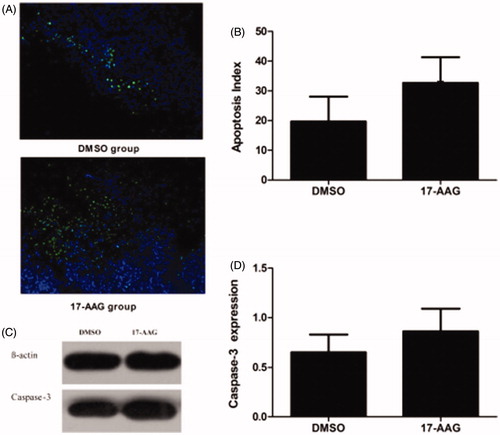
The induction of apoptosis was significantly higher in the HSP90 inhibition group than in the DMSO group. The apoptotic indices of the control and experimental groups based on the TUNEL assay were 19.7 ± 8.4% and 32.7 ± 8.6%, respectively (p < .05) (). The western blotting results suggested that the caspase-3 protein expression level was significantly higher in the tumors in the experimental group than in the tumors in the control group; the relative expression levels in the control and experimental groups were 0.652 ± 0.18 and 0.862 ± 0.23, respectively (p < .05) ().
Figure 6. Apoptosis expression in the DSMO group and the HSP90 inhibition group in the second stage. (A) TUNEL staining showed the ratio of apoptotic cells in the groups. (B) Apoptosis Index of the DSMO group and the HSP90 inhibition group. (C) Caspase-3 protein expression. (D) Caspase-3 protein relative expression levels. Significant differences were calculated with respect to the DMSO group. *p < .05.
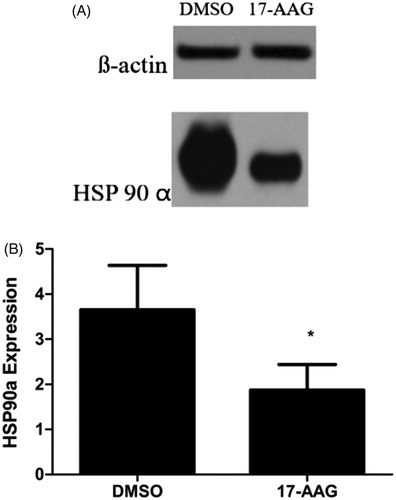
The western blotting results confirmed that HSP90α protein expression was significantly lower in the 17-AAG group than in the control group. The relative HSP90a expression levels in the control and 17-AGG groups were 3.652 ± 0.986 and 1.874 ± 0.567, respectively (p < .05) ().
Figure 7. HSP90α expression in (A) DMSO and (B) 17-AAG group. Significant differences were calculated with respect to the DMSO group. *p < .05.
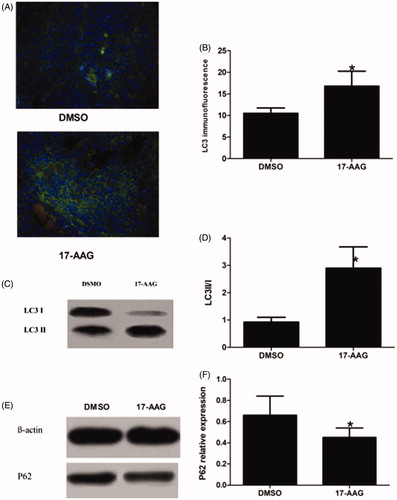
Autophagy was increased in the tumors in the HSP90 inhibition group compared with the tumors in the control group. Increased GFP-LC3 puncta per cell (green fluorescent spot) was detected in the 17-AAG group; the mean positive puncta per cell rates in the control and experimental groups were 10.5 ± 1.25% and 16.8 ± 3.45%, respectively (p < .05) (). The western blotting results indicated that the LC3 II/I ratio was higher for the tumors in the 17-AAG group than for the tumors in the DMSO group; the relative expression levels in the DMSO and 17-AAG groups were 0.923 ± 0.18 and 2.902 ± 0.78, respectively (p < .05) (). P62 expression was lower in the tumors in the 17-AAG group than in the tumors in the DMSO group; the relative expression levels in the DSOM and 17-AAG groups were 0.66 ± 0.18 and 0.45 ± 0.09, respectively (p < .05) ().
Figure 8. Autophagy expression in the DSMO group and the HSP90 inhibition group in the second stage.(A) LC3 immunofluorescence: LC3-EGFP puncta and DAPI nuclei staining are shown. (B) LC3 immunofluorescence Index. (C) LC3II/I protein expression. (D) LC3II/I protein relative expression level. (E) P62 protein expression. (F) P62 protein relative expression levels. Significant differences were calculated with respect to the DMSO group. *p < .05.
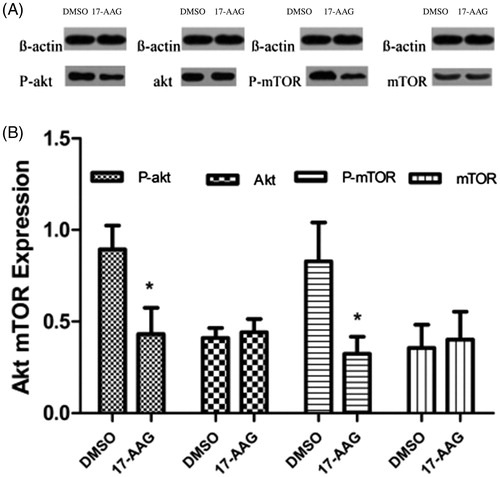
The gray scale value measurements of the western blotting bands suggested that the relative P-Akt expression levels in the DSOM and 17-AAG groups were 0.894 ± 0.131 and 0.432 ± 0.143, respectively (p < .05), whereas the relative Akt expression levels in the control group and experimental groups were 0.411 ± 0.055 and 0.442 ± 0.073, respectively (p > .05). The P-mTOR expression level was significantly lower in the 17-AAG group than in the DSMO group. The relative P-mTOR expression levels in the control and experimental groups were 0.829 ± 0.213 and 0.325 ± 0.092, respectively (p < .05), whereas the relative mTOR expression levels in the control and experimental groups were 0.357 ± 0.126 and 0.402 ± 0.152, respectively (p > .05) ().
Figure 9. (A) The western blotting bands of P-akt, akt, P-mTOR, and mTOR in the second stage. (B) P-akt, akt, P-mTOR, and mTOR expression levels in the DMSO and 17-AAG groups. Significant differences were calculated with respect to the DMSO group. *p < .05.
Discussion
Most thermal ablation studies have shown that residual disease remains at temperatures below 55 °C, which typically is the peripheral area of the ablation target. The pathological examination of this area confirmed that the cell death in this area was predominantly apoptotic, with scattered apoptosis observed in the tumor cells [Citation17–20]. Based on the above findings, most of the studies on residual after ablation focus on this area. The width of this area is only tens to hundreds of micrometers. Therefore, locating and collecting samples from the bulk specimens is difficult, and sufficient samples cannot be obtained to satisfy semi-quantitative molecular tests. Generally, only immunohistochemistry examinations can be performed for this area [Citation12,21]. In this study, an optical fiber with a diameter of only 300 μm was used on the Huh7 xenograft in nude mice. The power is adjustable to 0.5 W with a minimum duration of 1 s; therefore, power and treatment time can be precisely controlled to create an incomplete ablation model. In our preliminary experiments in vitro and tumor models, the temperature changes in the range of 5–10 mm away from the optical fiber under different conditions were measured by thermo-needle. The necrosis and apoptosis of local zone were confirmed by pathological examination. The appropriate laser power used 1 W for 30 s was selected to induce apoptosis of the tumor tissue, without causing significant necrosis. The mice were sacrificed 18 h post ablation based on prior studies [Citation17–19] and our preliminary experiments, thus, providing sufficient conditions for the subsequent study, and cross comparison with other relevant studies.
Heat shock proteins are generally conservative in nature in that they prevent protein aggregation and facilitate refolding Autophagy results in protein and whole organelles degradation. After thermal injury, there may be complex regulatory relationships between HSPs and autophagy. In this study, all three of the tested HSPs were expressed at low levels in the Huh7 HCC model, and the expression levels were significantly increased after the incomplete ablation. Pre-treatment with the HSP90 inhibitor promoted apoptosis, consistent with findings of prior similar studies [Citation22–29]. This is the first report describing down regulation of autophagy in Huh7 tumor tissues after incomplete ablation. Pre-treatment with the HSP90 inhibitor caused an increase in autophagy in this model. It is that suggested heat shock response plays a negative role in autophagy regulation.
With the HSP90 inhibitor, the lower expression of HSP90 is associated with a decrease in Akt and mTOR activity. It is suggested that the HSP90/Akt/mTOR pathway is involved in signal transmission between autophagy and HSPs. Considering the importance of this pathway, we hypothesized hsp90 via activating akt/mTOR in autophagy regulation.
In this model, an inverse correlation in expression was observed between heat shock proteins and autophagy, although the effect of increased autophagy on apoptosis is subject to further investigation.
Conclusion
In the incomplete ablation model, HSP expression was increased, and autophagy was decreased. After application of the HSP90 inhibitor 17-AAG, HSP90 expression was decreased, autophagy was increased, and apoptosis was further increased. These findings suggested that autophagy was decreased in the incomplete ablation model and showed an opposite trend to HSP expression, which provides ideas for further research.
Disclosure statement
No potential conflict of interest was reported by the authors.
Additional information
Funding
References
- Cho YK, Rhim H, Noh SIk. Radiofrequency ablation versus surgical resection as primary treatment of hepatocellular carcinoma meeting the Milan criteria: a systematic review. J Gastroenterol Hepatol. 2011;26:1360.
- Mulier S, Ni Y, Jamart J, et al. Local recurrence after hepatic radiofrequency coagulation: multivariate meta-analysis and review of contributing factors. Ann Surg. 2005;242:158–171.
- Medhat E, Abdel AA, Nabeel M, et al. Value of microwave ablation in treatment of large lesions of hepatocellular carcinoma. J Digestive Dis. 2015;16:456–463.
- Yu H, Burke C. Comparison of percutaneous ablation technologies in the treatment of malignant liver tumors. Semin Intervent Radiol. 2014; 31:129–137.
- Wkc P, Awp M, Frank VE, et al. The in vivo performance of a novel thermal accelerant agent used for augmentation of microwave energy delivery within biologic tissues during image-guided thermal ablation: a porcine study. Int J Hyperthermia. 2017;34:1–8.
- Schueller G, Kettenbach J, Sedivy R, et al. Heat shock protein expression induced by percutaneous radiofrequency ablation of hepatocellular carcinoma in vivo. Int J Oncol. 2004;24:609.
- Hinz S, Tepel J, Röder C, et al. Profile of serum factors and disseminated tumor cells before and after radiofrequency ablation compared to resection of colorectal liver metastases – a pilot study. Anticancer Res. 2015;35:2961.
- Rai R, Richardson C, Flecknell P, et al. Study of apoptosis and heat shock protein (HSP) expression in hepatocytes following radiofrequency ablation (RFA). J Surg Res. 2005;129:147–151.
- Nikfarjam M, Muralidharan V, Su K, et al. Patterns of heat shock protein (HSP70) expression and Kupffer cell activity following thermal ablation of liver and colorectal liver metastases. Int J Hyperthermia. 2005;21:319–332.
- Yang WL, Nair DG, Makizumi R, et al. Heat shock protein 70 is induced in mouse human colon tumor xenografts after sublethal radiofrequency ablation. Ann Surg Oncol. 2004;11:399–406.
- O’Connell-Rodwell CE, Mackanos MA, Simanovskii D, et al. In vivo analysis of heat-shock-protein-70 induction following pulsed laser irradiation in a transgenic reporter mouse. J Biomed Opt. 2008;13:030501.
- Yang W, Ahmed M, Tasawwar B, et al. Radiofrequency ablation combined with liposomal quercetin to increase tumour destruction by modulation of heat shock protein production in a small animal model. Int J Hyperthermia. 2011;27:527–538.
- Schueller G, Kettenbach J, Sedivy R, et al. Expression of heat shock proteins in human hepatocellular carcinoma after radiofrequency ablation in an animal model. Oncol Rep. 2004;12:495–499.
- Zhang R, Luo D, Miao R, et al. Hsp90-Akt phosphorylates ASK1 and inhibits ASK1-mediated apoptosis. Oncogene. 2005;24:3954–3963.
- Sato S, Fujita N, Tsuruo T. Modulation of Akt kinase activity by binding to Hsp90. Proc Natl Acad Sci USA. 2000;97:10832–10837.
- Oral O, Akkoc Y, Bayraktar O, et al. Physiological and pathological significance of the molecular cross-talk between autophagy and apoptosis. Histol Histopathol. 2014;31:479–498.
- Wust P, Hildebrandt B, Sreenivasa G, et al. Hyperthermia in combined treatment of cancer. Lancet Oncol. 2002;3:487–497.
- Krysko DV, Vandenabeele P. Clearance of dead cells: mechanisms, immune responses and implication in the development of diseases. Apoptosis. 2010;15:995–997.
- Obara K, Matsumoto N, Okamoto M, et al. Insufficient radiofrequency ablation therapy may induce further malignant transformation of hepatocellular carcinoma. Hepatol Int. 2008;2:116–123.
- Cheng J, Lv Z, Weng X, et al. Hsp27 acts as a master molecular chaperone and plays an essential role in hepatocellular carcinoma progression. Digestion. 2015;92:192.
- Goldberg SN, Kruskal JB, Oliver BS, et al. Percutaneous tumor ablation: increased coagulation by combining radio-frequency ablation and ethanol instillation in a rat breast tumor model. Radiology. 2000;217:827–831.
- Graner AN, Hellwinkel JE, Lencioni AM, et al. HSP90 inhibitors in the context of heat shock and the unfolded protein response: effects on a primary canine pulmonary adenocarcinoma cell line. Int J Hyperthermia. 2017;33:303–317.
- Stankiewicz AR, Lachapelle G, Foo CP, et al. Hsp70 inhibits heat-induced apoptosis upstream of mitochondria by preventing Bax translocation. J Biol Chem. 2005;280:38729–38739.
- Leng AM, Liu T, Yang J, et al. The apoptotic effect and associated signalling of HSP90 inhibitor 17-DMAG in hepatocellular carcinoma cells. Cell Biol Int. 2012;36:893.
- Nowakowski GS, Mccollum AK, Ames MM, et al. A phase I trial of twice-weekly 17-allylamino-demethoxy-geldanamycin in patients with advanced cancer. Clin Cancer Res. 2006;12:6087.
- Chen Y, Youn P, Pysher TJ, et al. Tumour eradication using synchronous thermal ablation and Hsp90 chemotherapy with protein engineered triblock biopolymer-geldanamycin conjugates. Int J Hyperthermia. 2014;30:550.
- Minet E, Mottet D, Michel G, et al. Hypoxia-induced activation of HIF-1: role of HIF-1alpha-Hsp90 interaction. FEBS Lett. 1999;460:251–256.
- Eschricht S, Jarr KU, Kuhn C, et al. Heat-shock-protein 90 protects from downregulation of HIF-1α in calcineurin-induced myocardial hypertrophy. J Mol Cell Cardiol. 2015;85:117–126.
- Liu X, Chen S, Tu J, et al. HSP90 inhibits apoptosis and promotes growth by regulating HIF-1α abundance in hepatocellular carcinoma. Int J Mol Med. 2016;37:825.