
 ?Mathematical formulae have been encoded as MathML and are displayed in this HTML version using MathJax in order to improve their display. Uncheck the box to turn MathJax off. This feature requires Javascript. Click on a formula to zoom.
Abstract
Focal thermal therapy (Heat), cryosurgery (Cryo) and irreversible electroporation (IRE) are increasingly used to treat cancer. However, local recurrence and systemic spread are persistent negative outcomes. Nevertheless, emerging work with immunotherapies (i.e., checkpoint blockade or dendritic cell (DC) vaccination) in concert with focal therapies may improve outcomes. To understand the role of focal therapy in priming the immune system for immunotherapy, an in vitro model of T cell response after exposure to B16 melanoma cell lysates after lethal exposures was designed. Exposure included: Heat (50 °C, 30 min), Cryo (−80 °C, 30 min) and IRE (1250 V/cm, 99 pulses, 50 µs pulses with 1 Hz intervals). After viability assessment (CCK-8 assay), cell lysates were collected and assessed for protein release (BCA assay), protein denaturation (FTIR-spectroscopy), TRP-2 antigen release (western blot), and T cell activation (antigen-specific CD8 T cell proliferation). Results showed IRE released the most protein and antigen (TRP-2), followed by Cryo and Heat. In contrast, Cryo released the most native (not denatured) protein, compared to IRE and Heat. Finally, IRE dramatically outperformed both Cryo and Heat in T cell activation while Cryo modestly outperformed Heat. This study demonstrates that despite all focal therapies ability to destroy cells, the ‘quantity’ (i.e., amount) and ‘quality’ (i.e., molecular state) of tumor protein (including antigen) released can dramatically change the ensuing priming of the immune system. This suggests protein-based metrics whereby focal therapies can be designed to prime the immune system in concert with immunotherapies to eventually achieve improved and durable cancer treatment in vivo.
Introduction
Energy-based therapies including thermal therapy (Heat), cryosurgery (Cryo) and irreversible electroporation (IRE) for cancer are increasingly used as an alternative to surgical resection or radiotherapy due in part to their minimally invasive and focal nature [Citation1–3]. Despite increased use, focal therapies can fail to completely destroy cancer [Citation4,Citation5], resulting in local [Citation6] and/or systemic recurrence or spread [Citation7]. To address these shortcomings investigators have studied the mechanism of action at the molecular and cellular level to improve local cancer destruction by thermal therapy (Heat) [Citation8], cryotherapy (Cryo) [Citation9] and IRE [Citation10,Citation11]. Further studies have shown the ability to physically enhance these destructive mechanisms [Citation12,Citation13] and/or combine them to achieve synergistic destruction of local cancer [Citation14,Citation15]. While these studies have dramatically improved our physical understanding of local cancer destruction by focal therapies, clinical studies continue to show cancer recurrence as a persistent problem in melanoma [Citation16], prostate [Citation17], liver [Citation18], pancreas [Citation19] and kidney [Citation18].
To address this problem, there is a growing effort to engage the immune system in combination with focal therapies [Citation20–23]. Indeed, antitumor immune responses after combinatorial focal therapy and immune adjuvants including tumor necrosis factor (TNF) [Citation24], interleukin-2(IL-2) [Citation25], granulocyte-macrophage-colony-stimulating factor (GM-CSF) [Citation26], toll-like receptor (TLR) agonists [Citation27], and sclerosing agent (OK-432) [Citation28] have shown benefit for local cancer control. Further approaches using immune cell adjuvants such as dendritic cell (DCs) injection have also shown promise when combined with focal therapy for both local and systemic cancer [Citation29]. Finally, recent developments using immune checkpoint blockades (e.g., anti-CTLA-4, anti-PD-1) in concert with focal therapy, especially Cryo, have shown durable tumor-specific immune responses [Citation30,Citation31], even stimulating several clinical trials for melanoma [Citation32], prostate [Citation33], breast [Citation34] and liver cancer [Citation35].
While these examples suggest that focal therapies can engage the immune system to improve cancer destruction, the underlying mechanism by which focal therapy promotes priming of the immune system remains largely unclear. Because tumor infiltration with CD8 T cells has been positively associated with improved prognosis [Citation36], we have focused on identifying focal therapies associated with enhanced CD8 T cell priming. Several events are required for effective T cell priming including: (i) release of endogenous antigens from cancer cells, (ii) release of ‘danger signals’ from the distressed cells (iii) processing of cancer antigens, (iv) antigen presentation by dendritic cells to naïve T cells, and (v) activation and proliferation of cancer-specific cytotoxic T cells [Citation37–40]. In this model, CD8 T cell priming relies on effective antigen presentation and a central question is how focal therapy can aid in this process [Citation41,Citation42]. In the present study, we sought to test the hypothesis that the ‘quantity’ (i.e., amount) and ‘quality’ (i.e., physiochemical conditions) of tumor protein (including specific antigens) released from cancer cells during focal treatment will determine the priming of the immune system against cancer.
To test this hypothesis, we used B16-F10 cells (B16), a well-studied murine melanoma cell line [Citation43–45], to assess the ability of focal therapy to kill cancer cells, release protein and antigen, and activate tumor antigen-specific CD8 T cells. First, the selected focal therapies including Heat, Cryo and IRE were applied to the B16 cancer cells and shown to physically destroy the cells by metabolic colorimetric assay. Then, the ‘quantity’ of protein release into the lysate following a therapy was measured by Bicinchoninic Acid (BCA) assay. Further, the ‘quality’ of the released protein was measured as a ratio of native to denatured protein content by Fourier Transform Infrared (FTIR) spectroscopy. Additionally, the lysates were assessed for a known B16 antigen, tyrosinase-related protein 2 (TRP-2), by western blot. Finally, the same lysates were incubated with antigen presenting cells (APCs) and TRP-2 specific CD8 T cells, and the proliferative capacity of these TRP-2 specific T cells was used as a measure of immune priming in response to the various focal therapies.
Materials and methods
Cell culture and treatments
B16-F10 (B16) melanoma cells were obtained and cultured according to ATCC. Briefly, cells were cultured in Dulbecco’s Modified Eagle Medium (DMEM, Gibco) supplemented with 10% Fetal Bovine Serum (FBS, Gibco), L-Glutamine (Gibco) and Penicillin-Streptomycin (Gibco), incubated in tissue-culture treated plastic flasks at 37°C with 5% CO2 and split every 2–3 days using Trypsin-EDTA (0.05% and 0.53 mM, Gibco).
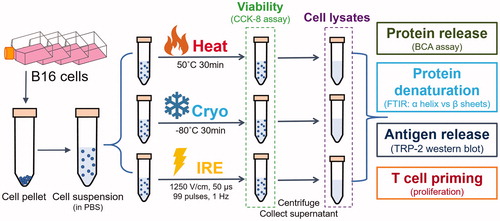
For in vitro treatment and assessments as shown (), cells were grown to 85–95% confluence and detached as above, centrifuged (200 g for 10 min), washed twice in phosphate buffered saline (PBS, pH = 7.4) and resuspended to a density of 1.5 × 10⁷ cells/ml. The sample was then held at room temperature (23 °C, 5–10 min) prior to focal therapy exposure. For Heat, tubes were heated in a water bath at 50 °C for 30 min before passively cooling to room temperature. For Cryo, the tubes were frozen to −80 °C in a methanol bath (equilibrated in −80 °C freezer) for 30 min then thawed at room temperature. For IRE treatment, 750 µL of the prepared cell suspension was pipetted into an electroporation cuvette (FB104, Fisher Scientific, Pittsburgh, PA) between the two plate electrodes (4 mm apart). The cuvette was then placed in an external electric field (1250 V/cm, voltage/distance between electrodes) created by an electric pulse generator (BTX ECM 830, Harvard apparatus, Holliston, MA). Then 99 pulses with pulse duration of 50 µs and pulse interval 1000 ms (i.e., pulse frequency of 1 Hz) were applied. The control condition for cell lysis (LN2 cycling) involved placing cells in a 1.5 ml microcentrifuge tubes (Quality Scientific Plastics, Portsmouth, NH) and employing two cycles of freezing in LN2 followed by passive thaw to room temperature. Following all treatments, the cell suspension sample was immediately subjected to low-speed centrifugation (200 g for 10 min) to remove dense debris (about 20% of the total volume at the bottom of tubes). The cell lysate was defined as the supernatant from the spin, and was collected, aliquoted, and stored at −80 °C for further analysis.
Figure 1 Schematic of in vitro cell treatments and assessments. B16 cell suspensions were generated and treated by Heat, Cryo and IRE, respectively. Viabilities were measured immediately after the treatment. The lysates from treated cells were collected and were assessed for protein release, protein denaturation, antigen release, and T cell priming.
Viability measurement
Viability measurement was modified from the technical manual of Cell Counting Kit-8 (CCK-8) assay (Dojindo Molecular Technologies, Kumamoto, Japan). Immediately following the treatments but before centrifugation, 100 µL aliquots of the cell suspensions from each treatment were mixed with 100 µL complete cell culture medium and 10 µL of CCK-8 solution in a flat-bottomed 96-well plate and incubated for 4 h at 37 °C with 5% CO2. The optical absorption of the sample was then measured at 450 nm in a spectrophotometer (Synergy, BioTek, Winooski, VT). The viabilities from each treatment group were compared to untreated cells suspension (negative control with 100% viability) and the LN2-cycling treatment group containing only dead cells (positive control with 0% viability).
Protein release measurement
The protein release measurement was modified from the cellular protein loss measurement described in [Citation11]. In this study, we define protein release as the content of protein within the lysate, i.e., released from the cells after exposure to the focal therapy conditions and the gentle 200 g 10 min spin. Protein was then quantified using Bicinchoninic Acid (BCA, Thermo Fisher Scientific, Waltham, MA) assay and a spectrophotometer (Synergy, BioTek) measuring absorbance at 562 nm according to the protocol from the manufacturer. Bovine serum albumin (Thermo Fisher Scientific) at known concentrations was used to create a calibration line for the assay.
Protein denaturation measurement
B16 cells were suspended in D2O (Cambridge Isotope Laboratories, Tewksbury, MA) in a 1 × PBS solution prepared by dissolving PBS tablets (Sigma Aldrich) to ensure the strong absorbance of H2O did not overlap the amide - I (1600–1700 cm−1) band [Citation46]. Infrared absorbance spectra of treated cell lysates were collected on an attenuated total reflection (ATR) accessory (ConcentratIR2, Harrick Scientific, Pleasantville, NY) connected to a Fourier Transform Infrared (FTIR) spectrometer (Nicolet iS50, Thermo Scientific, Waltham, MA). Omnic 9.2 software (Thermo Fisher Scientific, Waltham, MA) was used to fit 1600–1700 cm−1 region of the spectra with Gaussian peaks [Citation47] corresponding to absorption bands of prominent protein secondary structures including alpha-helix (1642–1660 cm−1), beta sheet (1615–1638 and 1672–1694 cm−1) and turn (1653–1691 cm−1) [Citation48]. Relative amount of beta sheet in a sample was calculated as follows:
(1)
(1)
Where = Relative amount of beta sheet structure in sample.
= Area of beta sheet peak.
= Area of alpha helix peak.
= Area of turn and random structure peaks. Finally, fractional denaturation (FD) of the sample was calculated as previously described [Citation49] from relative amounts of beta sheet in samples as follows:
(2)
(2)
Where, FD = fractional denaturation, = Beta sheet in untreated samples lysed with LN2.
= Beta sheet in treated samples heated up to 90 °C for 10 min (for complete denaturation [Citation49]). More information of FTIR sample preparation, measurement and postprocessing can be found in supplemental materials.
Antigen assessment by western blot
The relative concentrations of TRP-2 antigen in the lysates were assessed by a modified western blotting method. The same volume of lysate from each condition was used to quantify the binding of TRP-2 antibody. Reduced sample buffer was prepared by mixing 900 µL of 4× Laemmli protein sample buffer (Bio-Rad, Hercules, CA) with 100 µL of β-mercaptoethanol (Sigma-Aldrich, St. Louis, MO), and lysate samples were then diluted 3:1 in reduced sample buffer, followed by 5-min incubation at 97 °C using a Thermal Cycler C1000 (Bio-Rad). 15 µL of each sample was loaded into a 4–15% Mini-Protean 12-well gel (Bio-Rad) for separation, followed by transfer to a polyvinylidene difluoride (PVDF) membrane (Bio-Rad). Membranes were blocked in Tris-buffered saline containing Tween-20 (TBS-T; Sigma-Aldrich) and 5% nonfat dry milk (Bio-Rad) for 1 h at room temperature. After blocking, the membrane was incubated with horseradish peroxidase (HRP)-conjugated β-actin (13E5, 1:2000 dilution, Cell Signaling Technology) or rabbit anti-mouse TRP-2 antibody (1:1000 dilution, Thermo Fisher Scientific) in TBS-T with 5% milk for 2 h at room temperature. For TRP-2 blots, the membranes were then incubated with donkey anti-rabbit HRP-conjugated secondary antibody (1:6000, GE Healthcare) in TBS-T with 5% milk for 1 h at room temperature. Protein expression was detected using SuperSignal West Pico Chemiluminescent substrate (Thermo Fisher Scientific) and a ChemiDoc Touch Imaging System (Bio-Rad). Western Blot postprocessing can be found in supplemental materials.
Experimental mice
All procedures performed on mice were approved by the University of Minnesota Institutional Animal Care and Use Committee. Bone marrow for dendritic cell cultures was isolated from C57BL/6J mice, purchased from The Jackson Laboratory (Bar Harbor, ME). Transgenic 24H9 mice on the C57BL/6J background where the majority of CD8 T cells bear a genetically encoded high-affinity receptor against the TRP-2 tumor antigen from B16 tumor cells were obtained from A. Hurwitz [Citation50,Citation51] and were used as a source of antigen-specific T cells (TRP-2 T cells) for in vitro T cell activation analysis. Mice for all experiments were between 8 and 14 weeks of age.
T cell activation assay
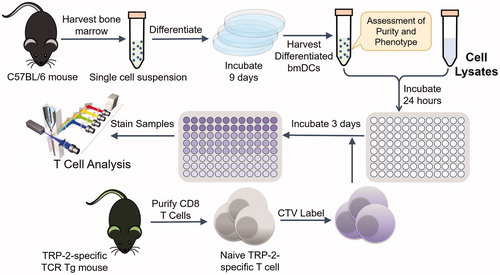
The workflow for assessing TRP-2-specific T cell activation by bone marrow-derived dendritic cells (bmDCs) following incubation with tumor cell lysates is illustrated in . Briefly, bone marrow was isolated by flushing the femurs of C57BL/6 mice (Jackson Laboratory) with T cell proliferation media (TCPM, which consists of RPMI 1640, 10% fetal bovine serum (v/v), 1% Penicillin/Streptomycin, 1 mM L-Glutamine, 10 mM HEPES, 1 mM sodium pyruvate, 1× nonessential amino acids, and 0.5 × 2-Mercaptoethanol). Bone marrow cells were then incubated on non-tissue culture treated plastic plates at 2.0 × 10⁶ cells/ml in TCPM in the presence of 100 ng/ml FMS-like tyrosine kinase 3 ligand (Flt3L) for 9 days to promote differentiation and expansion of DCs capable of promoting in vitro antigen-processing and presentation [Citation52]. The resulting Flt3L-induced DCs (Flt3L-DC) were at least 90% CD11c + as determined by flow cytometry. Flt3L-DCs were released using cold 3 mM EDTA, washed, and incubated overnight at 37 °C in TPCM with 100 ng/ml TRP-2 peptide (SVYDFFVWL, <85% purity by HPLC, New England Peptide) or with B16 derived lysates generated as described above, to allow time for antigen processing and presentation.
Figure 2 Experimental workflow of the in vitro T cell assay. Antigen-presenting cells were harvested and differentiated from C57BL/6 mice and then incubated with cell lysates after Cryo, Heat and IRE treatments. CTV labeled naïve T cells that are reactive to TRP-2 (a B16 antigen) were added to the assay and their phenotype and growth (proliferation) were quantified by flow cytometry. TCR Tg, T-cell receptor transgenic.
Naïve TRP-2 specific T cells were isolated by negative selection from spleen and lymph nodes of 24H9 mice using a CD8 T cell isolation kit (EasySep, STEMCELL Technologies, Vancouver, Canada), according to the manufacturer’s instructions, and were at least 95% CD8+Thy1.1+ based on flow cytometry analysis. The purified TRP-2 T cells were labeled with 5 μM CellTrace Violet (CTV) in 10% FBS for 15 min at 37 °C as previously described [Citation53] prior to incubation with DCs. 1.5 × 10⁵ lysate-loaded DCs and 5 × 10⁴ CTV labeled T cells were combined in 96-well tissue culture treated flat bottom plates in the presence of TCPM [Citation54]. After 72 h, T cells were collected from the plates into ice-cold FACS buffer (HBSS containing 2% calf serum and 0.1% sodium azide) by pipetting and stained for 30 min on ice with fluorescently conjugated antibodies. T cell proliferation was assessed using flow cytometry by defining the fraction of TRP-2 T cells (CD8+Thy1.1+) with diluted CTV, using an LSRII or Fortessa digital flow cytometer (BD Biosciences) and FlowJo software (TreeStar, Ashland, OR). T cells assayed in the presence of DCs pre-incubated with 100 μg/ml of the purified TRP-2 peptide or with no lysate were used as positive and negative controls, respectively. Cell lysates generated by repetitive thermal cycling between room temperature and liquid nitrogen (LN2) were used as a reference point for focal therapy condition lysates.
Statistical analysis
Three batches (biological replicates) of B16 cells were independently used for all above-mentioned assessments and assays. For each biological replicate, averages were taken from at least 2 technical replicates. Mean and variance of each condition were calculated on averages of all biological replicates. t-tests (two-sample assuming unequal variances) were performed on two experimental groups where one-tail p values were taken to delineate statistical significance. Single-factor ANOVA tests were performed among observations from more than 2 groups. p values less than .05 is considered to be statistically significant.
Results
Cell response to focal therapies
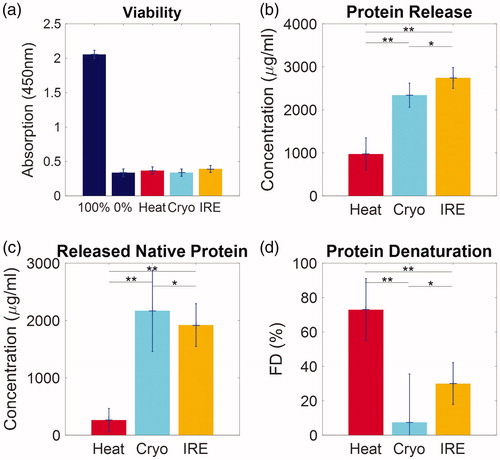
The in vitro response of B16 cells to focal therapeutic conditions are summarized in . Cell viabilities as measured by colorimetric viability assay (CCK-8) were compared to a positive (100% viability) and negative control (0% viability). All focal therapy exposures reduced the optical absorption to that of the negative control. Lysates collected from all conditions were measured for both protein content by BCA assay and denaturation by FTIR. The protein release was greatest after IRE exposure (2741 ± 243 μg/ml) followed closely by Cryo (2341 ± 281 μg/ml) and more distantly by Heat (973 ± 377 μg/ml). The extent of the denaturation of the released protein is distinctively different: Heat caused the highest FD (72.9 ± 18.1%), followed by IRE (30.0 ± 12.2%) with the least measured from Cryo (7.35 ± 28.2%). Released native protein is thus calculated as total release protein×(1-FD), while the release denatured protein as total release protein × FD. Cryo and IRE achieved comparable native protein release (2169 ± 710 μg/ml and 1918 ± 377 μg/ml), which was substantially higher than that of Heat (263 ± 204 μg/ml). In contrast, Heat and IRE both released considerably higher amounts of denatured protein (709 ± 327 μg/ml and 823 ± 341 μg/ml) than that of Cryo (172 ± 660 μg/ml).
Figure 3 Characterization of cell response after Heat, Cryo and IRE. (a) All 3 focal modalities cause complete cell death. (b) Comparison of the total amount of protein release from the cells into lysates. (c) Comparison of the amount of released native (not denatured) protein from all treatment conditions. (d) Fractional denaturation (FD) of protein in lysates. Data are shown as average ± standard deviation. NS: not significant, *p < .05, **p < .01.
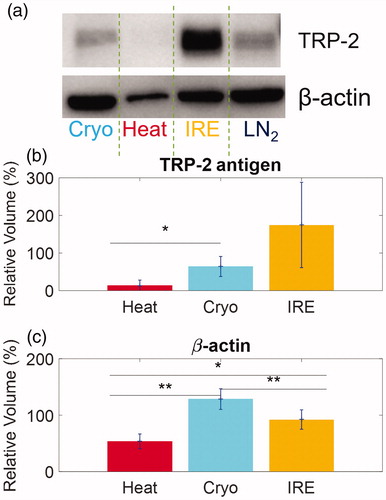
To measure the relative antigen content within the total amount of released protein, both TRP-2 antigen and β-actin (control protein) were measured in the lysates as shown in . The western blot from a representative case is shown in . Further analysis of three replicates allows a quantitative comparison of relative TRP-2 antigen release between focal therapies which is described in the supplemental materials. For instance, shows that IRE causes the most TRP-2 release (174.5 ± 113.4%), followed by Cryo (64.2 ± 26.6%) and Heat (13.8 ± 14.2%) compared to LN2 control. Interestingly, in , Cryo alone results in the most β-actin release (128.5 ± 18.3%), followed by IRE (92.2 ± 17.2%) and Heat (53.5 ± 13.1%) compared again to LN2 control. These results show that there is a substantial difference in the composition of protein release and antigen release among the focal therapeutic conditions tested.
Figure 4 Quantification of antigen release by different focal therapies by Western blots. (a) A representative Western Blot image showing TRP-2 and β-actin release from B16 cells after focal therapy and control LN2 exposure. (b) Comparison of the normalized intensities of TRP-2 antigen from differently treated cell lysates from Heat, Cryo and IRE. (c) Comparison of the normalized intensities of β-actin. Data are shown in average ± standard deviation. *p < .05, **p < .01.
T cell priming comparison
We next used a T cell assay that allowed us to quantify the extent of T cell priming that can be traced to tumor antigen release from B16 cells and presentation by dendritic cells. The response of TRP-2-specific CD8 T cells after co-culture with bmDCs pre-pulsed with either TRP-2 peptide (control) or B16 cell lysates is shown in . Here, the naïve T cells are labeled with CTV, a cell proliferation dye. In this assay, non-responding or naïve T cells remain high for CTV while actively proliferating T cells dilute the CTV stain. The extent of T cell proliferation, therefore, relates directly to the percentage of cells with reduced CTV intensity (CTV low) and is defined as the proliferation index.
Figure 5 T cell activation after exposure to B16 cell lysates after focal therapy condition exposure. (a) The distribution of CTV intensity of CD8 + Vb7 + Thy1.1+ gated cells from a single representative T cell assay (one technical replicate). The number in each box indicates the percentage of CTV low as proliferation index. Ag: antigen. (b) The proliferation index of PBS (no antigen), 0.1 μg/ml TRP-2 peptide and LN2 cycling from all 3 biological replicates. (c) The relative proliferation index of Heat, Cryo and IRE at 1.2 × 10⁵ cell equivalents from all 3 biological replicates. Data are shown in average ± standard error.
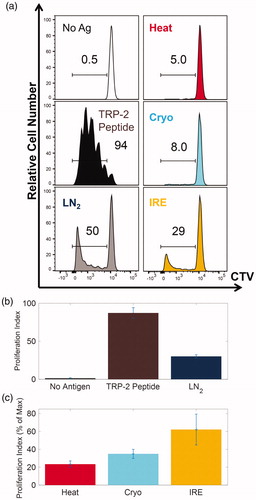
The distributions of CTV intensity of CD8+Thy1.1+ gated T cells under different conditions from a representative sample are shown in . In the absence of antigen, the T cells fail to proliferate (0.5%). In the presence of TRP-2 peptide nearly all of the TRP-2-specific T cells are primed (proliferation index 94%, . The proliferation index defined as above has a positive correlation with the concentration of TRP-2 peptide ranging between 10 pg/ml and 100 ng/ml (data not shown). We next assessed proliferation indexes across a titration of cell lysates from each focal therapeutic condition. The maximum proliferation index from the B16 cell lysates (50%) was achieved from the LN2 freeze-thaw cycling condition at 1.2 × 10⁵ cell equivalents, followed by IRE (29%), Cryo (8.0%) and Heat (5.0%). On average of all biological replicates, LN2 freeze-thaw cycling has a proliferation index of 30.2 ± 2.1% as shown in , compared to that of 87.2 ± 2.0% of 100 ng/ml of TRP-2 peptide and 1.36 ± 0.53% of PBS.
To further appreciate these results, they are plotted in terms of relative proliferation index. For each technical replicate, the relative proliferation is defined between that of Max (LN2 freeze-thaw cycling) and Min (no antigen). More specifically the relative proliferation index of a specific sample is calculated as a percent of Max proliferation for the cell lysate within the same technical replicate. This is shown after combining all 3 biological replicates at 1.2 × 10⁵ cell equivalent in . Here, IRE is shown to achieve the highest percent relative proliferation index of 62.1 ± 17.3%, followed by Cryo at 34.9 ± 5.1% and Heat at 23.4 ± 3.6%.
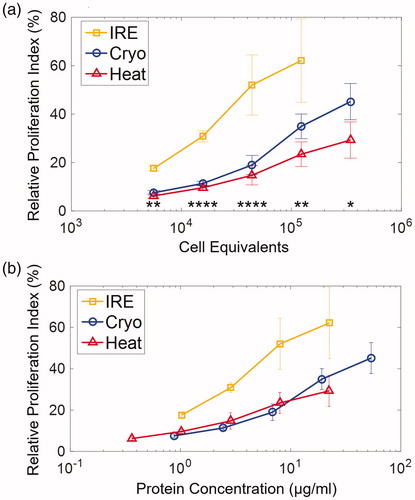
The relative proliferation index was compared by diluting the B16 derived cell lysates to represent a range of B16 cell equivalents and protein concentrations, as shown in . At higher numbers of cell equivalents, there is a consistent trend of increased T cell proliferation for all focal therapeutic conditions, as shown in . However, of the focal therapies IRE promoted a substantially higher T cell proliferation index than Cryo or Heat over the same cell equivalent range (5.6 × 10³–1.2 × 10⁵ cells). Further, Cryo modestly outperformed Heat at higher cell equivalents. The paired comparisons among Heat, Cryo and IRE are listed in Table S1. Using the protein release measurements from the BCA assay (), we were able to plot relative proliferation index against protein concentration. Higher concentrations of total protein led to higher T cell proliferation across all focal therapies. However, given the same concentration of protein, IRE clearly outperformed Heat and Cryo. Finally, when adjusted for protein concentration, Cryo and Heat promote similar levels of proliferation. Similarly, T cell activation was quantified by the upregulation of CD44 of the TRP-2-specific T cells, which are described in Supplementary Figure 2S and 3S. Statistic comparisons T cell activation among the 3 focal therapy conditions were listed in Table S2.
Figure 6 The relative proliferation indexes of TRP-2 T cells were at quantified at various (a) cell equivalents and (b) protein concentration. Protein concentration was determined using BCA assay. Data are shown in average ± standard error. *p < .05, **p < .01, ***p < .001, ****p < .0001. Significance was determined using a single factor ANOVA test. T-tests for paired comparison are listed in Table S1.
Discussion
In this study of cancer-associated adaptive immune response, the release of both antigens and ‘danger signal’ (or damage-associated molecular pattern molecules, DAMPs [Citation55]) can be controlled by the type of focal therapeutic conditions used to destroy the cancer cells. Antigens dictate the generation of antigen-specific T cells while the ‘danger signal’ modulates the antigen processing and presentation of the APCs and the priming and activation of T cells. We further show that these differences can be exploited to promote enhanced CD8 T cell activation, as summarized in . This study demonstrates that while all focal therapies can cause cell death, the ‘quantity’ (i.e., amount) and ‘quality’ (i.e., physiochemical conditions) of protein released from cancer cells and the ensuing priming of the immune system can differ dramatically. In general, more cells will proportionally release a larger quantity of protein and specific antigen for a specific focal therapeutic condition. Our data also support the concept that greater protein and antigen availability favors increased antigen-specific T cell activation and proliferation. However, when the T cell proliferation response was normalized to protein quantity in the lysate for specific focal therapeutic conditions, clear differences in T cell response were noted, which favored IRE over Cryo and Heat. For instance, while the presence of protein in the lysate is required, there are vastly different T cell responses from each focal therapeutic condition for a given amount of protein. This then suggests a further ‘quality’ of the protein in the lysates is necessary to promote T cell response. To prove this concept of quality we further measured: (1) native vs. denatured state of released protein, (2) presence of known B16 antigen TRP-2 in the lysate.
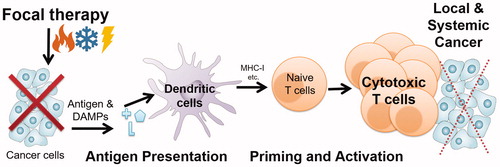
Figure 7 Generation of a cytotoxic T cell response against a tumor is essential for immune-mediated control of cancer. CD8 T cells that have been appropriately activated by tumor antigens are able to destroy local and systemic cancer that was not removed by, or was inaccessible to, the initial focal therapy. Initial focal therapy treatment leads to a significant release of tumor antigens that can be processed by dendritic cells and presented to naïve T cells through MHC class I molecules. Focal therapeutic conditions also cause cells to release damage-associated molecular pattern molecules (DAMPs) or ‘danger signals’ that modulate the adaptive immune response. Once tumor antigen-specific T cells have activated, proliferated and migrated into the circulatory system as cytotoxic T lymphocytes (CTLs), they have shown the promising ability to destroy both local cancer and to protect from distant metastatic cancer.
Cancer cell protein release after exposure to different focal therapeutic conditions is dramatically different, as summarized in . In the case of Heat, very little protein is released compared to Cryo and IRE (), and it is almost completely denatured as would be expected in a lethal heat exposure above 50 °C [Citation11]. In contrast, Cryo at −80 °C releases large quantities of protein, but denatures very little presumably due to membrane rupture [Citation11]. Finally, IRE releases large amounts of protein due to membrane rupture [Citation11]. However, unlike Cryo, IRE shows a large amount of denaturation of the released protein likely caused by the interaction of the high electric field with the charged amino acid residues of proteins and with solvent molecules [Citation10]. This observation may have important implications in immune response as a modification of the secondary structure of a protein, such as through denaturation, can have a large impact on antigen processing and presentation by APCs [Citation56].
Table 1. Summary of cell response and T cell proliferation.
further summarizes the dramatically different T cell response to protein release from the different focal therapy lysates with IRE clearly dominating Cryo and Heat. For instance, IRE releases 20% less protein than Cryo on a per cell basis, however IRE triggers as much as 2–3 times the T cell proliferation of Cryo. This may in part be due to the higher cancer antigen (TRP-2) measured in the IRE lysate vs. other therapies. However, there may be further aspects of protein denaturation, folding and aggregation that also play a role that was not assessed here [Citation57]. In addition, while Cryo does show enhanced T cell activation over Heat, it remains below IRE for the same cell equivalents treated. This advantage of cryosurgery overheat (i.e., radiofrequency and microwave) in stimulating an immune response appears consistent with the literature as reviewed in [Citation58]. Our results here show that Cryo (and IRE) release more protein and antigen than Heat and therefore suggest a mechanism at the cellular level for why Heat is less effective at mounting an immune response (). More specifically, Cryo and IRE are able to release proteins for APC and T cell access vs. Heat, which denatures proteins primarily within cells thereby denying immune cell access. Nevertheless, the importance of the ‘quality’ of the protein released remains an open question as IRE has the strongest T cell response despite having 40% denatured protein. Thus, future studies are needed to more fully explore protein (an antigen) amount, denaturation, and presentation for efficient T cell activation. Once this is known, focal therapeutic conditions can be designed to favor a protein release profile that can elicit the preferred T cell response for in vivo testing and translation.
While our platform is capable of providing essential information on key steps of priming T cells by focal therapy and its correlation to focal therapeutic conditions, we are fully aware that considerable work is still needed to bridge the gap between idealized in vitro and the more relevant in vivo situation. Further investigations that may help elucidate this important area include but are not limited to: (1) detailed profiling of the proteins (including other antigens and cytokines) and other molecules released from cancer cells during and after focal therapeutic conditions, (2) the solubility and/or aggregation of cellular contents and their transportation to APCs, (3) comparing antigen processing in the presence of ‘danger signals’ to APCs within the in vitro platform vs. in vivo treatment, (4) characterization of the maturation and activation of DCs, for example MHC II, CD40, CD80/86, IL12 release and (5) functionality and mobility of activated T cells, for example CD44, CD69, CD62, PD-1, and IFNγ release.
Finally, these results can be viewed within the light of exciting new opportunities in immunotherapy. For instance, activated CD8 T cells are critical mediators of anti-tumor immune response. Here we posit that differential antigen release from tumors through focal therapies can be used to optimize T cell activation in draining lymphatics. Further, there is a growing belief that energy-based focal therapies and immunotherapies can be synergistically combined [Citation59], as has already been implemented in the presence of immune checkpoint blockades [Citation30,Citation31]. There is growing evidence that CD8 T cell priming is a prerequisite for the successful implementation of immune checkpoint blockades [Citation39,Citation60–62]; we, therefore, propose that the engineering of the focal therapeutic condition, which optimizes CD8 T cell activation, is capable of greatly improving combinatorial focal therapy with immunotherapy including immune-checkpoint therapy.
Supplemental materials and Tables S1-S2
Download PDF (571.7 KB)Acknowledgements
We thank Jackson Raynor and Feng Liu for technical support.
Disclosure statement
No potential conflict of interest was reported by the authors.
Additional information
Funding
References
- Diederich CJ. Thermal ablation and high-temperature thermal therapy: overview of technology and clinical implementation. Int J Hyperther. 2005;21:745–753.
- Bai JF, Liu P, Xu LX. Recent advances in thermal treatment techniques and thermally induced immune responses against cancer. Ieee Trans Biomed Eng. 2014;61:1497–1505.
- Scheffer HJ, Nielsen K, de Jong MC, et al. Irreversible electroporation for nonthermal tumor ablation in the clinical setting: a systematic review of safety and efficacy. J Vasc Interv Radiol. 2014;25:997–1011.
- Ahmed M, Brace CL, Lee FT, et al. Principles of and advances in percutaneous ablation. Radiology. 2011;258:351–369.
- Paulet E, Aube C, Pessaux P, et al. Factors limiting complete tumor ablation by radiofrequency ablation. Cardiovasc Intervent Radiol. 2008;31:107–115.
- Chu KF, Dupuy DE. Thermal ablation of tumours: biological mechanisms and advances in therapy. Nat Rev Cancer. 2014;14:199–208.
- den Brok MH, Nierkens S, Wagenaars JA, et al. Saponin-based adjuvants create a highly effective anti-tumor vaccine when combined with in situ tumor destruction. Vaccine. 2012;30:737–744.
- Bhowmick P, Coad JE, Bhowmick S, et al. In vitro assessment of the efficacy of thermal therapy in human benign prostatic hyperplasia. Int J Hyperther. 2004;20:421–439.
- Baust JG, Gage AA. The molecular basis of cryosurgery. Bju Int. 2005;95:1187–1191.
- Jiang CL, Davalos RV, Bischof JC. A review of basic to clinical studies of irreversible electroporation therapy. Ieee Trans Biomed Eng. 2015;62:4–20.
- Liu F, Roy P, Shao Q, et al. The role of protein loss and denaturation in determining outcomes of heating, cryotherapy, and irreversible electroporation on Cardiomyocytes. J Biomech Eng-T Asme. 2018;140. doi:10.1115/1.4039375.
- Shao Q, Liu F, Chung C, et al. Physical and chemical enhancement of and adaptive resistance to irreversible electroporation of pancreatic cancer. Ann Biomed Eng. 2018;46:25–36.
- Shao Q, Burbach B, Ramadhyan S, et al. Cryosurgery with vascular and immune adjuvants to address local and systemic cancer. Cryobiology. 2016;73:414.
- Lugnani F, Macchioro M, Rubinsky B. Cryoelectrolysis-electrolytic processes in a frozen physiological saline medium. Peerj. 2017;5:e2810.
- Zhu J, Zhang Y, Zhang AL, et al. Cryo-thermal therapy elicits potent anti-tumor immunity by inducing extracellular Hsp70-dependent MDSC differentiation. Sci Rep. 2016;6:27136.
- Redondo P, del Olmo J, de Cerio ALD, et al. Imiquimod enhances the systemic immunity attained by local cryosurgery destruction of melanoma lesions. J Invest Dermatol. 2007;127:1673–1680.
- Lindner U, Trachtenberg J, Lawrentschuk N. Focal therapy in prostate cancer: modalities, findings and future considerations. Nat Rev Urol. 2010;7:562–571.
- Goldberg SN, Gazelle GS, Mueller PR. Thermal ablation therapy for focal malignancy: a unified approach to underlying principles, techniques, and diagnostic imaging guidance. Am J Roentgenol. 2000;174:323–331.
- Vincent A, Herman J, Schulick R, et al. Pancreatic cancer. Lancet. 2011;378:607–620.
- Zhang HG, Mehta K, Cohen P, et al. Hyperthermia on immune regulation: a temperature's story. Cancer Lett. 2008;271:191–204.
- Skitzki JJ, Repasky EA, Evans SS. Hyperthermia as an immunotherapy strategy for cancer. Curr Opin Invest Drugs. 2009;10:550–558.
- Sabel MS. Cryo-immunology: a review of the literature and proposed mechanisms for stimulatory versus suppressive immune responses. Cryobiology. 2009;58:1–11.
- Sabel MS, Su G, Griffith KA, et al. Rate of freeze alters the immunologic response after cryoablation of breast cancer. Ann Surg Oncol. 2010;17:1187–1193.
- Shenoi MM, Iltis I, Choi J, et al. Nanoparticle delivered vascular disrupting agents (vdas): use of tnf-alpha conjugated gold nanoparticles for multimodal cancer therapy. Mol Pharmaceutics. 2013;10:1683–1694.
- Johnson EE, Yamane BH, Buhtoiarov IN, et al. Radiofrequency ablation combined with ks-il2 immunocytokine (emd 273066) results in an enhanced antitumor effect against murine colon adenocarcinoma. Clin Cancer Res. 2009;15:4875–4884.
- Chen ZB, Shen SQ, Peng BG, et al. Intratumoural GM-CSF microspheres and CTLA-4 blockade enhance the antitumour immunity induced by thermal ablation in a subcutaneous murine hepatoma model. Int J Hyperther. 2009;25:374–382.
- den Brok M, Sutmuller RPM, Nierkens S, et al. Synergy between in situ cryoablation and TLR9 stimulation results in a highly effective in vivo dendritic cell vaccine. Cancer Res. 2006;66:7285–7292.
- Hamamoto S, Okuma T, Yamamoto A, et al. Radiofrequency ablation and immunostimulant ok-432: combination therapy enhances systemic antitumor immunity for treatment of vx2 lung tumors in rabbits. Radiology. 2013;267:405–413.
- Machlenkin A, Goldberger O, Tirosh B, et al. Combined dendritic cell cryotherapy of tumor induces systemic antimetastatic immunity. Clin Cancer Res. 2005;11:4955–4961.
- den Brok M, Sutmuller RPM, Nierkens S, et al. Efficient loading of dendritic cells following cryo and radiofrequency ablation in combination with immune modulation induces anti-tumour immunity. Br J Cancer. 2006;95:896–905.
- Waitz R, Solomon SB, Petre EN, et al. Potent induction of tumor immunity by combining tumor cryoablation with anti-CTLA-4 therapy. Cancer Res. 2012;72:430–439.
- ClinicalTrials.gov [Internet]. Dendritic Cell Therapy After Cryosurgery in Combination With Pembrolizumab in Treating Patients With Stage III-IV Melanoma That Cannot Be Remove by Surgery. 2018 [cited 2018 May 2]. Available from: https://clinicaltrials.gov/ct2/show/NCT03325101
- ClinicalTrials.gov [Internet]. Phase I Clinical Trial of Cryoimmunotherapy Against Prostate Cancer (CryoIT). 2018 [cited 2018 May 2]. Available from: https://clinicaltrials.gov/ct2/show/NCT02423928
- ClinicalTrials.gov [Internet]. A Study of Pre-Operative Treatment With Cryoablation and Immune Therapy in Early Stage Breast Cancer. 2018 [cited 2018 May 2]. Available from: https://clinicaltrials.gov/ct2/show/NCT02833233
- ClinicalTrials.gov. A Pilot Study of Combined Immune Checkpoint Inhibition in Combination With Ablative Therapies in Subjects With Hepatocellular Carcinoma (HCC) or Biliary Tract Carcinomas (BTC). Available from: https://clinicaltrials.gov/ct2/show/NCT02821754
- Gajewski TF, Woo SR, Zha YY, et al. Cancer immunotherapy strategies based on overcoming barriers within the tumor microenvironment. Curr Opin Immunol. 2013;25:268–276.
- Chen DS, Mellman I. Oncology meets immunology: the cancer-immunity cycle. Immunity. 2013;39:1–10.
- Mellman I, Coukos G, Dranoff G. Cancer immunotherapy comes of age. Nature. 2011;480:480–489.
- Silvestrini MT, Ingham ES, Mahakian LM, et al. Priming is key to effective incorporation of image-guided thermal ablation into immunotherapy protocols. Jci Insight. 2017;2:e90521.
- Mescher MF, Popescu FE, Gerner M, et al. Activation-induced non-responsiveness (anergy) limits CD8 T cell responses to tumors. Semin Cancer Biol. 2007;17:299–308.
- van den Bijgaart RJE, Eikelenboom DC, Hoogenboom M, et al. Thermal and mechanical high-intensity focused ultrasound: perspectives on tumor ablation, immune effects and combination strategies. Cancer Immunol Immunother. 2017;66:247–258.
- Kobayashi KS, van den Elsen PJ. NLRC5: a key regulator of MHC class I-dependent immune responses. Nat Rev Immunol. 2012;12:813–820.
- Curran MA, Montalvo W, Yagita H, et al. PD-1 and CTLA-4 combination blockade expands infiltrating T cells and reduces regulatory T and myeloid cells within B16 melanoma tumors. Proc Natl Acad Sci USA. 2010;107:4275–4280.
- Ya Z, Hailemichael Y, Overwijk W, et al. Mouse model for pre-clinical study of human cancer immunotherapy. Current protocols in immunology. Hoboken (NJ): John Wiley & Sons, Inc.; 2001.
- Ngiow SF, Loi S, Thomas D, et al. Mouse models of tumor immunotherapy. Tumor Immunol. 2016;130:1–24.
- Miller LM, Bourassa MW, Smith RJ. FTIR spectroscopic imaging of protein aggregation in living cells. Biochimica Et Biophysica Acta-Biomembranes. 2013;1828:2339–2346.
- Yang HY, Yang SN, Kong JL, et al. Obtaining information about protein secondary structures in aqueous solution using Fourier transform IR spectroscopy. Nat Protocols. 2015;10:382–396.
- Barth A. Infrared spectroscopy of proteins. Biochimica Et Biophysica Acta-Bioenergetics. 2007;1767:1073–1101.
- He XM, Wolkers WF, Crowe JH, et al. In situ thermal denaturation of proteins in dunning AT-1 prostate cancer cells: implication for hyperthermic cell injury. Ann Biomed Eng. 2004;32:1384–1398.
- Watkins SK, Zhu ZQ, Watkins KE, et al. Isolation of immune cells from primary tumors (Retracted article. See 2016). J Vis Exp. 2012;64:e3952.
- Zhu ZQ, Cuss SM, Singh V, et al. CD4(+) T cell help selectively enhances high-avidity tumor antigen-specific CD8(+) T cells. JI. 2015;195:3482–3489.
- Xu YK, Zhan YF, Lew AM, et al. Differential development of murine dendritic cells by GM-CSF versus flt3 ligand has implications for inflammation and trafficking. J Immunol. 2007;179:7577–7584.
- Mitchell JS, Burbach BJ, Srivastava R, et al. Multistage T cell-dendritic cell interactions control optimal CD4 T cell activation through the ADAP-SKAP55-signaling module. J Immunol. 2013;191:2372–2383.
- Fiege JK, Beura LK, Burbach BJ, et al. Adhesion- and degranulation-promoting adapter protein promotes CD8 T cell differentiation and resident memory formation and function during an acute infection. JI. 2016;197:2079–2089.
- Seong SY, Matzinger P. Hydrophobicity: an ancient damage-associated molecular pattern that initiates innate immune responses. Nat Rev Immunol. 2004;4:469–478.
- Dick LR, Aldrich C, Jameson SC, et al. Proteolytic processing of ovalbumin and beta-galactosidase by the proteasome to yield antigenic peptides. J Immunol. 1994;152:3884–3894.
- Michalek MT, Grant EP, Rock KL. Chemical denaturation and modification of ovalbumin alters its dependence on ubiquitin conjugation for class I antigen presentation. J Immunol. 1996;157:617–624.
- Bastianpillai C, Petrides N, Shah T, et al. Harnessing the immunomodulatory effect of thermal and non-thermal ablative therapies for cancer treatment. Tumor Biol. 2015;36:9137–9146.
- Sharabi AB, Lim M, DeWeese TL, et al. Radiation and checkpoint blockade immunotherapy: radiosensitisation and potential mechanisms of synergy. Lancet Oncol. 2015;16:E498–E509.
- Takaki H, Cornelis FH. Can the combination of ablation and immunomodulation become the breakthrough of cancer treatment?. Diagn Interv Imaging. 2018;99:121–122.
- Vonderheide RH. The immune revolution: a case for priming, not checkpoint. Cancer Cell. 2018;33:563–569.
- Stam AGM, de Gruijl TD. From local to systemic treatment: leveraging antitumor immunity following irreversible electroporation. In: Meijerink MR, Scheffer HJ, Narayanan G, editors. Irreversible electroporation in clinical practice. Cham: Springer International Publishing; 2018. p. 249–270.