
 ?Mathematical formulae have been encoded as MathML and are displayed in this HTML version using MathJax in order to improve their display. Uncheck the box to turn MathJax off. This feature requires Javascript. Click on a formula to zoom.
Abstract
Objective/Purpose: In order to study the effects of hyperthermia and other temperature-related effects on cells and tissues, determining the precise time/temperature course is crucial. Here we present a non-contact optoacoustic technique, which provides temperatures during heating of cultured cells with scalable temporal and spatial resolution.
Methods: A thulium laser (1.94 µm) with a maximum power of 15 W quickly and efficiently heats cells in a culture dish because of low penetration depth (1/e penetration depths of 78 µm) of the radiation in water. A repetitively Q-switched holmium laser (2.1 µm) is used simultaneously to probe temperatures at different locations in the dish by using the photoacoustic effect. Due to thermoelastic expansion of water, pressure waves are emitted and measured with an ultrasonic hydrophone at the side of the dish. The amplitudes of the waves are temperature dependent and can be used to calculate the temperature/time course at any location of probing.
Results: We measured temperatures of up to 55 °C with a heating power of 6 W after 10 s, and subsequent lateral temperature profiles over time. Within this profile, temperature fluctuations were found, likely owing to thermal convection and water circulation. By using cultured retinal pigment epithelial cells, it is shown that the probe laser pulses alone cause no biological damage, while immediate cell damage occurs when heating for 10 s at temperatures exceeding 45 °C.
Conclusions: This method shows great potential not only as a noninvasive, non-contact method to determine temperature/time responses of cells in culture, but also for complex tissue and other materials.
1. Introduction
With the development of laser-induced thermal therapy in different medical fields [Citation1–3], it is of great importance to elucidate cellular effects subsequent to those thermal impacts. It is essential to understand underlying mechanisms to optimize therapeutic strategy. For a better understanding of cell responses, basic studies using in vitro systems are valuable. Using cell culture models allows us to conduct repeatable experiments and to investigate versatile cellular responses, such as gene and protein expression, as a function of both temperature rise and the time at those elevated temperatures. These correlations become a challenge when considering short heating times because of their non-isothermal nature.
We have recently reported an experimental irradiation setup to heat adherent cells in a culture dish by heating the culture medium with a thulium laser (wavelength 1.94 µm) for 10 s [Citation4]. In that study, temperatures at different positions over a culture plate without cells were measured using small thermocouples. From this data, the mean values were utilized as a calibrated temperature map for each position and for each laser irradiation condition. However, thermocouples are not suitable for sterilized cell cultures, leaving us with the indirect estimates of temperature across the culture dish as a function of laser irradiance.
There are few methods for directly measuring the temperature rise spatially in a cell culture dish during laser irradiation, without thermocouples or other instruments. A suitable approach has been developed by Denton et al. [Citation5,Citation6], who imaged cells during laser exposure using a fast (800 fps, 192 × 192) IR-camera that measured the black body radiation of cells. However, the setup, including black body sources, is quite expensive, and the calibration of the camera is a major challenge for most laboratories.
The optoacoustic (OA) technique enables noninvasive temperature measurement within tissues [Citation7–11]. This method utilizes nanosecond laser pulses to induce ultrasonic pressure waves due to thermoelastic cell and tissue expansion. Due to the temperature dependence of the thermoelastic expansion coefficient temperature information is encoded in the pressure wave amplitude, which can be detected by an ultrasonic transducer [Citation12]. Usage of real-time temperature determination by means of OA technique in vivo was first reported by the authors, where measurement of temperature rise during clinical retinal laser treatments is critical for optimal therapy [Citation12,Citation13]. This technique has been further developed to provide real-time temperature rise during retinal photocoagulation, which is currently enhanced towards a computerized feedback system that controls the laser power and thus tissue damage in real-time [Citation7,Citation8].
The aim of this work is to employ the OA technique for two-dimensional temperature measurements in cell cultures during exposure to a second laser that generates localized hyperthermia. Here we report our method and setup, with the first proof-of-concept results in an in vitro model consisting of retinal pigment epithelial (RPE) cells.
2. Materials and methods
2.1. Measurement setup
A schematic drawing of the experimental setup is shown in . A continuous wave thulium laser (TLR-20, IPG Laser GmbH, Burbach, Germany) emitting a wavelength of 1.94 µm is delivered from below to heat cells on the glass bottom surface of the culture dish, as well as the aqueous solution above the cells. The light is guided via an optical fiber (core diameter of 365 µm, NA of 0.2; StarMedTec GmbH, Starnberg, Germany). A plan-convex quartz lens (f = 50 mm) is located 50 mm behind the fiber and 150 mm prior to the cell culture dish, having a 170 µm-thick IR-transparent glass (D 263 M Schott AG, Mainz, Germany). The light is projected to the cell culture dish with a radius of 5.2 mm. The lateral beam profile was approximately Gaussian.
Figure 1. (a) A schematic drawing of the heating/measurement setup. A continuous wave thulium laser (‘Tm-Laser’) is guided via an optical fiber (core diameter of 365 µm, NA of 0.2), and a plano-convex quartz lens is located below the cell culture dish. A self-developed Q-switched holmium laser (‘Ho-Laser’) served as probe laser to measure TOA. The probe beam spot was scanned with a galvo scanner in a line over the whole diameter of the bottom of cell growth area with a frequency of 10 Hz for 10 measurement points (The number from 1 to 10). A shutter was used to start and finish the irradiation, and a mirror combines both laser beams. A hydrophone was located outside the dish wall in order to detect the ultrasonic pressure waves after the holmium laser impact. Ultrasonic gel was used to enable acoustic coupling. The ultrasonic pressure waves were amplified and digitized. (b) A picture of a cell culture dish with a culture medium (with phenol red) and a hydrophone.
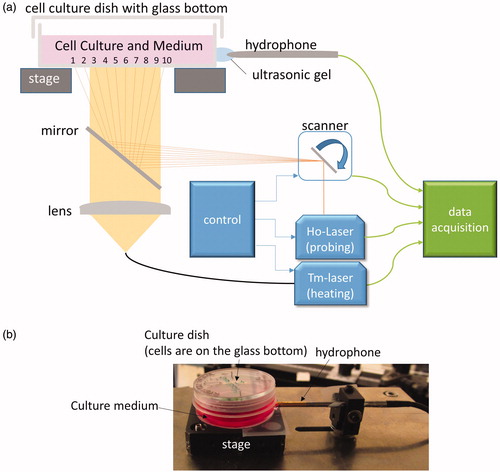
A self-developed Q-switched holmium laser, emitting a wavelength of 2.1 µm, served as the probe laser for determining the temperature of cells and medium optoacoustically. Its pulse duration was set to 60 ns, the repetition rate to 100 Hz, and the maximum pulse energy available in the plane of cells was 134 µJ. The probe beam spot, with a diameter of less than 1 mm, was scanned with a galvo scanner (GCM001, Thorlabs Inc., Newton, MA) in a line over the whole diameter (19 mm) of the culture dish with a scan frequency of 10 Hz. Thus, 10 equally spaced (2 mm) spots, center to center, were addressed by each scan. This means that for each spot, temperature is acquired every 100 ms. For pulse energy stability reasons, the holmium laser is operated permanently while its emission on the sample is controlled by a shutter (SH05, Thorlabs Inc.) in the optical path. A dichroic mirror (HR coating 1850–2130, Layertec GmbH, Mellingen, Germany) combines both laser beams. In order to detect the ultrasonic pressure waves after the holmium laser impact, a hydrophone (PZT-Z44-1500, ONDA, Sunnyvale, CA) was located outside the dish (). Ultrasonic gel was used to enable acoustic coupling. The ultrasonic pressure waves were amplified by a preamplifier (Olympus 56605B, 60 dB; 20 kHz–2 MHz). A PC-based digitizer (GaGe/Dynamic Signals LLC, Lockport, NY) with a sampling rate of 200 MHz and a resolution of 14 bit was used for digitizing. The energy of each pulse was measured by integrating over the pulse power measured with a fast photodiode (J23-18I-R250U-2.2, Laser Components GmbH, Olching, Germany). The OA pressure transient received by the hydrophone was rectified and numerically integrated over the time of high amplitudes in order to improve the signal to noise ratio.
For laser irradiation on cell cultures, a confluent RPE cell culture with 3.5 ml culture medium was placed on the irradiation stage. The baseline of the medium temperature was room temperature (about 23 °C). A co-aligned aiming beam (λ = 635 nm, max power 1 mW) allowed positioning of the irradiation laser within the culture dish. Three seconds after the start of the scanner and the probe laser, the heating laser was turned on for a 10-s irradiation with a laser power of either 0 W (control), 2.8 W, or 6.0 W.
The water absorption coefficients at thulium (1.94 µm) and holmium (2.1 µm) laser wavelengths are 12.8 mm−1 and 2.86 mm−1 with 1/e penetration depths of 78 µm and 350 µm, respectively [Citation14,Citation15].
2.2. OA temperature determination
The principle for OA temperature determination is based on thermoelastic expansion after short pulsed heating. The amplitude of the emitted pressure wave is proportional to the absorbed pulse energy Ep and the temperature-dependent Grüneisen coefficient Γ (T) [Citation12,Citation13].
The Grüneisen coefficient of water is well approximated by a second order polynomial in the range of 10–90 °C relevant for this work. The required values can be found in the literature [Citation16], with a zero crossing p(T)=0 at T0=4 °C and a maximum dP/dT = 0 at Tmax=121 °C. In the case a laser pulse is used to measure water temperature with constant temperature over the penetration depth of the laser radiation, the optoacoustically evaluated temperature can be expressed as follows:
where p(T) represents the pressure at temperature T. The proportionality constant, S, is determined for every scan position separately, prior to heating with the thulium laser, by normalizing the pressure p(Tamb) to the ambient temperature Tamb=TOA.
For verification, a thermocouple (ALKB025, Rössel Messtechnik GmbH, Dresden, Germany) was placed in the medium at the center of the cell culture dish, very close to the dish bottom. Temperature data were digitized (NI9211, National Instruments, Austin, TX) and stored to be compared with
2.3. RPE cell culture
RPE cells were isolated from freshly enucleated porcine eyes as described previously [Citation17]. The cells were cultured in a Dulbecco’s Modified Eagle Medium (DMEM, high glucose, Sigma-Aldrich, St. Louis, MO), supplemented with 10% porcine serum (Sigma Aldrich), 1 mM sodium pyruvate, 100 unit/ml penicillin and 0.1 mg/ml streptomycin (Sigma Aldrich). Cells were maintained in an incubator at 37 °C under 5% CO2. Confluent second passage cell cultures (approximately 4 × 10⁵ cells/dish) on glass-bottom dishes (µ-Dish 35 mm, growth area: diameter of 20 mm, ibidi, Martinsried, Germany) were used for experiments.
Three hours after laser irradiation, the culture medium was replaced by 1 ml of 3–(4,5-dimethylthiazol-2-yl)-2,5-diphenyltetrazolium bromide (MTT) solution (1.25 mg/ml), and incubated for 2 h to be converted to a formazan product in the mitochondria of healthy cells. The MTT solution was removed and features of the cell cultures were documented using digital photography from above the dishes. Images of the entire cell growth area (20 mm diameter) enabled a visual inspection for cell coverage (confluence), staining by MTT, homogeneity of purple pigmentation, as well as laser-dependent damage (lack of MTT stain). To estimate the extent of cell damage in the cultures, a 1 mm grid paper was placed beneath the dish during imaging. To quantify the MTT conversion by healthy cells, 2 ml of dimethyl sulfoxide (DMSO, Sigma-Aldrich) were added to each dish to dissolve the formazan product. After 30 min, absorbance of the DMSO-formazan solution was measured at 570 nm using a photometer (SpectraMax M4, Molecular Device, Sunnyvale, CA). The absorbance value is a direct estimate of the number of live cells after laser exposure. Experiments were performed in triplicate.
3. Results
3.1. Verification of the method
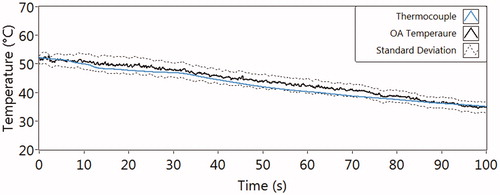
shows the temperature decay curves for the validation experiment, where the OA and thermocouple measurements were carried out with pre-warmed medium (52 °C) in a dish during cooling down (to 35 °C). The mean value of the TOA from 10 different measure positions at each point in time is shown with the solid black line, and the average standard deviation as dash lines (2.3 ± 2.1 °C). The reference temperature via thermocouple measurement, shown with the blue line, is within the standard deviations of TOA. This proves the validity and accuracy of the OA method compared to the standard temperature measurement by a thermocouple.
Figure 2. The temperature, measured by a thermocouple (reference temperature, blue line), and the simultaneously obtained (black solid line, standard deviation with black dash lines) of the culture medium during cooling from about 52 °C to 35 °C.
3.2. Temperature measurement on RPE cell culture during laser heating
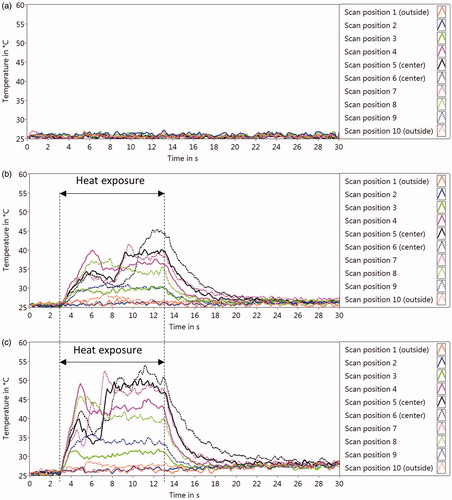
The measured temperature rises over time for each scan position are shown in . The OA-temperature acquisition was stopped after 30 s. It was shown that the probe laser alone does not lead to a measurable temperature rise of the medium (). The exposure with the thulium laser power of 2.8 W induced temperature increases above 40 °C at several scan positions close to the center of the dish (). Increasing the power of the heating laser to 6 W led to temperatures of around 50 °C ().
Figure 3. Optoacoustic temperatures (TOA) at each position on RPE cell culture over time during laser heating, with the laser power of 0W (only probe laser) (a), 2 W (b), and 6.8 W (c). About 3 s after the probe laser and the scanner were started, the heating laser was turned on followed by the 10-s irradiation (‘Heat exposure’). The temperature measurements (10 Hz) were continued until 30 s. The temperature course of each measurement point is plotted with different colors and styles.
3.3. Temperature distribution and cell viability
The temperature distributions across the culture dish during the last second (10th second) of laser irradiations are plotted and shown in (panels a-c). The peak temperature near the center of the dish was 44 °C when exposed to 2.8 W (), and 51 °C when exposed to 6 W (). Several features are shown in the color images () of the MTT stained cell cultures 3 h post laser exposure. The photographs show the inhomogeneous distribution of pigmentation (intracellular melanosome particles, indicated with an asterisk in ), which is a consequence of sub-culturing primary RPE cells. The uniform distribution of purple color (MTT-formazan) in panels (b) and (d) indicates similar confluence of the cell monolayers, and that no photothermal damage took place. The striking loss of purple color in indicates the central higher temperature (max 51 °C) through 6 W laser exposure damaged a large area of the cell monolayer and could not transform the MTT to the formazan product. The round nature of the damaged area in panel f shows that the varied pigmentation did not alter the bulk water heating by the heating laser.
Figure 4. TOA-distribution across the culture dish bottom at the 10th second of irradiation (a, c, e), and the results of MTT assay (cell viability test) for corresponding cell cultures (b, d, f), with the heating laser power of 0W (only probe laser) (a, b), 2 W (c, d), and 6.8 W (e, f). The pictures (b, d, f) are the digital photography images of the cell culture with formazan before lysed. Asterisk (*) shows the inhomogeneous melanin pigmentation. Arrows in (f) indicate the boundary between live and dead cells. (g) The quantification of formazan of the cell lysis by measuring the light absorption at 570 nm. Bar = 5 mm.
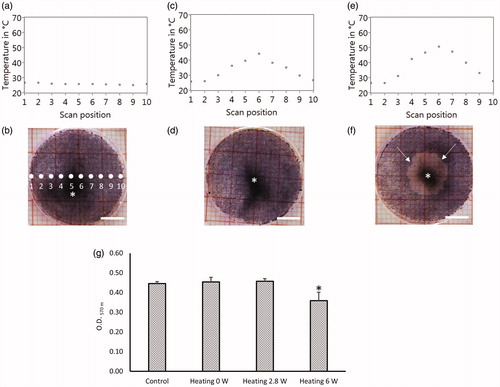
Using the grid paper under the plate (20 mm) in , we estimate a round region of damaged cells with diameter of about 9 mm. The area damaged (about 64 mm2) represents about 20% of the total area (312 mm2), which would mean a viability of about 80% across the plate. When the MTT-formazan is quantified (), the change in live cell fraction is clearly lower in the plate shown in panel f. The quantification step shown in validates the viability estimate using the visible image () because an optical density (O.D.) at 570 nm of 0.36 is about 80% of the 0.45 O.D. for the control, the probe laser alone, and the 2.8 W heating laser that did not produce visible damage. Finally, the similar O.D. values for the control and 2.6 W laser exposure (0.45), and the low standard deviations (error bars) both indicate that the total number of cells present in the 20 mm dish at the time of our experiments were about the same. Our method, therefore, provides a level of confidence for quantifying photothermal damage, which will correlate to our temperature measurements.
4. Discussion
In this work, we present a non-contact method to acquire the temperature rise of cells in a cell culture dish when heating them by laser exposure with a wavelength well absorbed by water. The following paragraphs will discuss the results and limitations of the method, what our plans are for future improvements of the method, and the potential adaptation of the method for other applications.
4.1. Method
As a verification of our method, medium was heated and then cooled down in a culture dish that was probed by the holmium laser pulses, with simultaneous temperature measurement by a thermocouple in the medium. We used an ultrasonic transducer mounted in contact with the culture dish. Other transducer geometries below the cell dish bottom or a FVDF-transducer foil bended around the culture dish were also investigated, which showed comparable signal/noise ratio (not shown here). The results displayed in show very good agreement between and the reference temperature over the cooling period of 100 s. When a xy-scanner is used, all radial positions of the cell dish can be probed in general, as shown by a line scan through the center. The local resolution of the temperature measurement is defined by the probing beam diameter, which can be varied.
However, the methods have some limitations relative to laser heating. The setup is calibrated with a uniform temperature in the axial direction over the penetration depth of the holmium laser radiation. However, due to the shorter penetration depth of the thulium laser, the heating from this laser is not uniform in axial direction over the range of the holmium laser probing. Fortunately, this effect can be addressed mathematically, based on heat diffusion theory resulting in a balancing function containing the absorption coefficients of water for both wavelengths, the temperature-dependent water parameters, as well as the heat flow towards the glass bottom. A detailed analysis for the complex case of retinal heating can be found in the literature [Citation7,Citation12] and can be adapted to this case. For this application, it exceeds the content of this report and will be published in a separate article.
In the development of today’s tissue engineering, a temperature determination for three-dimensional tissue model is also demanded. This could be performed with the current system, when using a wavelength for detection which exhibits an absorption contrast, namely, the target cells (or part to be measured) need to absorb stronger than the environment. For temperature measurement in tissue with nearly uniform absorption, OA-microscopy is an adequate technique to enable three-dimensional temperature measurement with high spatial resolution [Citation18].
4.2. Heating of cells (temperature course over time)
We measured the absorption of intra- and extracellular water of medium in the heated volume. The method is based on the assumption that the temperature of the cells is equal to the temperature of the surrounding medium, which is very valid due to the short thermal relaxation time of less than 100 µs compared to the heating time of 10 s.
We found that the probing holmium laser pulses do not lead to a noticeable temperature rise. When the thulium laser was activated for the 10-s exposure, a monotonic temperature rise was generated as expected over the first 2 s at the central positions, at both powers applied. However, after this initial period, a temperature drop occurred in the central positions with a concomitant temperature saturation at the outer positions, which is not in accordance with pure heat diffusion calculations. This phenomenon also accounts for the lack of proportional power dependence on the temperature rise between 2.8 and 6 W. Most likely, the hotter water in the center of the dish is streaming upward. As a consequence of thermal convection, cooler water approaches the bottom from the side of the dish and is measured by the probe laser as cooler temperatures. Consequently, this method may allow the determination of real temperatures at the cellular level including flow dynamics, which is difficult to be determined with other methods. Finite element simulations would be necessary to describe quantitatively the cooling effect of microcurrents.
4.3. Temperature effect on cells
As shown in , the probe laser itself does not lead to a noticeable cellular temperature rise. Furthermore, the generated pressure waves do not damage the cells. At the end of the 10-s irradiation, a triangle shaped temperature spatial profile across the dish’s diameter is generated. When cell temperatures exceed 45–50 °C, cell damage was confirmed with the MTT assay. This temperature range is reasonable for the onset of thermal damage as it coincides with other studies [Citation17,Citation19], which indirectly verifies the results shown with our new method. As this technique provides accurate temperature-time histories at any arbitrary point of interest in the culture dish, it can be used to prove thermal damage theories, like the Arrhenius integral [Citation20,Citation21] for different cell types and tissues. Further, the expression of different types of cytokines can be correlated in detail with respect to the time-temperature history.
4.4. Improving the method and verification by other techniques
In order to further improve the method and its accuracy, more uniform heating in the axial direction would be useful. This would be an improvement because the prerequisite for OA-temperature determination without using balancing functions is a uniform temperature over the penetration depth of the probe laser. Thus, the use of a wavelength having smaller absorption coefficient for heating, and a wavelength with higher absorption coefficient for probing, would be useful. Good candidates for heating are a Nd:YAG laser at 1.32 µm or an Er:Glass laser at 1.54 µm, giving penetration depths of about 5 mm and 800 µm, respectively [Citation22]. Further, this modification would limit the effects of heat convection, because the temperature gradients become smaller. For probing, Q-switched CO2, Tm, or Er:YSGG lasers could be used with much lower penetrations depth. With respect to minimize temperature gradients within the culture dish, ideally a glass or plastic for the bottom should be selected whose absorption and heat conductivity approximates that of water.
To further verify the OA-temperature method at the cell level, a combination with thermal imaging with an IR-thermocamera [Citation5,Citation6] would allow comparison because the two methods do not interfere with each other. Additionally, optical coherence tomography or speckle dynamic measurements could be used to measure cellular expansion, with correlations to the temperature with respect to the thermal expansion coefficient, as it has been demonstrated for laser photocoagulation [Citation23,Citation24]. In conclusion, this method could find a wide application for studying hyperthermia or other temperature related cellular effects with high spatial and temporal resolution without using contacting thermocouples or an IR-thermocamera. Finally, the method could also be extended to other models and materials.
Disclosure statement
The authors have no conflict of interest to declare.
Additional information
Funding
References
- Vogl TJ, Straub R, Zangos S, et al. MR-guided laser-induced thermotherapy (LITT) of liver tumours: experimental and clinical data. Int J Hyperthermia. 2004;20:713–724.
- Sramek C, Mackanos M, Spitler R, et al. Non-damaging retinal phototherapy: dynamic range of heat shock protein expression. Invest Ophthalmol Vis Sci. 2011;52:1780–1787.
- Li N, Sun Q, Yu Z, et al. Nuclear-targeted photothermal therapy prevents cancer recurrence with near-infrared triggered copper sulfide nanoparticles. ACS Nano. 2018;12:5197–5206.
- Miura Y, Pruessner J, Mertineit CL, et al. Continuous-wave thulium laser for heating cultured cells to investigate cellular thermal effects. J Vis Exp. 2017;124. DOI:10.3791/54326.
- Denton ML, Noojin GD, Foltz MS, et al. Spatially correlated microthermography maps threshold temperature in laser-induced damage. J Biomed Opt. 2011;16:036003.
- Denton ML, Noojin GD, Foltz MS, et al. Spatially correlated microthermography maps threshold temperature in laser-induced damage. Erratum: J Biomed Opt. 2015;20:079801.
- Brinkmann R, Koinzer S, Schlott K, et al. Real-time temperature determination during retinal photocoagulation on patients. J Biomed Opt. 2012;17:061219.
- Koinzer S, Schlott K, Ptaszynski L, et al. Temperature-controlled retinal photocoagulation–a step toward automated laser treatment. Invest Ophthalmol Vis Sci. 2012;53:3605–3614.
- Petrova EV, Brecht HP, Motamedi M, et al. In vivo optoacoustic temperature imaging for image-guided cryotherapy of prostate cancer. Phys Med Biol. 2018;63:064002
- Landa FJO, Dean-Ben XL, Sroka R, et al. Volumetric optoacoustic temperature mapping in photothermal therapy. Sci Rep. 2017;7:9695.
- Petrova EV, Oraevsky AA, Ermilov SA. Red blood cell as a universal optoacoustic sensor for non-invasive temperature monitoring. Appl Phys Lett. 2014;105:094103.
- Schule G, Huttmann G, Framme C, et al. Noninvasive optoacoustic temperature determination at the fundus of the eye during laser irradiation. J Biomed Opt. 2004;9:173–179.
- Kandulla J, Elsner H, Birngruber R, et al. Noninvasive optoacoustic online retinal temperature determination during continuous-wave laser irradiation. J Biomed Opt. 2006;11:041111.
- Jansen ED, van Leeuwen TG, Motamedi M, et al. Temperature dependence of the absorption coefficient of water for midinfrared laser radiation. Lasers Surg Med. 1994;14:258–268.
- Theisen-Kunde D, Tedsen S, Doehn C, et al. Comparison between a 1.92-mu m fiber laser and a standard HF-dissection device for nephron-sparing kidney resection in a porcine in vivo study. Lasers Med Sci. 2011;26:509–514.
- Grigull U, Straub J, Schiebener P. Table of the properties of ordinary water substances. New York (NY): Springer; 1989.
- Kern K, Mertineit CL, Brinkmann R, et al. Expression of heat shock protein 70 and cell death kinetics after different thermal impacts on cultured retinal pigment epithelial cells. Exp Eye Res. 2018;170:117–126.
- Ma R, Sontges S, Shoham S, et al. Fast scanning coaxial optoacoustic microscopy. Biomed Opt Express. 2012;3:1724–1731.
- Denton ML, Foltz MS, Noojin GD, et al. Determination of threshold average temperature for cell death in an in vitro retinal model using thermography. Proc SPIE. 2009;7175:71750G–71751.
- Birngruber R, Hillenkamp F, Gabel VP. Theoretical investigations of laser thermal retinal injury. Health Phys. 1985;48:781–796.
- Welch AJ. The thermal response of laser irradiated tissue. IEEE J Quantum Electron. 1984;20:1471–1481.
- Ross EV, Uebelhoer N. Laser-tissue interaction. New York (NY): Springer; 2011.
- Muller HH, Ptaszynski L, Schlott K, et al. Imaging thermal expansion and retinal tissue changes during photocoagulation by high speed OCT. Biomed Opt Express. 2012;3:1025–1046.
- Bliedtner K, Seifert E, Brinkmann R. Real time speckle monitoring to control retinal photocoagulation. SPIE Proceeding 10413. Novel Biophotonics Techniques and Applications IV in European Conference on Biomedical Optics; Munich, Germany; 2017.