
Abstract
Objective: The objective of this study was to explore the correlations between the therapeutic effect of high intensity focused ultrasound (HIFU) and histopathological characteristics of excised uterine fibroids with different signal intensities as visualized on T2-weighted magnetic resonance imaging (MRI).
Methods: We collected 47 specimens of uterine fibroids after surgical resection and classified them into four groups according to preoperative T2-weighted MRI hypo-intense, isointense, heterogeneous intense and homogeneous hyper-intense. Then, specimens in each group were irradiated by HIFU with the same parameters and the necrotic tissue volume was calculated. The smooth muscle cell (SMC) count and collagen fiber content were quantitatively measured and compared between different groups. We analyzed the correlation between the necrotic tissue volume and SMC count and the collagen fiber content.
Results: Necrotic tissue volume gradually decreased from the hypo-intense group to the homogeneous hyper-intense group (p = .008). The SMC count from the hypo-intense group to the homogeneous hyper-intense group was 215.6 ± 59.3, 237.0(89.5), 232.3 ± 72.5 and 330.5 ± 30.9, respectively; collagen fiber content was 0.65 ± 0.07, 0.64 ± 0.10, 0.53 ± 0.11 and 0.41 ± 0.06, respectively. Comparison among the four groups showed that SMC count progressively increased (p = .001) but collagen fiber content progressively decreased (p = .000) from the hypo-intense group to the homogeneous hyper-intense group. Correlation analysis showed that necrotic tissue volume was negatively correlated with SMC count (R = −0.488, p=.013) but positively correlated with collagen fiber content (R = 0.534, p = .005).
Conclusions: Differences in histopathological characteristics may be one of the reasons for different therapeutic effects of HIFU ablation on uterine fibroids with different signal intensities on T2-weighted MRI.
Introduction
Uterine leiomyoma, a benign clonal tumor arising from the uterine smooth muscle cells (SMCs), is one of the most common benign gynecological tumors with significant clinical manifestations in about 25% of women [Citation1]. Relevant clinical symptoms severely affect the quality of life of the patients and its treatment may even involve invasive therapies such as hysterectomy. Although hysterectomy can prevent the relapse of uterine fibroids, it can also significantly affect the physiology and psychology of patients.
High intensity focused ultrasound (HIFU) treatment involves the use of high-frequency ultrasound beams that can be focused on precisely defined target areas, causing localized temperature elevation and coagulative necrosis in these targets – as a result of thermal and cavitation effects – with no damage to surrounding viable tissue [Citation2,Citation3]. HIFU has been used in the clinical treatment of uterine fibroids and can ensure uterine integrity. Clinical observations using T2-weighted magnetic resonance imaging (MRI) have confirmed that HIFU ablation with different signal intensities has significantly different therapeutic effects on uterine fibroid; domestic and international scholars have therefore conducted many clinical studies on this phenomenon. The consensus is that uterine fibroids with hypo-intense signal intensity are easily ablated, but the difficulty in ablating leiomyomas with hyper-intense signal intensity remains partly controversial [Citation4–7]. Some studies show that fibroids with hyper-intense signal intensity are difficult to ablate [Citation4,Citation6,Citation7]. However, Zhao et al. [Citation5] subdivided hysteromyomas with hyper-intense signal intensity into three categories, demonstrating that leiomyomas with heterogeneous hyper-intense areas and markedly homogeneous hyper-intense signal intensity can be ablated with good effect, but the ablation of fibroids with slightly homogeneous hyper-intense signal intensity is ineffective. Their results suggested that HIFU treatment is not applicable for fibroids with slightly homogeneous hyper-intense signal intensity. Based on our previous research on the biophysical characteristics of uterine fibroids, we classified fibroids into four different groups hypo-intense, isointense, heterogeneous intense and homogeneous hyper-intense.
Regarding the potential factors involved in the differences of therapeutic effect, an important factor affecting HIFU efficacy is the absorption of the acoustic energy converted to thermal energy by the targeted tissue and the heat energy produced, which finally causes coagulative necrosis in the targeted tissue [Citation8]. This process involves acoustic and thermal parameters. In the case of biological tissue, the important factor affecting acoustic and thermal characteristics is the difference in composition and structure of tissue. Another important factor affecting therapeutic effects is blood perfusion. Specifically, highly vascularized (perfused) tissues might be more resistant to thermal ablation than poorly perfused areas owing to the heat-sink effect of their blood supply [Citation9]. The main pathological composition of a uterine fibroid includes SMCs and collagen fibers [Citation1,Citation10,Citation11]; therefore, we hypothesized that the differences in SMC count and collagen fiber content could be important factors influencing its acoustic and thermal properties. Hence, the objective of this in vitro study was to observe different therapeutic effects in and histopathological characteristics of uterine fibroid specimens with different signal intensities, visualized with T2-weighted MRI, and to explore the correlation between the therapeutic effect of HIFU and the histopathological characteristics of the tissue. Furthermore, we aimed to study the reasons behind different therapeutic efficacies of HIFU ablation in uterine fibroids with different signal intensities with T2-weighted MRI scans from the perspective of histopathological characteristics.
Materials and methods
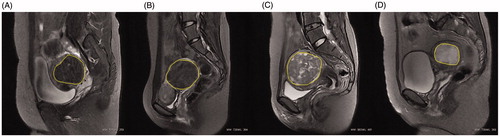
The ethics committee of Chongqing Medical University approved this study. From December 2014 to June 2015, 47 patients were diagnosed with uterine fibroids by gynecologists in the First Affiliated Hospital of Chongqing Medical University and subsequently underwent myomectomy or hysterectomy. A total of 47 specimens of uterine fibroids were retrieved after surgery; for patients with multiple fibroids, only the largest one was retrieved. Inclusion and exclusion criteria were the same as described in our previous studies [Citation12,Citation13]. All patients underwent pretreatment MRI with a standardized protocol. Sagittal T2-weighted fast spin-echo images were performed using a 3.0 T MR unit (Signa HD Excite, GE healthcare, Marlborough, MA) with an eight channel phased-array coil. The scan parameters were as follows: repetition time (TR): 3040ms, echo time (TE): 107.5 ms, field of view (FOV) (cm): 28 × 22.4, matrix: 320 × 224, slice thickness (mm): 6, slice gap (mm): 1, number of excitation (NEX): 1. Uterine fibroids in this study were classified into four categories according to signal intensity on pretreatment T2-weighted MRI: (1) hypo-intense: signal intensity equal to that of the skeletal muscle; (2) isointense: signal intensity lower than that of the myometrium but higher than that of the skeletal muscle; (3) heterogeneous intense: fibroids with bar or lamellar high signal intensity that approximates to that of the endometrium, or with bar or lamellar low signal intensity that approximates to that of the skeletal muscle, background signals of uterine fibroids could be either hypo-, iso- or hyper-intense; (4) homogeneous hyper-intense: fibroids with uniformly distributed high signal intensity higher than that of the myometrium and equal to that of the endometrium (). Signal intensities on T2-weighted MRI of the myoma were assessed by two radiologists having more than 10 years of experience.
Figure 1. Representative images of uterine fibroids with different signal intensities on T2-weighted sagittal MRI. (A) Hypo-intense; (B) Isointense; (C) Heterogeneous intense and (D) Homogeneous hyper-intense. The yellow marker is the outline of the uterine fibroid.
Specimen disposal
After myomectomy or hysterectomy, specimens of uterine leiomyomas were refrigerated immediately in saline-filled sample bags and transferred to the laboratory within 30 min. The specimens were treated in vitro and examined for histopathological characteristics in accordance to the experimental requirements. Because the extent of the coagulation region may be beyond the boundary of fibroids with small volumes, fibroids with a diameter less than 3 cm were excluded when they were treated in vitro.
In vitro treatment and necrotic tissue volume calculation
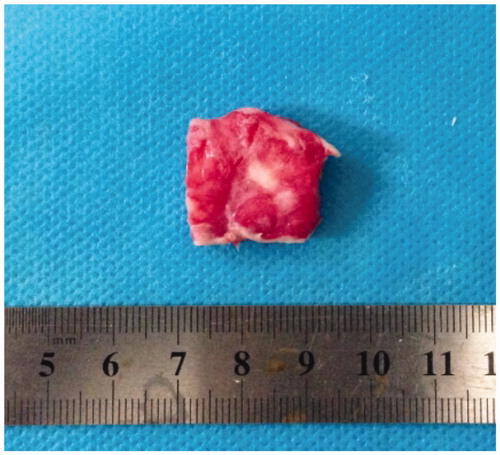
Specimens were fixed and placed in a water tank made of acoustic transparent materials and filled with degassed water. The focus was located at 2 cm from the edge of the fibroid and treated using US-guided HIFU tumor therapeutic system (JC, Chongqing Haifu (HIFU) Tech Co. Ltd., Chongqing, China). The treatment parameters were as follows: acoustic power: 200 w, continuous wave, treatment mode of single point irradiation, irradiation time of 2 s per session with a total of two sessions. After irradiation, specimens were immediately sliced into samples sized 2 cm × 2 cm × 0.5 cm and placed into the dying box with a 2% concentration triphenyl tetrazolium chloride (TTC) solution [Citation13]. Then, the dyeing box was placed in a 37 degree centigrade thermostat water bath for 45 min, after which the fibroid surface was stripped with a surgical blade until exposure of the largest area of the myoma showing necrosis was achieved (necrotic tissue appeared white after staining while normal areas were red, ). The maximum length and diameter of necrotic tissue were measured, and necrotic tissue volume was calculated by the ellipsoid volume formula:
Figure 2. Necrosis of in vitro uterine fibroid specimen (TTC staining): white area depicts necrosis.
V = 4/3×π×(1/2)a×(1/2)b×(1/2)c (a, b and c represent the maximum diameters of the non-TTC-staining uterine fibroid tissue in each spatial dimension) [Citation13].
The volume of necrotic lesion was used to represent the ablation effect.
Quantitative analysis of the histopathological characteristics of uterine fibroids
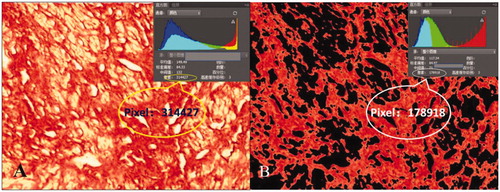
Fibroma was sliced into samples sized 1 cm × 1 cm × 0.5 cm and embedded as paraffin slides. The paraffin slides were then stained by hematoxylin and eosin and Sirius red staining to observe SMC count and collagen fiber content, respectively. Three slides of each fibroid specimen were randomly selected for quantitative analysis. Photographs were taken of each slide from five randomly selected microscopic fields with 400 times magnification on an optical microscope. The SMC count was semi-automatically analyzed by Image-Proplus (Media Cybernetics, Rockville, MD) (). The nucleus of the SMC was stained deep red by software. The threshold for staining was to stain all nuclei dark red, and we avoided staining the peripheral non-nuclear parts so that the counting results were not affected. After staining, the ‘Count’ button was clicked to automatically display the calculation results of the SMC count. To avoid identifying adjacent multiple nuclei as a single nucleus, ‘Edit - Auto spilt’ was clicked to make the test results more accurate after the initial calculation. Collagen fiber images were processed with Photoshop (Adobe Systems, San Jose, CA) image analysis software. First, the pixel value of the whole picture was automatically calculated. Then, the yellow non-collagen fiber components were removed by adjusting the parameters and the pixel value of red collagen fibers was subsequently calculated automatically. Finally, collagen fiber content was evaluated by calculating the ratio of the area of red collagen fibers to the total area of the image (). Image analyses were performed separately by two pathologists who were blinded to the other’s test results. The two pathologists checked each other’s results when the analysis was completed. The results were considered valid and average results were evaluated only if the difference between their SMC count results of an identical specimen was less than 10 and if the difference of collagen fiber content was within 5%. If results were invalid, then both pathologists repeated the measurements separately until the results were valid. Results of five fields were averaged.
Figure 3. SMC count. Histopathological images with hematoxylin and eosin staining of uterine fibroids, microscopic magnification, ×400. Image-Proplus analysis software automatically identified the nucleus (the nucleus of SMC is shown in dark red) and the cellular count was 243 in the field.
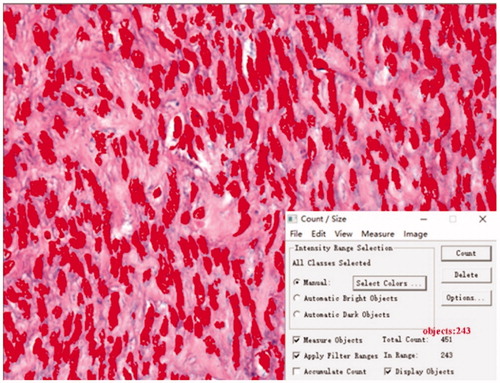
Figure 4. Collagen fiber content on the Sirius red staining image: microscopic magnification, × 400. Photoshop analysis software analyzed the image pixels. (A) pixels of the whole picture and (B) pixels of the red collagen fiber. Collagen fiber content was evaluated as the ratio of the area of red collagen fibers to the total area of image.
Statistical analysis
The data were analyzed with SPSS version 22.0 software (IBM SPSS Statistics, Armonk, NY). Normally distributed data were reported as mean ± SD, and non-normally distributed data were reported as median and interquartile range. Necrotic volume, SMC cell count and collagen fiber content were compared between different groups. For normally distributed data, comparisons among the four groups were analyzed with one-way ANOVA test [Citation5]. Non-normally distributed data were analyzed with non-parametric tests. For comparison in pairs, normally distributed data were analyzed with independent t-tests while non-normally distributed data were analyzed with Mann–Whitney tests. A p value < .05 was considered statistically significant. The correlation among necrotic volume, SMC cell count and collagen fiber content were analyzed by Pearson correlation analysis for normally distributed data and with Spearman correlation analysis for non-normally distrusted data. The correlative coefficient was expressed as R. Correlation with p<.05 was considered statistically significant.
Results
Baseline data of uterine fibroid patients
A total of 47 fibroid specimens were collected. All fibroids were intact and not morcellated. After 21 fibroids were excluded due to small size, 26 samples (26 of 47) were treated in vitro and the necrotic volumes were calculated. The average patients’ age was 36.9 ± 5.6 (22–54) years and the average body mass index was 21.7 ± 3.2 (12.3–29.5) kg/cm2. The sample sizes of the hypo-intense group, isointense group, heterogeneous intense group and homogeneous hyper-intense group were 7, 9, 21 and 10, respectively ().
Table 1. Baseline data of patients.
Necrotic tissue volume
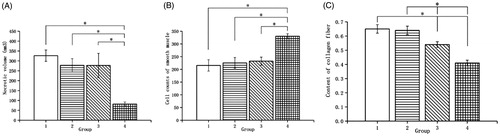
A total of 26 samples (26 of 47) were treated in vitro and the necrotic tissue volume was calculated. The results showed that the average necrotic volume of the hypo-intense (5 cases), isointense (8 cases), heterogeneous intense (8 cases) and homogeneous hyper-intense groups (5 cases) were 326.2 ± 63.97, 277.74 ± 89.25, 276.87 ± 162.14 and 81.86 ± 22.62 mm3, respectively. Necrotic volume gradually decreased from the hypo-intense group to the homogeneous hyper-intense group (p=.008) ().
Figure 5. Comparison of necrotic volume and histopathological characteristics of uterine fibroids with different signal intensities on T2-weighted MRI. (A) Necrotic tissue volume; (B) SMC count and (C) Collagen fiber content. Group 1: hypo-intense; Group 2: isointense; Group 3: heterogeneous intense and Group 4: homogeneous hyper-intense (*p < .05).
Histopathological characteristics of uterine fibroids
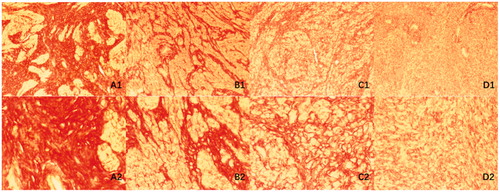
The histopathological characteristics observed were similar to those reported in previous literature: hypo-intense fibroids were typically comprised of SMCs arranged in whorls with a large amount of thick collagen fibers, with consistent morphology and size of SMCs, smaller nucleus and lower SMC count [Citation14,Citation15]. Fibroids with isointense signal, similar to those with hypo-intense signals, were comprised of SMCs arranged in whorls, but the overall SMC count increased slightly, with more slender collagen fibers compared to that in fibroids with hypo-intense signal and a bundle pattern was observed in addition to the whirlpool pattern; fibroids with homogeneous hyper-intense signal intensity were, in most cases, cellular leiomyomas composed of abundant SMCs arranged in dense and uniform patterns with a few sparse collagen fibers with no SMCs arranged in whorls [Citation16]; fibroids with heterogeneous hyper-intense signal had substantial areas with both typical normal fibroid structure and arrangement like that of cellular leiomyoma, with the degenerated parts showing mostly hyaline and myxoid degeneration [Citation16–19] ( and ).
Figure 6. Histopathological images with hematoxylin and eosin staining of uterine fibroids with different signal intensities on T2-weighted MRI. (A) Hypo-intense; (B) Isointense; (C) Heterogeneous intense and (D) Homogeneous hyper-intense. A1–D1: microscopic magnification, × 100; A2–D2: microscopic magnification, × 400.
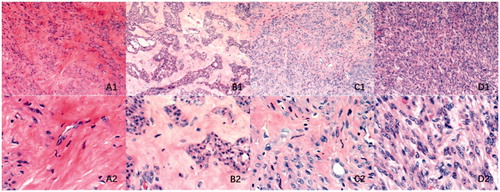
Figure 7. Histopathological images with Sirius red staining of uterine fibroids with different signal intensities on T2-weighted MRI. (A) Hypo-intense; (B) Isointense; (C) Heterogeneous intense and (D) Homogeneous hyper-intense. A1–D1: microscopic magnification, × 100; A2–D2: microscopic magnification, × 400.
Quantitative analysis and comparison of uterine fibroid tissue components
SMC count
All 47 samples were evaluated and compared in groups. The results showed that the average SMC count of hypo-, iso-, heterogeneous and homogeneous hyper-intense groups were 215.6 ± 59.3, 237.0(89.5), 232.3 ± 72.5 and 330.5 ± 30.9, respectively. Comparison among the four groups showed that SMC count progressively increased from the hypo-intense group to the homogeneous hyper-intense group (p=.001). Regarding SMC count, paired comparison showed that they were lower in the hypo-intense group compared to that in the homogeneous hyper-intense group (p=.000), lower in the isointense group than that in the homogeneous hyper-intense group (p=.001) and lower in the heterogeneous intense group than that in the homogeneous hyper-intense group (p=.000). The remaining differences were not statistically significant ().
Collagen fiber content
All 47 samples were measured and compared in groups. The results showed that the average collagen fiber content of hypo-, iso-, heterogeneous intense and homogeneous hyper-intense groups were 0.65 ± 0.07, 0.64 ± 0.10, 0.54 ± 0.11 and 0.41 ± 0.06, respectively. Comparison among the four groups found that collagen fiber content progressively decreased from the hypo-intense group to the homogeneous hyper-intense group (p=.000). Paired comparison showed that the collagen fiber content of the hypo-intense group was higher than that of the heterogeneous intense and homogeneous hyper-intense groups (p=.021/.000), the isointense group’s collagen fiber content was higher than that of the heterogeneous intense and homogeneous hyper-intense groups (p=.029/.000) and the heterogeneous intense group’s collagen fiber content was higher than that of the homogeneous hyper-intense group (p=.002). The remaining differences were not statistically significant ().
Correlation analysis of histopathological characteristics and necrotic tissue volume
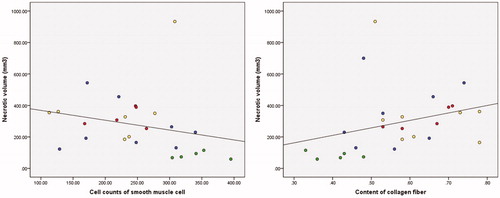
In order to clarify the relationship between HIFU efficacy and histopathological characteristics, we analyzed the correlation between necrotic tissue volume, SMC count and collagen fiber content. The results showed that SMC count negatively correlated with necrotic tissue volume (R= −0.488, p=.013); collagen fiber content was positively correlated with necrotic tissue volume (R = 0.534, p=.005) ().
Figure 8. Correlation between necrotic tissue volume and histopathological characteristics. (A) Necrotic volume and SMC count and (B) Necrotic volume and collagen fiber content. Red spots: hypo-intense; yellow spots: isointense; blue spots: heterogeneous intense; green spots: homogeneous hyper-intense.
Discussion
Due to the thermal, cavitation and mechanical effects induced by focused lower doses of in vitro ultrasound on the target area, HIFU can cause instant and irreversible coagulative necrosis in the targeted lesion without affecting the surrounding tissues [Citation2]. HIFU had been reported as early as in 2002 for the treatment of uterine fibroids [Citation20]. The latest data from 2018 show that more than 80,000 uterine fibroid patients received HIFU treatment, accounting for 41% of all patient cohorts undergoing HIFU therapy [Citation21]. The safety and efficacy of HIFU in treating uterine fibroids have been widely verified.
For the comparisons we made between groups in this study, we applied neither the 3-type classification adopted by Funaki nor the 5-category method invented [Citation5,Citation22]. Based on our previous research on the biophysical characteristics of uterine fibroids with different signal types, we believe that Funaki’s classification of uterine fibroids with high-intensity signal intensity on T2-weighted MRI was too general. Further, many features of fibroids with slightly and markedly homogeneous hyper-intense signals were similar based on Zhao’s classification. Therefore, we decided to combine both categories and classify fibroids into four groups, namely, hypo-intense, isointense, heterogeneous intense and homogeneous hyper-intense groups. The results of in vitro irradiation of specimens showed that the necrotic tissue volume gradually decreased from the hypo-intense group to the homogeneous hyper-intense group, which is consistent with the results of Zhao et al.’s study [Citation5].
Quantitative analysis of histopathological components showed that SMC count progressively increased but collagen fiber content progressively decreased from the hypo-intense group to the homogeneous hyper-intense group. The SMC count in different fibroid types does not directly affect the acoustic and thermal properties of tissues and this effect may be attributable to the fact that the histological composition (water content, collagen fiber content, etc.) and structure mentioned above are different in different types of myomas. Zhao et al. [Citation13] found that the moisture content of leiomyomas with markedly homogeneous hyper-intense signal intensity on T2-weighted MRI was significantly higher than in fibroids with a hypo-intense signal. The ultrasonic absorption coefficient of water is much lower than that of soft tissue, so the attenuation is lower in tissue with high water content [Citation23]. Moisture content also plays an important role in influencing histo-thermal properties. Liang et al. [Citation24] measured the thermal conductivity of biological tissue by using linear heat-source method. Their results showed that tissues with more water content had higher thermal conductivity. Bhavaraju and Valvano’s study [Citation25] on the myocardial tissue of swine derived a similar conclusion. Zhang et al. [Citation26] analyzed the spatiotemporal temperature distribution during the cooling period after HIFU ablation in order to calculate the thermal conductivity and found that the thermal conductivity of one fibroid with hyper-intense signal intensity on T2-weighted MRI was higher than that of other fibroids. They speculated that this elevation in thermal conductivity may be caused by the presence of fluids in the fibroid’s center due to degeneration, which leads to augmentation of water content. Static modulus of collagen fiber elasticity is 1000 times higher than that of other tissue components, so when the ultrasound penetrates the collagen fiber, the acoustic velocity is high, which easily generates reflection and scattering [Citation27], causing maximal acoustic attenuation when ultrasound waves pass through this type of fibroid. To investigate thermal properties, Tiktopulo and Kajava [Citation28] studied the type I collagen fibrils and found that the denaturation of fibrils, in contrast to that in monomeric collagen, was accompanied with significant increase in specific heat capacity. The above conclusions are consistent with the results in this study.
Due to the reasons listed above, compared with normal fibroids, the acoustic attenuation of cellular leiomyomas is lower under focused ultrasound irradiation. Its ability to convert ultrasound energy into thermal energy and efficiency in causing coagulation necrosis of target tissue is lower as well, ultimately leading to worse therapeutic effects of HIFU treatment. The correlation analysis in this study confirmed this deduction. The results showed that the necrotic tissue volume was negatively correlated with the SMC count but positively correlated with the collagen fiber content.
A limitation of this study is the failure to consider the influence of blood supply on the efficacy of HIFU treatment, which is an important factor impacting the HIFU therapeutic effect and is a well-researched area. One study conducted by Fan et al. [Citation29] demonstrated that non-perfusion volume ratio (NPVR) was negatively correlated with enhancement type on T1 weighted image. Further, a study by Keserci and Duc [Citation30] showed that NPVR is very strongly correlated with T1 perfusion-based classification, and that blood perfusion may be a major factor affecting temperature rise in MRI-guided focus ultrasound. However, the effect of perfusion could not be simulated in this in vitro study. In a future study, we will conduct in vivo experiments to investigate the biophysical characteristics of fibroid tissue for a more precise evaluation of the influence of different biophysical factors on the therapeutic efficacy of HIFU treatment. Another limitation of this study is that the differences of signal intensity on MRI of in vivo uterine fibroids and in vitro specimens were not explored. Lack of blood supply after tissue resection may affect the manifestation of fibroids on T2-weighted MRI. This issue will also require further clarification.
Conclusions
Under the same HIFU irradiation parameters, necrotic tissue volume gradually decreased from the hypo-intense group to the homogeneous hyper-intense group. Results of histopathological characteristics showed that SMCs gradually increased but collagen fiber content progressively decreased from the hypo-intense group to the homogeneous hyper-intense group. The histopathological characteristics of uterine fibroids are associated with HIFU efficacy. Therefore, we speculate that differences in histopathological characteristics may be one of the reasons for different therapeutic effects of HIFU ablation on uterine fibroids with different signal intensities on T2-weighted MRI.
Disclosure statement
There are no potential or actual, personal, political or financial interests by any of the authors in the material, information or techniques described in this article.
Additional information
Funding
References
- Stewart EA. Uterine fibroids. Lancet. 2001;357:293–298.
- Halpern EJ. Science to practice: high-intensity focused ultrasound ablation: will image-guided therapy replace conventional surgery? Radiology. 2005;235:345–346.
- Koji M, Takamichi M, Atsuya O, et al. Magnetic resonance imaging-guided focused ultrasound ablation of uterine fibroids: early clinical experience. Radiat Med. 2008;26:198–205.
- Funaki K, Fukunishi H, Sawada K. Clinical outcomes of magnetic resonance-guided focused ultrasound surgery for uterine myomas: 24-month follow-up. Ultrasound Obstet Gynecol. 2009;34:584–589.
- Zhao WP, Chen JY, Zhang L, et al. Feasibility of ultrasound-guided high intensity focused ultrasound ablating uterine fibroids with hyperintense on T2-weighted MR imaging. Eur J Radiol. 2013;82:e43–e49.
- Clark NA, Mumford SL, Segars JH. Reproductive impact of MRI-guided focused ultrasound surgery for fibroids: a systematic review of the evidence. Curr Opin Obstet Gynecol. 2014;26:151–161.
- Machtinger R, Inbar Y, Cohen-Eylon S, et al. MR-guided focus ultrasound (MRgFUS) for symptomatic uterine fibroids predictors of treatment success. Hum Reprod. 2012;27:3425–3431.
- Jagannathan J, Sanghvi NT, Crum LA, et al. High-intensity focused ultrasound surgery of the brain: part 1–A historical perspective with modern applications. Neurosurgery. 2009;64:201–210.
- Kennedy JE. High-intensity focused ultrasound in the treatment of solid tumours. Nat Rev Cancer. 2005;5:321–327.
- Holdsworth-Carson SJ, Zaitseva M, Vollenhoven BJ, et al. Clonality of smooth muscle and fibroblast cell populations isolated from human fibroid and myometrial tissues. Mol Hum Reprod. 2014;20:250–259.
- Tanos V, Berry KE. Benign and malignant pathology of the uterus. Best Pract Res Clin Obstet Gynaecol. 2018;46:12–30.
- Peng S, Zhang L, Hu L, et al. Factors influencing the dosimetry for high intensity focused ultrasound(HIFU)ablation of uterine fibroids: a retrospective study. Medicine (Baltimore). 2015;94:e650.
- Zhao WP, Chen JY, Chen WZ. Effect of biological characteristics of different types of uterine fibroids, as assessed with T2-weighted magnetic resonance imaging, on ultrasound-guided high-intensity focused ultrasound ablation. Ultrasound Med Biol. 2015;41:423–431.
- Shen SH, Fennessy F, McDannold N, et al. Image-guided thermal therapy of uterine fibroids. Semin Ultrasound CT MR. 2009;30:91–104.
- Hricak H, Tscholakoff D, Heinrichs L, et al. Uterine leiomyomas: correlation of MR, histopathologic findings, and symptoms. Radiology. 1986;158:385–391.
- Yamashita Y, Torashima M, Takahashi M, et al. Hyperintense uterine leiomyoma at T2-weighted MR imaging: differentiation with dynamic enhanced MR imaging and clinical implications. Radiology. 1993;189:721–725.
- Okizuka H, Sugimura K, Takemori M, et al. MR detection of degenerating uterine leiomyomas. J Comput Assist Tomogr. 1993;17:760–766.
- Ha HK, Jee MK, Lee HJ, et al. MR imaging analysis of heterogeneous leiomyomas of the uterus. Front Biosci. 1997;2:f4–12.
- Böni RA, Hebisch G, Huch A, et al. Multiple necrotic uterine leiomyomas causing severe puerperal fever: ultrasound, CT, MR, and histological findings. J Comput Assist Tomogr. 1994;18:828–831.
- Wang W, Liu WY, Zhou JM, et al. Treatment of symptomatic leiomyomata with high intensity focused ultrasound: a preliminary clinical study. Chin J Ultrasonography. 2002;11:161–163.
- Focused Ultrasound Foundation. State of the field 2017. Charlottesville (VA): Focused Ultrasound Foundation; 2017.
- Funaki K, Fukunishi H, Funaki T, et al. Mid-term outcome of magnetic resonance-guided focused ultrasound surgery for uterine myomas: from six to twelve months after volume reduction. J Minim Invasive Gynecol. 2007;14:616–621.
- Wang ZB, Li FQ, Fen N, et al. Principles and applications of therapeutic ultrasound. Nanjing, China: Nanjing University Press; 2008.
- Liang XG, Ge XS, Zhang YP, et al. A convenient method of measuring the thermal conductivity of biological tissue. Phys Med Biol. 1991;36:1599–1605.
- Bhavaraju NC, Valvano JW. Thermophysical properties of swine myocardium. Int J Thermophys. 1999;20:665–676.
- Zhang J, Fischer J, Warner L, et al. Noninvasive, in vivo determination of uterine fibroid thermal conductivity in MRI-guided high intensity focused ultrasound therapy. J Magn Reson Imaging. 2015;41:1654–1661.
- Feng N, Wang ZB, Wang JX, et al. Practical ultrasonic therapeutics. Beijing, China: Scientific and Technical Documents Publishing House; 2002.
- Tiktopulo EI, Kajava AV. Denaturation of type I collagen fibrils is an endothermic process accompanied by a noticeable change in the partial heat capacity. Biochemistry. 1998;37:8147–8152.
- Fan HJ, Cun JP, Zhao W, et al. Factors affecting effects of ultrasound guided high intensity focused ultrasound for single uterine fibroids: a retrospective analysis. Int J Hyperthermia. 2018;14:1–7.
- Keserci B, Duc NM. The role of T1 perfusion-based classification in predicting the outcome of magnetic resonance-guided high-intensity focused ultrasound treatment of adenomyosis. Int J Hyperthermia. 2018;34:306–314.