
 ?Mathematical formulae have been encoded as MathML and are displayed in this HTML version using MathJax in order to improve their display. Uncheck the box to turn MathJax off. This feature requires Javascript. Click on a formula to zoom.
Abstract
Purpose: This study aimed to evaluate the effects of various computed tomography (CT) acquisition parameters and metal artifacts on CT number measurement for CT thermometry during CT-guided thermal ablation.
Methods: The effects of tube voltage (100–140 kVp), tube current (20–250 mAs), pitch (0.6–1.5) and gantry rotation time (0.5, 1.0 s) as well as metal artifacts from a radiofrequency ablation (RFA) needle on CT number were evaluated using liver tissue equivalent polyacrylamide (PAA) phantom. The correlation between CT number and temperature from 37 to 80 °C was studied on PAA phantom using optimum CT acquisition parameters.
Results: No statistical significant difference (p > 0.05) was found on CT numbers under the variation of different acquisition parameters for the same temperature setting. On the other hand, the RFA needle has induced metal artifacts on the CT images of up to 8 mm. The CT numbers decreased linearly when the phantom temperature increased from 37 to 80 °C. A linear regression analysis on the CT numbers and temperature suggested that the CT thermal sensitivity was –0.521 ± 0.061 HU/°C (R2 = 0.998).
Conclusion: CT thermometry is feasible for temperature assessment during RFA with the current CT technology, which produced a high CT number reproducibility and stable measurement at different CT acquisition parameters. Despite being affected by metal artifacts, the CT-based thermometry could be further developed as a tissue temperature monitoring tool during CT-guided thermal ablation.
Introduction
Thermal ablation has been widely accepted as minimally invasive curative treatment for liver tumors since its acceptance into clinical practice in the 1990s [Citation1,Citation2]. Several thermal therapies such as radiofrequency ablation (RFA), microwave ablation, high intensity focused ultrasound (HIFU) and laser ablation [Citation3–6] are available in clinical routine for unresectable liver tumors. Among these different thermal ablation treatments, RFA has been regarded as the most effective percutaneous technique for primary or metastatic liver cancer. Hepatic RFA requires a complete tumor coagulation together with a clinical safety margin of at least 5–10 mm for curative intention. Thermal-induced coagulative necrosis of the tissue is achieved above 56 °C where a complete protein denaturation occurs [Citation7]. Hence, the tumor tissue should be heated to more than 56 °C while the surrounding healthy tissues and blood vessels should be lower than 40 °C during the hepatic RFA [Citation8]. Failure to control the temperature distribution during hepatic RFA may cause incomplete tumor ablation or thermal damage to the surrounding structures. This may lead to tumor recurrence while the thermal damage to the surrounding structures may induce several major complications such as pleural and gastrointestinal perforations, laceration of vessels with bleeding, thermal collateral damage with bile duct stenosis, biloma, gastrointestinal inflammation and subsequent perforation [Citation9–11].
In view of the above, the assessment of tissue temperature during the RFA procedure is crucial to optimize treatment outcomes. Although invasive interstitial thermometry can be used to monitor the temperature of the ablation zone, this method can only be performed at a limited points in the liver and it is not clinically practical [Citation12,Citation13]. Therefore, several noninvasive methods such as magnetic resonance imaging (MRI)-based thermometry, ultrasound thermometry, microwave-based thermometry and CT-based thermometry are being explored for accurate temperature assessment in clinical application [Citation8,Citation14]. However, these methods struggle some constraints which restrict their feasibility on hepatic RFA. Ultrasound-based and microwave-based thermometry are not favored as these methods are vulnerable to motion and mis-registration artifacts in moving and refilling organs such as liver [Citation8]. On the other hand, MRI-based thermometry has been regarded as the most promising noninvasive method for temperature mapping. Several different approaches such as exploitation of T1-relation time or proton resonance frequency shift dependence on temperature have been evaluated [Citation15]. Despite its promising potential, the MRI-based thermometry has been hampered by its higher cost of operation and limited availability of MR-compatible instruments [Citation16]. In comparison to the MRI-based thermometry, CT-based thermometry is more economic and it is not limited by the availability of compatible instruments. Furthermore, CT-based thermometry is capable of offering an almost real-time temperature assessment during hyperthermia treatment [Citation17].
The idea of CT number dependence on temperature was conceived more than three decades ago where a temperature-dependent shift of CT number was observed in water and biological tissues. The CT number is a measurement of the ability of a material to attenuate X-ray photons and generally expressed in dimensionless Hounsfield Units (HU) using the following equation:
where μwater is the linear X-ray attenuation coefficient of water while μobject is the average linear attenuation coefficient of the material. X-ray attenuation in CT scan is mainly due to Compton scattering effects. The probability of Compton interaction is proportional to the physical density of the material/tissues. Therefore, the change in material/tissue density with temperature due to thermal expansion indicates that there is a direct relationship between temperature and variation of CT number.
However, the repeatability and reproducibility of the CT number measurements with the older generation CT technology could not be guaranteed and thus limited the development of CT-based thermometry [Citation18]. Recent development in the modern CT scanners has improved the stability and repeatability of CT number measurements and thus has encouraged the development of CT-based thermometry [Citation16]. The relationship between CT number and temperature has been investigated on different water equivalent phantoms and different biological tissues such as bovine and swine liver [Citation18]. Despite the advantages of the CT-based thermometry, radiation dose remains as a concern for the application of CT-based thermometry during thermal therapy. The radiation dose should be optimized to avoid any stochastic effects and tissue reaction due to excessive radiation exposure. Several CT acquisition parameters such as tube current (mA), tube voltage (kVp), pitch, gantry rotation time (s) and reconstructed slice thickness (mm) have been known to affect radiation dose during CT scanning [Citation19]. Therefore, the effects of these parameters on the variation of CT numbers and image quality have been investigated in this study using a liver tissue equivalent polyacrylamide (PAA) phantom. In addition, the effects of metal artifacts from RFA needle and temperature on the variation of CT numbers were also investigated using the PAA phantom to determine the feasibility of CT-based thermometry for temperature assessment.
Materials and methods
Preparation of the liver tissue equivalent polyacrylamide (PAA) gel phantom
The liver tissue equivalent PAA phantom used in this study was prepared according to the procedure described by Dabbagh et al. [Citation20]. The acrylamide monomer, N′, N′-methylene-bis-acrylamide (bis-acrylamide), sodium chloride (NaCl), N,N,N′,N′-tetra-metyl-ethylenediamine (TEMED) and ammonium persulfate (APS) were procured from Sigma Aldrich (St Louis, MO). Briefly, 7.5 g of acrylamide, 0.05 g of bis-acrylamide, 0.25 g of NaCl and 0.25 mL of TEMED were dissolved in deionized water to a total volume of 45 mL. For the best transparency of the phantom, the mixture was degassed under reduced pressure for 15 min. Then, 5 mL of 1.3% (w/v) APS solution was added to the reaction mixture and the exothermic polymerization reaction begins. The mixture was then poured into a 60 mL container and allowed to polymerize for 24 h at room temperature. For precaution note, the acrylamide monomer is a severe neurotoxin that causes severe health hazards. Therefore, usage of this reagent requires extreme precautionary measures.
Effects of CT acquisition parameters on CT numbers
The effects of different CT acquisition parameters such as tube potential voltage, tube current, pitch and gantry rotation time on the stability and repeatability of CT number were studied using a PAA phantom. The CT scan on 6 PAA phantoms was performed using a 128 slices multi-detector CT scanner (SOMATOM Definition, Siemens AG- Healthcare, Germany) with different potential voltage (100, 120, 140 kVp), tube current (20, 50, 70, 150, 250 mAs), pitch (0.6, 0.8, 1.0, 1.2, 1.5) and gantry rotation time (0.5, 1.0 s). The CT images acquired were reconstructed to 1 mm, 5 mm and 10 mm slices thickness using the reconstruction kernel on dedicated workstation. A circular region of interest (ROI) of approximately 20 mm2 (image matrix size of approximate to 1200 pixels) was manually drawn in the reconstructed CT images to obtain the CT number and the standard deviation (noise level) of the CT number was also recorded. Each phantom was scanned three times and the average value was reported.
Effects of metal artifacts on CT numbers
The effects of metal artifacts from the RFA needle on CT numbers were studied using the PAA phantom with the RFA needle inserted vertically into the center of the PAA phantom. The tube potential voltage (120 kVp), tube current (automatic exposure control), pitch (0.6) and gantry rotation time (1.0 s) were used to acquire the CT image. The acquired images were reconstructed to 1 mm, 5 mm and 10 mm slice thickness using the reconstruction kernel on dedicated workstation. A circular ROI of approximately 20 mm2 was manually drawn beside the RF electrode in the reconstructed CT images and the ROI was drawn into next slices until CT number of the phantoms becomes unchanged. The CT number obtained for each ROI was used to determine the thickness of slices affected by the metal artifacts.
Effects of tissue temperature on CT numbers
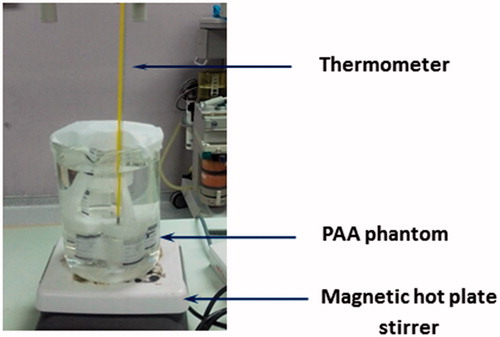
The PAA phantoms were incubated at desired temperature (37, 50, 60, 70 and 80 °C) for 15 min to achieve thermal equilibrium before scanned using standard protocol for clinical abdomen CT scanning (i.e., 120 kVp, automatic exposure control for mAs and pitch 0.6). shows the experimental setup during the thermal equilibrium of the PAA phantoms at different temperatures. The obtained CT images obtained were reconstructed to 1 mm, 5 mm and 10 mm slice thicknesses. The circular ROI was manually drawn on image to obtain the CT number. The CT number of the PAA phantoms were plotted against the temperature and the linear regression analysis was used to study the correlation between the CT number and the temperature.
Figure 1. Experimental setup during the thermal equilibrium of the PAA phantoms at different temperatures.
Statistical analysis
CT numbers obtained were expressed as mean value ± standard deviation. One-way analysis of variance (ANOVA) or paired samples t-test was used to compare the mean CT numbers obtained and the differences were considered as significant when p < 0.05. All statistical analysis was performed using Statistical Product and Service Solutions (SPSS version 22.0, IBM, Armonk, NY).
Results
shows the effects of tube voltage, tube current, pitch and gantry rotation time on the CT numbers of the PAA phantom at 1, 5 and 10 mm reconstructed slice thickness. The mean CT number of all three reconstructed slices thickness was found at 50.76 ± 0.87 HU, 50.94 ± 0.65 HU and 51.54 ± 0.55 HU for 100, 120 and 140 kVp, respectively (). Overall, variation in the CT numbers at different tube voltages was not significant (p = 0.507). shows the image noise (standard deviation) of the CT image as a function of tube voltage. The CT image noise decreased from 6.99 HU to 4.51 HU in 1 mm reconstructed slice thickness when the tube voltage increased from 100 to 140 kVp, suggesting the image noise reduced at higher tube voltage. In addition, the image noise was also slightly reduced by reconstructing the CT image into a bigger slice thickness; e.g., Image noise reduced from 5.44 HU to 2.56 HU with the increase of slice thickness from 1 mm to 10 mm at 120 kVp.
Figure 2. CT numbers of the PAA phantom obtained with three different CT reconstruction slice thickness of 1 mm (black, solid square), 5 mm (red, open circle) and 10 mm (blue, cross) correspond to different CT acquisition parameters: (A) tube voltage, (B) tube current, (C) and (D) shows the CT image noise corresponds to the tube voltage and tube current, respectively. (E) pitch and (F) gantry rotation time.
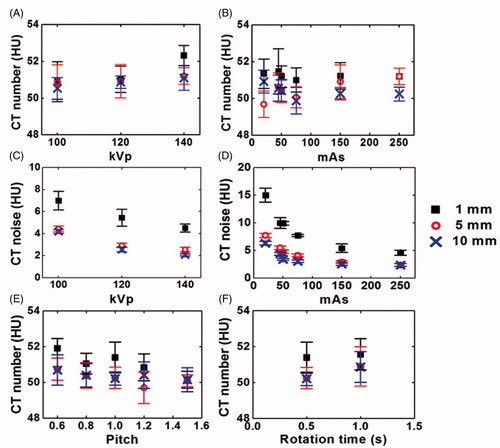
The effect of tube current on CT numbers of the PAA phantom can be seen from . The mean CT number of three slice thicknesses for different tube current was found identical to each other (p = 0.349). For example, the highest CT number was obtained at 250 mAs (50.89 ± 0.42 HU) while the lowest CT number was achieved at 50 mAs (50.31 ± 0.65 HU). The image noise of the CT image as the function of tube current are given in the , showing an intensive decrease in the image noise at higher tube voltage. Similar to those observed earlier, lower image noise was observed with image of higher slice thickness. shows the effect of different pitches on the CT numbers. Variation in the CT numbers at different pitches is found negligible (p = 0.095). shows the CT numbers of the PAA phantom at different gantry rotation time. The difference in the CT numbers at different slices thickness was also not significantly different (p = 0.196) when gantry rotation time increased from 0.5 s to 1.0 s.
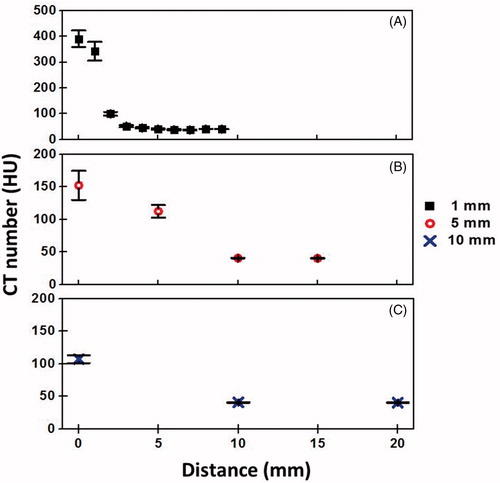
The effect of metal artifacts on the reconstructed CT images for slice thicknesses of 1 mm, 5 mm and 10 mm was shown in . In the figure, streaking artifacts is found greater in 1 mm reconstructed image compared to those observed in 5 mm and 10 mm reconstructed images. The metal artifacts induced by the metal RF needle have increased the CT numbers of the PAA phantom near to the needle (). The CT number of the phantom without the insertion of the needle at 41.42 HU, 41.28 HU and 40.82 HU for slice thickness of 1 mm, 5 mm and 10 mm, respectively, were set as reference CT number for the PAA phantom. In the 1 mm reconstructed image, 8 slices (equivalent to 8 mm thickness) were affected by the metal artifacts as only the CT number of the eighth and ninth slices (41.15 ± 0.64 and 40.95 ± 0.64, respectively) were similar to the CT number of the PAA phantom (p > 0.05). The number of image slices affected by the metal artifacts was reduced to 2 slices and 1 slice in the 5 mm and 10 mm reconstructed images, respectively, which was corresponded to 10 mm thickness.
Figure 3. Effects of metal artifacts on the CT images for three set of different reconstructed slice thicknesses: (A) 1 mm, (B) 5 mm and (C) 10 mm, respectively. The targeted circular area shows the CT number on the particular ROI.
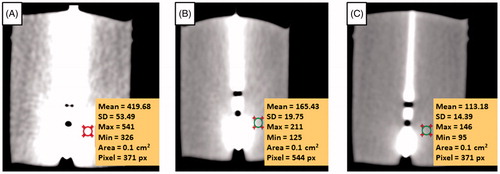
Figure 4. Effects of metal artifacts on CT number at 1 mm (A), 5 mm (B) and 10 mm (C) slice thickness. Zero value in x-axis indicates the position of RF needle, which has induced the highest CT number due to metal artifacts. The reference CT numbers of the phantom are 41.42 HU, 41.28 HU and 40.82 HU for 1 mm, 5 mm and 10 mm reconstructed slice thickness, respectively.
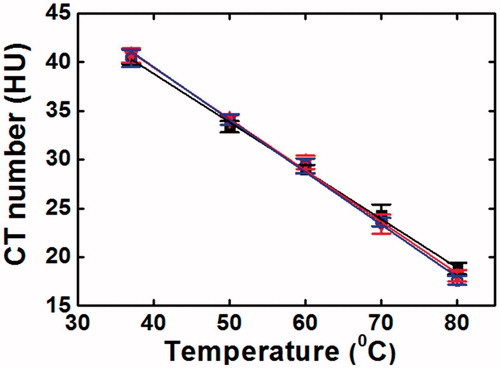
shows the dependence of the CT number on temperature. The CT numbers obtained from the images of different slice thickness decreased linearly when the tissue (phantom) temperature increased from 37 °C to 80 °C. The CT thermal sensitivity for 1 mm, 5 mm and 10 mm reconstructed images were –0.503 ± 0.059 HU/°C (R2 = 0.998), –0.527 ± 0.081 HU/°C (R2 = 0.997) and –0.533 ± 0.064 HU/°C (R2 = 0.997), respectively.
Figure 5. Dependence of CT number on tissue temperature obtained in the PAA phantom for 1 mm (black, solid square), 5 mm (red, open circle) and 10 mm (blue, cross) reconstructed slice thickness. The solid line represents a least-square linear fit to the all data (n = 15).
Discussion
Manipulation of the several CT acquisition parameters such as tube current, tube voltage, gantry rotation time and pitch has been reported to reduce the radiation dose during CT scanning [Citation19,Citation21]. However, the adjustment of these parameters might cause some variations in image quality and CT number measurements. Part of this study was taken to investigate the effects of these parameters on CT numbers measurement. X-ray tube voltage (kVp) controls the penetrating power of the X-rays by varying the average photon energy while X-ray tube current (mAs) determines the rate of X-ray production and number of photons produced [Citation22]. Generally, radiation exposure changes with the square of tube voltage. For example, radiation dose reduced by 33% and 65% when the tube voltage reduced from 120 to 100 kVp and from 120 to 80 kVp, respectively [Citation23,Citation24]. On the other hand, there is a linear relationship between tube current and radiation dose where radiation dose is directly proportional to the mAs [Citation19]. However, reduction of kVp and mAs may result in lower image quality due to higher image noise; hence increase the variations of CT numbers measurement. In this study, the variation of CT numbers acquired at different kVp and mAs was within 2 HU and the differences were not statistically significant. This was in a good agreement with Schena et al.’s work, in which low dependency of CT thermal sensitivity on both kVp and mAs was observed in their water-equivalent phantom [Citation25]. Although image noise increased when the tube voltage and current decreased, these can be overcome by reconstructing the CT images in to a thicker slice thickness. This method is further supported by earlier reports suggesting that thicker slice thickness could reduce image noise due to increased number of photons within each voxel [Citation19,Citation22,Citation26].
The pitch and gantry rotation time are important parameters in modern CT scanners. They can affect image noise and thus the CT numbers measurement [Citation27]. Pitch in multidetector, spiral CT is defined as table travel per rotation divided by beam collimation. Generally, pitch of lesser than 1.0 suggesting an overlap between adjacent acquisitions while a pitch of more than 1.0 indicating gaps between adjacent acquisitions. A pitch of 1.0 implies that the acquisitions are contiguous with neither overlap nor gaps [Citation28]. In view of this, overlap of anatomy at lower pitch will increase the sampling at each location and thus increase the radiation exposure. On the contrary, gaps in the anatomy at larger pitch will lower the radiation exposure if other CT acquisition parameters remained unchanged [Citation28,Citation29]. Radiation exposure has also been reported to be proportional with the increase in gantry rotation time [Citation21]. From this study, the CT numbers of the PAA phantom only experienced mild changes at different pitch and gantry rotation time and the differences were not statistically significant (p > 0.05). In addition, the CT numbers acquired using different slice thickness was also not statistically significant different. The additional radiation exposure due to the application of CT thermometry remains a concern for its clinical use during RFA procedure. Nevertheless, the radiation exposure can be optimized by adjusting the CT acquisition parameters, which requires another separate study in the near future.
Metal artifact occurs due to several mechanisms including beam hardening, scatter effects and Poisson noise. The beam hardening and scatter effects resulted in dark streaks between metal with surrounding bright streaks [Citation26]. Presence of metal artifacts from the RFA needle has affected the CT numbers measurement of up to 8 mm thickness in 1 mm reconstructed CT images, and 10 mm in both 5 mm and 10 mm reconstructed CT images. Generally, CT numbers of the tissues that is 10 mm away from the RFA needle was not affected by metal artifacts. There are many commercial software currently available to reduce metal artifacts that are originated from geometrically well-defined objects such as a puncture needle [Citation16,Citation26]. However, some of these metal artifacts reduction algorithms are not completely dependable for quantitative evaluation and hence cannot be used accurately to determine the tissue CT numbers in CT-based thermometry. Selection of these algorithms should be performed under careful consideration to avoid inaccuracy of CT numbers measurement.
Previous reports have shown that there is an excellent correlation between CT numbers and electron density while a good correlation has been observed between the CT numbers and physical density of the material [Citation30–32]. In this study, the CT numbers of the PAA phantom decreased linearly with the increase of tissue temperature. It is well-known that the physical density of a material decreases when the temperature increases as the volume of the material increases at higher temperature due to the molecules are further apart. Hence, when the PAA phantom was scanned at higher temperature, the thermally induced reduction in electron density was expected to occur although there was no change in the atomic composition. A CT thermal sensitivity of –0.521 ± 0.061 HU/°C (R2 = 0.998) has been found using liver tissue equivalent PAA phantom, which was in accordance to the CT thermal sensitivities of ex-vivo bovine liver (–0.60 ± 0.026 and –0.65 ± 0.05 HU/°C) [Citation33,Citation34] and swine liver (–0.54 ± 0.03 and –0.52 ± 0.02 HU/°C) carried out in other studies [Citation8,Citation35]. The obtained CT thermal sensitivity was also in agreement with the values found using swine muscle tissue and water equivalent phantom [Citation36]. Despite certain degrees of similarity, the difference in the CT thermal sensitivity has been observed, which can be ascribed to the different CT acquisition parameters used in different studies [Citation25]. In addition, the density of different materials will be affected by temperature differently due to the variation in thermal expansion coefficient, which may be responsible for the difference in the obtained CT thermal sensitivity [Citation36].
Studies on the feasibility and potential of CT-based thermometry had been carried out for in-vivo temperature mapping during thermal ablation [Citation8,Citation18,Citation33,Citation34]. However, different thermal sensitivity values were observed from different studies due to several factors, such as employment of different study protocols, variations in the liver tissue composition, use of different heating procedures [Citation33,Citation34] as well as inter and intra-scanner variability of CT number measurements [Citation18]. Although biological tissues remains the ideal medium for experiment due to its closer approximation to the clinical conditions, several limitations have been experienced due to difficulties in the preparation, handling, maintenance and standardization of the samples [Citation20]. In addition, the inhomogeneous structure of real tissues may also increase variation in the CT numbers measurement. Therefore, tissue equivalent or mimicking phantom that is closely representing the physical and geometrical properties of target tissue plays an important role in pre-clinical assessment [Citation20]. The use of liver tissue equivalent PAA phantom was favored in this study to minimize the variation from the composition of the liver tissue such as pathological conditions, inhomogeneity and present of different structures such as blood vessels that could eventually altered the accuracy of CT number measurements. As thermal sensitivity is known to be affected by different study protocols, the effects of different CT image acquisition parameters and metal artifacts on the CT number measurements were examined. The relationship between CT number and temperature was investigated using PAA phantom equilibrated at different temperature with heating water bath method to avoid variation due to different heating procedures.
Although the effects of different CT acquisition parameters and metal artifacts on the CT number measurements as well as the relationship of CT number and temperature have been studied, several improvements are needed in future studies before the establishment of CT-based thermometry in clinical settings. The PAA phantom employed in this study does not represent the in-vivo tissue as the physiological characteristics are somehow different from the real liver tissues. Moreover, the PAA phantom could not simulate the structural and morphological changes experienced in biological tissue during thermal ablation process [Citation37–39], which will affects the CT thermal sensitivity obtained. Hence, future studies need to be carried out in-vivo to validate the CT thermal sensitivity obtained from this study as other experimental variables such as motion artifacts and heat sink effect due to blood perfusion are crucial to be take into consideration. The manual measurements of CT numbers from the CT images were performed using a small circular ROI, which could lead to increment of uncertainties and thus affecting the results. Therefore, a more accurate and robust method should be used in future studies for CT numbers measurement. The software or algorithm should be performed automatically or systematically to avoid bias from the observers.
Conclusion
The CT numbers obtained with current CT technology are stable, repeatable and independent of different CT acquisition parameters such as tube voltage, tube current, pitch and gantry rotation time. However, metal artifacts from the RFA needle remain a predominant factor affecting the CT numbers measurement for CT-based thermometry purpose. The metal artifacts were seen up to 10 mm surrounding the RFA needle. Therefore, CT number measurements should be made at least 10 mm away from the RFA needle for more accurate data. The assessment of thermal sensitivity in liver equivalent PAA phantom showed a linear dependence on temperature up to 80 °C. A CT thermal sensitivity of –0.521 ± 0.061 HU/°C (R2 = 0.998) was obtained from this study. Despite the limitations of the several CT image artifacts, CT-based thermometry could be further developed and may be of potential use during thermal therapy to improve treatment outcomes.
Acknowledgements
The authors thank the Faculty of Medicine, University of Malaya for providing necessary facilities to carry out this work. Tan D. acknowledge the support from the Taylor’s University Postgraduate Scholarship Scheme.
Disclosure statement
No potential conflict of interest was reported by the authors.
Additional information
Funding
References
- Rossi S, Di Stasi M, Buscarini E. Percutaneous RF interstitial thermal ablation in the treatment of hepatic cancer. Ajr Am J Roentgenol. 1996;167:759–768.
- Solbiati L, Ierace T, Goldberg SN, et al. Percutaneous US-guided radio-frequency tissue ablation of liver metastases: Treatment and follow-up in 16 patients. Intervent Radiol. 1997;202:195–203.
- Dick EA, Taylor-Robinson SD, Thomas HC, et al. Ablative therapy for liver tumours. Gut. 2002;50:733–739.
- Liang P, Wang Y, Yu X, et al. Malignant liver tumors: treatment with percutaneous microwave ablation-complications among cohort of 1136 patients. Radiology. 2009;251:933–940.
- Izzo F. Other thermal ablation techniques: microwave and interstitial laser ablation of liver tumors. Ann Surg Oncol. 2003;10:491–497.
- Wu F, Wang ZB, Chen WZ, et al. Advanced hepatocellular carcinoma: treatment with high-intensity focused ultrasound ablation combined with transcatheter arterial embolization. Radiology. 2005;235:659–667.
- Goldberg SN, Dupuy DE. Image-guided radiofrequency tumor ablation: challenges and opportunities-part I. J Vasc Interv Radiol. 2001;12:1021–1032.
- Pandeya G, Greuter M, Schmidt B, et al. Assessment of thermal sensitivity of CT during heating of liver: an ex vivo study. Br J Radiol. 2012;85:661–665.
- Choi H, Loyer EM, DuBrow RA, et al. Radio-frequency ablation of liver tumors: assessment of therapeutic response and complications. Radiographics. 2001;21:S41–S54.
- Livraghi T, Solbiati L, Meloni MF, et al. Treatment of focal liver tumors with percutaneous radio-frequency ablation: complications encountered in a multicenter study. Radiology. 2003;226:441–451.
- Rhim H, Dodd GD, 3rd, Chintapalli KN, et al. Radiofrequency thermal ablation of abdominal tumors: lessons learned from complications. RadioGraphics. 2004;24:41–52.
- van der Zee J, Peer-Valstar JN, Rietveld PJ, et al. Practical limitations of interstitial thermometry during deep hyperthermia. Int J Radiat Oncol Biol Phys. 1998;40:1205–1212.
- Wust P, Gellermann J, Harder C, et al. Rationale for using invasive thermometry for regional hyperthermia of pelvic tumors. Int J Radiat Oncol Biol Phys. 1998;41:1129–1137.
- Frich L. Non-invasive thermometry for monitoring hepatic radiofrequency ablation. Minim Invasive Ther Allied Technol. 2006;15:18–25.
- McDannold N. Quantitative MRI-based temperature mapping based on the proton resonant frequency shift: review of validation studies. Int J Hyperthermia. 2005;21:533–546.
- Mahnken AH, Bruners P. CT thermometry: will it ever become ready for use?. Int J Clin Pract Suppl. 2011;65:1–2.
- Fallone BG, Moran PR, Podgorsak EB. Noninvasive thermometry with a clinical x-ray CT scanner. Med Phys. 1982;9:715–721.
- Fani F, Schena E, Saccomandi P, et al. CT-based thermometry: an overview. Int J Hyperthermia. 2014;30:219–227.
- Raman SP, Mahesh M, Blasko RV, et al. CT scan parameters and radiation dose: practical advice for radiologists. J Am Coll Radiol. 2013;10:840–846.
- Dabbagh A, Abdullah BJ, Abu Kasim NH, et al. Reusable heat-sensitive phantom for precise estimation of thermal profile in hyperthermia application. Int J Hyperthermia. 2014;30:66–74.
- Honda O, Yanagawa M, Hata A, et al. Influence of gantry rotation time and scan mode on image quality in ultra-high-resolution CT system. Eur J Radiol. 2018;103:71–75.
- Rhee DJ, Kim SW, Jeong DH, et al. Effects of the difference in tube voltage of the CT scanner on dose calculation. J Korean Phys Soc. 2015;67:123–128.
- Paul JF. Individually adapted coronary 64-slice CT angiography based on precontrast attenuation values, using different kVp and tube current settings: evaluation of image quality. Int J Cardiovasc Imaging. 2011;27:53–59.
- Gnannt R, Winklehner A, Eberli D, et al. Automated tube potential selection for standard chest and abdominal CT in follow-up patients with testicular cancer: comparison with fixed tube potential. Eur Radiol. 2012;22:1937–1945.
- Schena E, Fani F, Saccomandi P, et al. Feasibility assessment of CT-based thermometry for temperature monitoring during thermal procedure: influence of ROI size and scan setting on metrological properties. In: Proceeding of the 37th Annual International Conference of the IEEE Engineering in Medicine and Biology Society (EMBC), 2015, Milano, Italy: IEEE, 2015, p. 7893–6.
- Boas FE, Fleischmann D. CT artifacts: causes and reduction techniques. Imaging Med. 2012;4:229–240.
- Coursey CA, Frush DP. CT and radiation: what radiologists should know. Appl Radiol. 2008;37:22–29.
- Goldman LW. Principles of CT: multislice CT. J Nucl Med Technol. 2008;36:57–68. quiz 75–6.
- Mahesh M, Scatarige JC, Cooper J, et al. Dose and pitch relationship for a particular multislice CT scanner. AJR Am J Roentgenol. 2001;177:1273–1275.
- Mull RT. Mass estimates by computed tomography: physical density from CT numbers. AJR Am J Roentgenol. 1984;143:1101–1104.
- Phelps ME, Gado MH, Hoffman EJ. Correlation of effective atomic number and electron density with attenuation coefficients measured with polychromatic x rays. Radiology. 1975;117:585–588.
- Pech P, Bergstrom K, Rauschning W, et al. Attenuation values, volume changes and artifacts in tissue due to freezing. Acta Radiol. 1987;28:779–782.
- Pandeya G, Greuter M, de Jong K, et al. Feasibility of noninvasive temperature assessment during radiofrequency liver ablation on computed tomography. J Comput Assist Tomogr. 2011;35:356–360.
- Pandeya G, Klaessens H, Greuter M, et al. Feasibility of computed tomography based thermometry during interstitial laser heating in bovine liver. Eur Radiol. 2011;21:1733–1738.
- Schena E, Giurazza F, Massaroni C, et al. Thermometry based on computed tomography images during microwave ablation: trials on ex vivo porcineliver. In: IEEE International Instrumentation and Measurement Technology Conference (I2MTC), 2017. Turin, Italy: IEEE; 2017.
- Homolka P, Gahleitner A, Nowotny R. Temperature dependence of HU values for various water equivalent phantom materials. Phys Med Biol. 2002;47:2917–2923.
- Schena E, Saccomandi P, Giurazza F, et al. Experimental assessment of CT-based thermometry during laser ablation of porcine pancreas. Phys Med Biol. 2013;58:1–12.
- Weiss N, Goldberg SN, Sosna J, et al. Temperature-density hysteresis in X-ray CT during HIFU thermal ablation: heating and cooling phantom study. Int J Hyperthermia. 2014;30:27–35.
- Weiss N, Sosna J, Goldberg SN, et al. Non-invasive temperature monitoring and hyperthermic injury onset detection using X-ray CT during HIFU thermal treatment in ex vivo fatty tissue. Int J Hyperthermia. 2014;30:119–125.