
 ?Mathematical formulae have been encoded as MathML and are displayed in this HTML version using MathJax in order to improve their display. Uncheck the box to turn MathJax off. This feature requires Javascript. Click on a formula to zoom.
Abstract
Background: Increased facial warmth sensations could lead to thermal discomfort, and different facial regions may demonstrate concurrent temperature differences. The study aim was examining facial warmth sensitivity differences by facial region under differing environmental conditions.
Methods: Twelve men had heat flux measurements of six facial regions during 30 min each of rest in thermoneutral conditions (25 °C, 30% relative humidity (RH)), rest in warm conditions (40 °C, 30% RH), and cycling at 400 W of metabolic heat production (40 °C, 30% RH).
Results: The forehead demonstrated highest temperatures at termination of all study conditions; lowest temperatures were noted for the nose under thermoneutral conditions and chin during warmth and exercise conditions. Five of six facial regions demonstrated significant differences in warmth sensitivity, decreasing to two of six regions during warm conditions and one of six regions during exercise, with the upper lip most sensitive in all conditions. Body thermal comfort (TC) perceptions, regressed individually on mean facial temperature (Tface) vs. core temperature (Tco), indicated that Tface was significantly more related than Tco to perceived TC (p = .001). Perceived TC, regressed individually on perceived overall body thermal sensation (TS) vs. facial TS, demonstrated that Tface was significantly more related to perceived TC (p = .004).
Conclusion: There were regional differences in facial warmth sensitivity together with different facial temperatures moving toward equilibration when the body is subjected to heat-producing activities. Perceptions of TC were more strongly related to Tface than to Tco or overall body TS.
Introduction
The face has been observed to display high cutaneous thermosensitivity, in relation to local temperature sensations, that is influenced by its high density of thermal afferents [Citation1]. This finding may have practical consideration in the day-to-day activities of numerous individuals who wear close-fitting facial coverings of different configurations (medical masks, industrial respirators, welding masks, breathing resistance trainer masks, niqab, balaclava, keffiyeh, etc.) that may result in increased facial skin temperature and associated thermal discomfort, as well as affect compliance with the use of facial personal protective equipment [Citation2]. In order to undertake ameliorative measures for facial thermal discomfort, it would first be useful to determine if focal differences in facial thermosensitivity exist and, if so, the impact of physical activity and warm ambient conditions on these facial regions. The current study was undertaken by the National Institute for Occupational Safety and Health’s (NIOSH) National Personal Protective Technology Laboratory to examine if there were differences in facial warmth sensitivity between different facial areas during stages of thermoneutral and warm ambient conditions, as well as during exercise activities in a warm environment. Our hypothesis was that the warmth sensitivity determined in heat flux threshold would differ among facial regions more during thermoneutral ambient conditions, and that these differences would fade as the subjects progressed through passive warming and exercise.
Materials and methods
Subjects
Twelve healthy, nonsmoking men (age: 22 ± 2 years, height: 182.1 ± 9.2 cm, weight: 77.1 ± 9.6 kg, body mass index: 23.3 ± 2.3 kg·m2, VO2max: 56.1 ± 7.9 ml·kg·min−1) were recruited from the general population. Subjects underwent a medical screening by a licensed physician and also performed a maximal graded exercise test to assess potential underlying cardiac abnormalities and aerobic fitness. All mandatory laboratory health and safety procedures have been complied with in the course of conducting all experimental work reported in this study, and the study protocol was reviewed and approved by the NIOSH Institutional Review Board (IRB) (protocol# HSRB-10-NPPTL-02). Written informed consent was obtained from each subject prior to study participation that allowed for the inclusion of material pertaining to themselves, acknowledgement that they cannot be identified via this article, and that they have been fully anonymized.
Procedure
Subjects visited the testing laboratory on two occasions separated by at least three days, at the same time of morning each day, for familiarization and experimentation while abstaining from strenuous exercise and alcohol consumption at least 48 h prior to each scheduled visit. Subjects were also instructed to partake of only a light breakfast on test days.
During familiarization, subjects’ facial anthropometrics were measured for forehead length (trichion to glabella), face length (menton to sellion), face width (between zygomatic arches) and bigonial width (between gonions), using a calibrated fractional caliper. Anthropometric information was used to identify facial landmarks for the study instrumentation and treated as a controlling variable for statistical analysis, given that variations in facial skin temperature are related to, among other factors, differences in the size and shape of specific facial features [Citation3]. Subjects were then familiarized with the study protocol and measurements, including mode of exercise, warmth sensitivity test and subjective scales. A maximal exercise test (VO2max) was carried out with a cycle ergometer (VIAsprint 150P, Carefusion, Yorba Linda, CA). Consequently, an individual exercise intensity for 400 W of fixed metabolic heat production (MHP) was determined for the experimental trial, given that measuring oxygen (O2) consumption was not feasible due to sensor placements on the face. MHP was calculated as a metabolic rate (M) – external work load (W) in that;
where RER is the respiratory exchange ratio (ratio of carbon dioxide production and O2 consumption), ‘ec’ is the caloric equivalent of a liter O2 when carbohydrates are oxidized (21.1 kJ) and ‘ef’ is the caloric equivalent of a liter of O2 when fat is oxidized (19.6 kJ). The group mean (±standard deviation) MHP was 408.7 ± 8.2 W at W = 95 ± 10 W, which was approximately 30% of the subjects’ maximal exercise capacity.
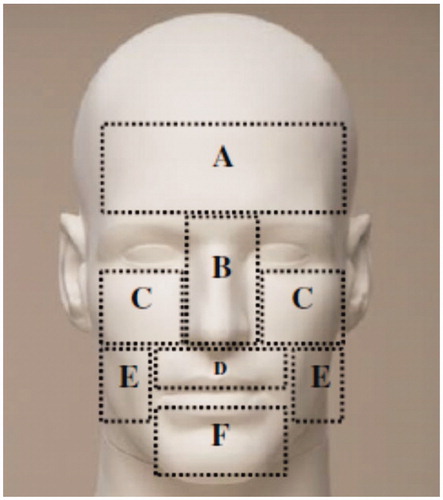
For the experimental trials, subjects were instructed to arrive with their face clean shaven. Upon arrival at the laboratory, subjects first self-inserted a flexible rectal thermistor (REF-4491, YSI temperature, Dayton, OH) 13 cm into the rectum to measure core body temperature (Tco), wore athletic attire (tee-shirts, shorts and shoes) and drank a controlled amount of water (5 ml·kg−1 body mass). Following a vital signs evaluation, subjects moved to an environmental chamber and rested on a chair for sensor instrumentation. For facial temperature measurements, the face was wiped with a cleanser tissue to remove oily substances; skin thermistors (ITP082-25, Nikkiso-Therm Co., Ltd., Tokyo, Japan) were then placed on the right side of six facial regions (), which were consequently utilized to calculate the unweighted mean facial temperature (Tface).
Figure 1. Six facial regions for the measurements of facial temperatures and warmth sensitivity. (A) forehead, (B) nose, (C) cheekbone, (D) upper lip, (E) cheek and (F) chin.
An additional four skin thermistors (T-type copper/constantan, Concept Engineering, Old Saybrook, CT) were affixed to other body sites (ipsilateral chest, forearm, thigh and calf) in order to calculate weighted mean skin temperature (Tsk) according to Ramanathan [Citation4].
Upon completion of sensor instrumentation, subjects practiced a warmth sensitivity test, after which the experimental protocol was commenced. Warmth sensitivity was defined as the difference in heat flux (HFdiff) between the commencement of the trial and the subject’s determination of a warmth sensation [Citation5]. The protocol consisted of a 30 min seated rest in a thermoneutral condition (25 °C, 30% relative humidity (RH), a 30 min seated rest in a warm condition (40 °C, 30% RH), and 30 min cycling exercise at the predetermined intensity for 400 W of MHP in a warm condition (40 °C, 30% RH). No water consumption was allowed during the experiment.
At the 11th min of each stage, subjective measurements and the warmth sensitivity test were carried out in duplicate. Subjective measures included thermal comfort (TC) obtained using a four-point comfort scale [Citation6] (1: comfortable, 4: very uncomfortable), and overall body thermal sensation (TS) and facial thermal sensation (TSface) utilizing a nine-point sensation scale [Citation7] (–4: very cold, 0: neither warm nor cold, 4: very hot). Immediately following the subjective measurements, facial warmth sensitivity was measured using a thermoception analyzer (Intercross-210, Intercross Co., Tokyo, Japan). The measurement of cutaneous warmth sensitivity using this analyzer has been well described in previous studies [Citation8,Citation9]. In essence, a thermal stimulator probe (25 × 25 mm) of the equipment is built with a Peltier element which transfers power generated heat to a contact surface and measures heat flux between the probe and skin surface. The thermal stimulator probe was placed on the left side of each facial region which was marked with a cosmetic pencil to guide consistent placement. The probe (pre-set at 33 °C) was first stabilized to the skin temperature of the measurement areas with the heat flux maintained within a range of ±30 W·m2. After stabilization, the probe temperature was increased at 0.1 °C·s−1 until subjects detected a warmth sensation, at which time they pressed a hand-held switch in their right hand. The warmth sensitivity was determined as HFdiff (W·m2) between the end-stabilization and detection of a warmth sensation. As heat flows from the warmer probe to the skin, HFdiff is presented as a negative value, so that numerically greater values of HFdiff indicate the need for greater probe warmth to elicit a warmth sensation and thereby reflect decreased thermosensitivity (e.g., –400 W·m2 indicates decreased thermosensitivity compared to –200 W·m2).
Statistical analysis
In order to examine if warmth sensitivity differs among facial regions, the main dependent variable (HFdiff) was analyzed using generalized estimating equations (GEEs) with three levels of conditions and six levels of facial regions. Further, pairwise comparisons among the facial regions were computed by adjusting for mean differences for facial anthropometric features. The dependent variable (HFdiff) was a negatively skewed, repeated measure with all observed values below zero. Given the dependence between observations and non-normality of the dependent variable, GEEs were used to examine the research question. GEE adjusts for dependence among observations, allows for non-normally distributed dependent variables to be accurately modeled, and allows mean differences to be assessed while adjusting for distinct facial features. Within the GEE regression model, face location was entered as a categorical variable with the covariates previously mentioned; therefore, the resulting pairwise comparisons are computed while face length, forehead length, face width and bigonial width are held constant at their respective mean levels (12.4, 7.0, 13.2 and 10.1 cm, respectively). A statistical significance was set at p<.05 and all statistical analyses were carried out using an SPSS (SPSS Inc., Chicago, IL).
Results
At the end of each of the three trial conditions (thermoneutral, passive warming, exercise) of the six facial regions, the forehead achieved the highest mean temperatures, whereas the nose recorded the lowest mean temperature during the thermoneutral trial and the chin had the lowest mean temperatures in the warm and exercise trials ().
Table 1. Mean temperatures (in °C at 11 min and 30 min of individual trials) during trials at thermoneutral, passive warming and exercise in a warm environment conditions.
Pairwise comparisons of the six examined facial regions demonstrated that five comparisons achieved a statistically significant HFdiff during thermoneutral trials, two areas during passive warming, and one area during exercise ().
Table 2. Heat flux difference pairwise comparisons among the facial regions while adjusting for facial anthropometrics.
The cheek region showed significantly diminished thermosensitivity (quantitatively greater HFdiff values) compared with the nose, cheekbone, upper lip and chin during thermoneutral trials, while the upper lip demonstrated the highest thermosensitivity (quantitatively inferior HFdiff values) between the facial regions during thermoneutral trials. Significantly diminished thermosensitivity in the cheek compared to the nose and upper lip regions was maintained through passive warming and during exercise only compared to the upper lip ().
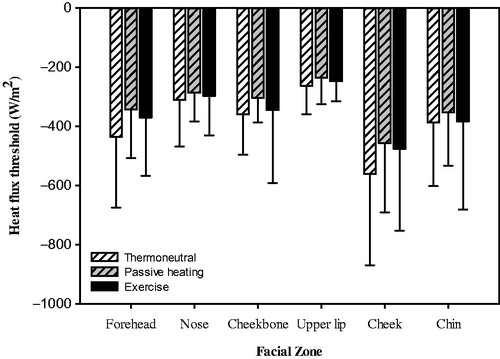
Figure 2. Heat flux threshold of six facial regions across thermoneutral, passive warming and exercise conditions. Values are mean and standard deviation (n = 12).
On the nine-point sensation scale, overall TS were 0.0 ± 0.4, 1.5 ± 0.5 and 2.8 ± 0.6, respectively, for the thermoneutral, passive warming and exercise conditions, and 0.0 ± 0.4, 1.8 ± 0.7 and 3.4 ± 0.5 for TSface. TC regressed individually on mean Tface vs. Tco indicated that Tface was significantly (p = .001) more strongly related than Tco to TC (). TC regressed individually on perceived overall TS vs. TSface also demonstrated that Tface was significantly (p = .004) more related to TC ().
Table 3. Regression model for perceived thermal comfort with physiological measures of face and core body temperatures.
Discussion
The current study has evaluated the temperatures, heat flux and subjective thermal perceptions of six distinct regions of the face. Our temperature data demonstrate that, with regard to the tested facial regions at the three study conditions (thermoneutrality, passive warming, exercise), the forehead achieved the highest mean temperatures, a finding related to its proximity to the brain that allows for conductive and convective heat transfer mechanisms to help regulate brain temperature [Citation10,Citation11]. Also, the forehead is well vascularized and has a uniform surface area with a thin layer of subcutaneous fat [Citation12,Citation13]. The nose is recognized as the area of lowest temperature on the face and the low mean temperature noted in the thermoneutral trial condition is related to its high surface area to volume ratio [Citation14], the avascular nature of its cartilaginous component [Citation15], and the influence of inhaled air prior to its warming by the nasal mucosa in the nasal cavity [Citation16]. However, as was evident in the current study, the nasal temperature increases rapidly when subjected to the effects of warm air or exercise-induced warmth, a feature that is related to the presence of numerous arteriovenous anastomoses in the nose that dilate in response to an increase in body heat [Citation12]. The temperature of the chin area in the thermoneutral condition was similar to that noted previously in a study of young men that reported the chin as having one of the areas of the face with the highest cutaneous blood flow [Citation17]. This increased blood flow is likely related to the low vasoconstrictor tone of the chin region that has been shown to result in lower heat flow after body heating [Citation18], and would explain the fact that the chin exhibited the lowest temperatures in the present study at the end of the warmth and exercise conditions (). Our data emphasize that there are some noted differences in resting temperature of the tested facial regions, with the forehead temperature being the highest and nose temperature being the lowest, but these temperature differences become blunted as the mean body temperature (MBT) increases due to passive warmth or exercise.
The use of heat flux sensors enables rapid response direct and accurate measurements of thermal energy flows, although there appears to be a dearth of data on this technique, as applies to facial skin [Citation19]. Heat flux measurement analysis of the current data, utilizing pairwise comparisons between the six facial regions tested, demonstrated statistically significant HFdiff for five of six facial regions in the thermoneutral condition. Four facial regions (nose, cheekbone, upper lip, chin) were found different than the cheek, while the last difference was found between the upper lip and forehead. The number of significant differences in HFdiff across facial regions declined in number during the passive warming and exercise conditions which likely resulted from increased homogeneity in facial temperatures between different facial regions ( and ), thus supporting our initial hypothesis. As Tco progressively increased during the warmth and exercise trials, regional facial skin temperatures rose to promote dissipation of excess body heat through radiation, convection and evaporation, and the HFdiff eventually approached equilibration between most tested facial regions. Given these findings, it seems as though thermal sensitivity across facial regions, as defined by HFdiff, differs slightly in thermoneutral conditions, especially when comparing the cheek regions to other facial regions (). However, these differences in thermal sensitivity tend to dissipate as Tco increases due to environmental conditions or exercise. Decreases in thermal sensitivity during exercise may also have been a result of exercise-induced analgesia. It has been previously shown that TS, both hot and cold, throughout the entire body, may be blunted during exercise due to this phenomena [Citation20–22]. However, it remains that exercise alone cannot completely explain the change in HFdiff noted in the present study because a decrease in the number of significant pairwise comparisons was found during the passive warming condition alone, without the influence of exercise. Thermosensitivity between different regions of the same anatomical area (face) is independent of the resting skin temperature of the regions, consistent with previous findings [Citation23]. Relative differences in thermosensitivity between the facial regions persist, although their thermoneutral condition temperature differences become smaller during passive heating and exercise.
TS is the perception of temperature conditions evoked by thermal skin receptors and is used by the body to process information about the thermal condition of external objects or the environment [Citation24]. The face is generally regarded as the most thermosensitive body region due to its high concentration of thermoreceptors [Citation1]. This is, in turn, related to the face’s proximity to a brain which is less tolerant of increased temperature than the torso [Citation24]. The physiological zero point of facial skin (the temperature at which different stimuli may be sensed as hot or cold, and comfortable or uncomfortable, depending on their comparison with concurrent skin temperature) is 34 °C when the upper lip, a region of dense thermoreceptors, is used as the indicator [Citation25,Citation26]. TS correlates best with skin temperature [Citation27], and offers a rationale for the current study’s finding that Tface was more strongly related (p<.001) than Tco to perceived TC (). In the current study, TS and TC during passive heating and exercise (with a minimal increase in Tco) seemed to be greatly influenced by Tsk, but not Tco. Our analysis shows that Tface had a greater influence on TS and TC, consistent with previous studies [Citation24,Citation28,Citation29]. Of related interest is the fact that the three areas of highest facial TS (nose, cheekbone, upper lip) () in the current study are those routinely covered by healthcare-related protective masks frequently cited as causing perceptions of thermal discomfort [Citation2].
The perception of TC is the state of mind which expresses satisfaction with the thermal environment [Citation30], a psychological concept that relies on the desired physiological state (uncomfortable through comfortable) [Citation27]. TC is dependent upon Tsk when body temperature is constant, but is impacted by changes in Tco [Citation24], such as the increases that occurred in the current study’s warmth and exercise conditions. The overall TS is influenced by the MBT that takes into consideration core and peripheral skin temperatures for which a weighted proportion between the core and skin varies depending on skin blood flow under different environments [Citation31]. The finding that Tface was significantly more related (p = .004) to perceived TC than overall TS may be explained by the fact that changes in whole-body discomfort require Tco to be sufficiently displaced from thermoneutrality [Citation32], and this did not occur in the present study ().
Although the facial area constitutes only a small portion (4.5%) of the overall TS, is influenced by the MBT that takes into consideration core and peripheral skin temperatures and it is calculated as MBT = 0.64·Tco+0.36·Tsk [Citation31]. The finding that Tface was significantly more related (p = .004) to perceived TC than overall TS may be explained by the fact that changes in whole-body discomfort require Tco to be sufficiently displaced from thermoneutrality [Citation32], and this did not occur in the present study ().
Although the facial area constitutes only a small portion (4.5%) of the total skin surface area of the human body, it dominates whole body temperature perception [Citation33], as noted in the current study’s results. This finding has potentially important ramifications in that efforts to ameliorate conditions of excess facial warmth are likely to reap greater relative benefits of enhanced perceptions of comfort than other body regions. Examples of ameliorative efforts might include facial cooling strategies (miniaturized fans, phase change materials, etc.) when wearing respiratory protective devices such as respirators [Citation34]. By the same token, some caution is advised regarding facial cooling in very warm environments as the improvement in the TS could mask a continued rise in Tco [Citation35].
Conclusion
The HFdiff of six tested facial areas declined as Tco rose in response to ambient and exercise-induced heat. Tface was more strongly related to perceived TC than either Tco (p = .001) or overall TS (p = .004). Thermosensitivity between different regions of the same anatomical area (face) is independent of the resting skin temperature of the regions. Relative differences in thermosensitivity between the facial regions persist, although their thermoneutral condition temperature differences become smaller during passive heating and exercise. Further studies are indicated to determine the true mechanism (exercise-induced analgesic effect, etc.) of the decrease in thermosensitivity brought about by heat-producing activities (passive or active). Efforts to improve perceived TC in warm environments should give consideration to facial cooling, as it is likely to offer the most potential benefit, but also need to consider that improved TC from facial cooling could mask ongoing increases in Tco that could be detrimental.
Acknowledgements
Data source: The dataset for the current study is retained by the U.S. National Institute for Occupational Safety and Health.
Disclosure statement
No potential conflict of interest was reported by the authors.
Additional information
Funding
References
- Cotter JD, Taylor N. The distribution of cutaneous sudomotor and alliesthesial thermosensitivity in heat-stressed humans: an open-loop approach. J Physiol. 2005;565:335–345.
- Roberge R, Benson S, Kim J-H. Thermal burden of N95 filtering facepiece respirators. Ann Occup Hyg. 2012;56:808–814.
- Tikuisis P, Osczevski RJ. Dynamic model of facial cooling. J Appl Meteor. 2002;41:1241–1246.
- Ramanathan NL. A new weighting system for mean surface temperature of the human body. J Appl Physiol. 1964;19:531–533.
- Inoue Y, Gerrett N, Ichinose-Kuwahara T, et al. Sex differences in age-related changes on peripheral warm and cold innocuous thermal sensitivity. Physiol Behav. 2016;164:86–92.
- Zhang YF, Wyon DP, Fang L, et al. The influence of heated or cooled seats on the acceptable ambient temperature range. Ergonomics. 2007;50:586–600.
- Foda E, Almesri I, Awbi HB, et al. Models of human thermoregulation and the prediction of local and overall thermal sensations. Build Environ. 2011;46:2023–2031.
- Shimo K, Suzuki S, Ushida T. Measuring heat flux and amount of heat as indexes of cold pain threshold. Pain Res. 2012;27:17–26.
- Lee J-Y, Saat M, Chou C, et al. Cutaneous warm and cool sensation thresholds and the inter-threshold zone in Malaysian and Japanese males. J Therm Biol. 2010;35:70–76.
- Wang H, Kim M, Normoyle KP, et al. Thermal regulation of the brain – an anatomical and physiological review for neuroscientists. Front Neurosci. 2016;9:528–534.
- Romanovsky AA. Skin temperature: its role in thermoregulation. Acta Physiol (Oxf). 2014;210:498–507.
- Brajkovic D, Ducharme MB. Facial cold-induced vasodilation and skin temperature during exposure to cold wind. Eur J Appl Physiol. 2006;96:711–721.
- Ariyaratnam S, Rood JP. Measurement of facial skin temperature. J Dent. 1990;18:250–253.
- Gavhed D, Mäkinen T, Holmér I, et al. Face temperature and cardiorespiratory responses to wind in thermoneutral and cool subjects exposed to –10 degrees C. Eur J Appl Physiol. 2000;83:449–456.
- Reuther MS, Briggs KK, Schumacher BL, et al. In vivo oxygen tension in human septal cartilage increases with age. Laryngoscope. 2012;122:2407–2410.
- Yu S, Sun X-z, Liu Y-x. Numerical analysis of the relationship between nasal structure and its function. Sci World J. 2014;2014:581975.
- Marrakchi S, Maibach HI. Biophysical parameters of skin: map of human face, regional, and age-related differences. Contact Derm. 2007;57:28–34.
- Fox RH, Goldsmith R, Kidd DJ. Cutaneous vasomotor control in the human head, neck and upper chest. J Physiol (Lond). 1962;161:298–312.
- Sessler DI, Moayeri A. Skin-surface warming: heat flux and central temperature. Anesthesiology. 1990;73:218–224.
- Gerrett N, Ouzzahra Y, Coleby S, et al. Thermal sensitivity to warmth during rest and exercise: a sex comparison. Eur J Appl Physiol. 2014;114:1451–1462.
- Gerrett N, Ouzzahra Y, Redortier B, et al. Female thermal sensitivity to hot and cold during rest and exercise. Physiol Behav. 2015;152:11–19.
- Ouzzahra Y, Havenith G, Redortier B. Regional distribution of thermal sensitivity to cold at rest and during mild exercise in males. J Therm Biol. 2012;37:517–523.
- Kim WB, Jung D, Park J, et al. Sensitivity to cutaneous warm stimuli varies greatly in the human head. J Therm Biol. 2017;69:132–138.
- Nakamura M, Yoda T, Crawshaw LI, et al. Regional differences in temperature sensation and thermal comfort in humans. J Appl Physiol. 2008;105:1897–1906.
- Gwosdow AR, Nielsen R, Berglund LG, et al. Effect of thermal conditions on the acceptability of respiratory protective devices on humans at rest. Am Ind Hyg Assoc J. 1989;50:188–195.
- DuBois AB, Harb ZF, Fox SH. Thermal discomfort of respiratory protective devices. Am Ind Hyg Assoc J. 1990;51:550–554.
- Du X, Li B, Liu H, et al. The response of human thermal sensation and its prediction to temperature step-change (cool-neutral-cool). PLoS One. 2014;9:e104320.
- Kato M, Sugenoya J, Matsumoto T, et al. The effects of facial fanning on thermal comfort sensation during hyperthermia. Pflugers Arch. 2001;443:175–179.
- Roberge RJ, Kim J-H, Benson SM. Absence of consequential change in physiological, thermal and subjective responses from wearing a surgical mask. Respir Physiol Neurobiol. 2012;181:29–35.
- Van Hoof J, Mazej M, Hensen JLM. Thermal comfort: research and practice. Front Biosci. 2010;15:765–788.
- Burton AC. Human calorimetry. The average temperature of the tissues of the body. J Nutr. 1935;9:261–280.
- Cotter JD, Zeyl A, Keizer E, et al. The role of local skin temperature in determining the perception of local and whole-body thermal state. In: Shapiro Y, Moran DS, Epstein Y, editors. Environmental ergonomics: recent progress and new frontiers. London: Freund; 1996. p. 85–88.
- Arens E, Zhang H, Huizenga C. Partial- and whole-body thermal sensation and comfort – part 1: uniform environmental conditions. J Therm Biol. 2006;31:53–59.
- Roberge RJ, Kim J-H, Coca A. Protective facemask impact on human thermoregulation: an overview. Ann Occup Hyg. 2012;56:102–112.
- Powell JB, Kim J-H, Roberge RJ. Powered air-purifying respirator use in healthcare: effects on thermal sensation and comfort. J Occup Environ Hyg. 2017;14:947–954.