
Abstract
Objective: Environmental stress induces disturbances in cell energy metabolism and may cause epigenetic modifications. This study aimed to understand the possible impact of temperature stress (35 °C, 39 °C and 41 °C, compared to control 37 °C) on energy metabolism and epigenetic modifications, such as DNA methylation and histone H4 acetylation, as well as its effects on the expression of genes responsible for epigenetic changes, in mouse skeletal myoblasts (C2C12 cells).
Methods: The results showed significantly reduced maximal respiration and spare respiratory capacity under heat stress (39 °C and 41 °C), suggesting that mitochondrial functions were compromised under these conditions. The glycolytic capacity and glycolysis markedly increased following low-temperature stress (35 °C). The results suggested that, under cold stress, cells prefer glycolysis as a rapid compensatory mechanism to meet energy requirements for adaptive thermogenic response.
Results: Epigenetic changes (histone H4 acetylation and global DNA methylation) were observed under both heat and cold stress. Among the genes coding for DNA methyltransferases, the Dnmt3a was significantly increased under high-temperature conditions (39 °C and 41 °C), while Dnmt1 expression was significantly increased at low temperature (35 °C), indicating that under these conditions the cells preferred maintenance of methylation to de novo methylation activity. An expression pattern similar to Dnmt3a was observed for Gcn5, encoding for a histone acetyltransferase. The study revealed that temperature stress induced changes in the metabolic profiles, as well as epigenetic modifications, including the dynamics of the key enzymes.
Conclusion: The results indicated the existence of crosstalk mechanisms between energy metabolism and epigenetics during cell stress response.
Introduction
Adenosine triphosphate (ATP) represents the energy currency that is essential for most cell processes. Cellular ATP is generated by glycolysis in the cytoplasm and oxidative phosphorylation (OXPHOS) in the mitochondria. The relative contribution of both processes to ATP generation depends on the microenvironment of cells, including energy demand, availability of substrate and oxygen and stress conditions [Citation1]. Skeletal muscle is a high-energy consuming tissue. Muscle contractions are associated with the activity of the ATP driven pump, Ca2+ ATPase [Citation2]. The skeletal muscle is capable of intense activity, which requires short-term high energy output, as well as prolonged endurance activity, requiring constant low energy output [Citation3]. During short-term intense performance, skeletal muscle cells readily undertake anaerobic glycolysis for rapid ATP synthesis, albeit the process is less efficient compared to OXPHOS [Citation4]. The accumulation of lactic acid during anaerobic glycolysis decreases the intracellular pH, thereby affecting key functions of the skeletal muscle [Citation5]. However, this may act as a stimulus for adaptive changes in the cellular energy metabolism under stressful conditions [Citation6].
Heat stress has been found to negatively impact skeletal muscle growth and functions by diverting energy and nutrients towards the maintenance of body euthermia [Citation7,Citation8]. Acute heat stress has been found to affect cellular functions through increased protein degradation and reduced protein synthesis. However, mild heat stress has been associated with increased cellular ATP flux, improved insulin sensitivity and mitochondrial biogenesis in skeletal muscle [Citation9]. During stress response, the lactate-to-pyruvate and the NADH-to-NAD + ratios are increased, indicating a higher rate of glycolysis, as well as reduced OXPHOS. Heat stress has been found to increase the production of reactive oxygen species (ROS) in skeletal muscle, leading to oxidative injury. ROS significantly affect the mitochondrial functions by damaging the components of the electron transport chain, such as succinate dehydrogenase complex and cytochrome b, in the skeletal muscle [Citation10].
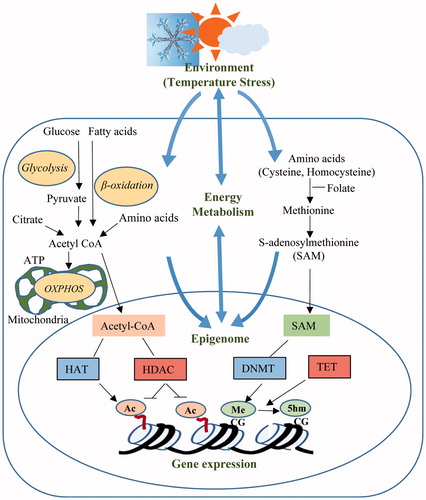
Recently, it has been established that environmental cues such as heat stress affect cellular functions through epigenetic mechanisms. Major epigenetic modifications, such as cytosine DNA methylation and acetylation of lysine residues in histone proteins, determine genome accessibility to the transcriptional machinery. The dynamics of these modifications provide a link between the extracellular environment and gene expression profiles. Genome-wide DNA methylation patterns are altered in the skeletal muscle of heat-stressed pigs [Citation11]. Heat stress in postnatal stage (thermal conditioning) induces DNA methylation changes in the hypothalamic–pituitary–adrenal axis which is involved in adaptation to heat load in adult chickens [Citation12,Citation13]. Key energy metabolites such as S-adenosylmethionine, acetyl CoA and ATP are essential for epigenetic modifications including DNA methylation and histone tail acetylation. The metabolic state of cells is represented by the availability of these energy intermediates or cofactors. Cellular stress response affects the metabolic state of the cells and may induce epigenetic modifications triggering changes in gene expression patterns. This integrated mechanism regulates gene–environment interactions through cell energy metabolism and the epigenome (). In this study, C2C12 cells were exposed to different temperature stresses and their metabolic profile, level of epigenetic modifications, such as DNA methylation and histone H4 acetylation, as well expression of genes involved in epigenetic changes, were evaluated. The results of this study indicated the existence of crosstalk mechanisms between epigenetics and energy metabolism during cellular stress response in skeletal muscle cells.
Figure 1. Cross-talk mechanisms between the environmental heat stress, energy metabolism and epigenetic modifications.
Materials and methods
C2C12 cell culture and temperature stress
Mouse skeletal muscle myoblasts (C2C12 cell line), passage no. 9 (ATCC® CRL1772™) were cultured in growth medium consisting in Dulbecco's Modified Eagle's medium (DMEM,Gibco) containing 1 g/L glucose and supplemented with 10% fetal bovine serum (Biochrom) and 1% penicillin–streptomycin. The cells were cultured in 75 cm2 flasks at 37 °C under 5% CO2. The cell was harvested before reaching ∼80% confluence, using 0.125% Trypsin-EDTA (Biochrom) to maintain the undifferentiated condition and used for the subsequent experiments.
Real-time cell viability determination
Different cultivation temperatures (35 °C, 37 °C, 39 °C and 41 °C) were applied based on the physiological range of body temperature in mammals. Using the xCelligence system, the cell index is used to measure the relative changes in electrical impedance to represent cell status during real-time monitoring. In this experiment, 3 × 10³ cells were seeded into 16-wellplates with growth medium. Cellular impedance was measured every 0.5 h along 72 h. Data from xCelligence were collected using the system software. We found that sustained exposure to temperatures between 35 °C and 41 °C is suitable for the cultivation of proliferating myoblasts. For all experiments, cells were harvested after 72 h of incubation, when cells were actively proliferating. For the bioenergetics assay, to identify the optimal plating conditions, C2C12 cells were seeded at different densities (1, 2, 3 and 5 × 10³ cells/well) into Seahorse XF96 cell culture microplates (Seahorse Bioscience) and incubated at four different temperatures for 72 h, before the measurements. The best condition was 3 × 10³ cells/well, which was finally used for the bioenergetics assay. For genomic DNA, total RNA and histone proteins isolation, 1 × 10⁵ C2C12 cells per well were seeded and cultured in six well-plates, and similarly incubated at different temperatures. Three independent replicates were performed for each temperature.
Bioenergetics assay
The mitochondrial and glycolytic functions of C2C12 cells after temperature stress treatment were analyzed using Seahorse XFp Extracellular Metabolic Flux Analyzer. After temperature stress treatment, the growth medium was removed from the wells and replaced with XF Assay Medium supplemented with 25 mM glucose, and 4 mM sodium pyruvate and incubated for 1 h in a non-CO2 incubator. The XFp Analyzer was then used to measure the cell oxygen consumption rate (OCR) in pmol O2/min, and the extracellular acidification rate (ECAR) in mpH/min. OCR and ECAR values are measures of mitochondrial respiration and glycolytic activity, respectively. Two types of assays were performed to evaluate mitochondrial stress and glycolysis stress, respectively. For the mitochondrial stress test, different inhibitor compounds such as oligomycin 1.5 µM, FCCP 1.5 µM (carbonyl cyanide 4-(trifuoromethoxy) phenylhydrazone) and 0.5 µM rotenone/antimycin A were sequentially injected into the plate. The same culture medium was used as a vehicle for the assay compounds, according to the manufacture’s recommendations. Similarly, for the glycolysis stress test, 10 mM glucose, 50 mM 2 deoxy-glucose and 1.5 µM oligomycin were sequentially injected. Finally, the Bradford protein assay was used to measure the concentration of total protein in each well and used to normalize the OCR and ECAR values. OCR and ECAR values were recorded at the indicated time intervals.
Measurement of genomic DNA m5C
Genomic DNA methylation levels affected by temperature stress in C2C12 cells were estimated using a methylated DNA 5-mC Quantification kit (MehylFlash™, Epigenetek) following the manufacturer’s instructions. Briefly, genomic DNA was extracted from treated and control C2C12 cells, and equal quantities of DNA were used in each well of strips with high DNA binding affinity. The methylated DNA fraction was detected using capture and detection antibodies, followed by fluorometric quantification by reading the relative fluorescence units (RFU) with a fluorescence spectrophotometer (EX530-EM590). Absolute quantifications were done by generating a standard curve of methylated control DNA.
Measurement of H4 acetylation levels
The acetylation of histone H4 was estimated after histone protein extraction. Histone proteins were extracted from treated and control C2C12 cells using the EpiQuick™ Total Histone Extraction Kit (Epigentek). Histone protein concentration was measured using the Bradford method, and bovine serum albumin was employed as a protein standard. Histone H4 acetylation levels were measured by using Total Histone H4 Acetylation Detection Fast Kit (EpiQuick, Epigentek). Briefly, equal quantities of isolated histone protein were captured in the strip wells coated with the anti-acetyl histone H4 antibody by incubating at room temperature for 1 h. Strip wells were then washed to remove the unbound histone proteins. The labeled antibody was added to each well and incubated at room temperature on an orbital shaker for 1 h, followed by stringent washing. The levels of histone H4 acetylation were measured by reading the RFU with a fluorescence spectrophotometer. Absolute quantification was performed after generation of a standard curve of positive control.
Quantitative real-time expression
The expression of selected genes related to epigenetic modifications and energy metabolism was analyzed. Total RNA was isolated from C2C12 cells subjected to different thermal stress conditions using TRI reagent (Sigma-Aldrich) according to the manufacturer’s instructions. Isolated RNA was purified by RNeasy Mini Kit (Qiagen) and DNase I treatment was done to remove contaminating DNA. We used the BioMark HD Real-time PCR System (Fluidigm, South San Francisco, CA) comprising a 48 × 48 dynamic array with an integrated fluidic circuit for qPCR analyses. Quantitative reverse transcriptase PCR (RT-qPCR) was performed using Superscript II reverse transcriptase (Invitrogen, Carlsbad, CA), oligo(dT), with specific target amplification (STA) and exonuclease I treatment. The master mix for sample inlets consisted of 2.25 µL of the STA and Exo-I-treated sample, 2.5 µL of SsoFast EvaGreen supermix with low ROX (Biorad, Hercules, CA) and 0.25 µL of DNA-binding dye. The master mix for assay inlets comprised 2.5 µL of assay loading reagent, 2.25 µL of DNA suspension buffer, and 0.25 µL of a 100 µM primer solution (forward and reverse). QPCR was conducted with the following cycling conditions: 60 s initial denaturation at 95 °C, followed by 30 cycles of 95 °C for 5 s (denaturation) and 60 °C for 20 s (annealing). Hprt1 was used as an internal housekeeping control gene and quantifications were carried out using the delta Ct methods. The sequences of primers are provided in Supplemental Table S1.
Data analysis
The normalized data were used as input for analysis using SAS programs. Temperature was considered as the fixed effect. An adjusting for multiple comparisons across the Type 3 tests for the fixed effect was calculated using the post hoc Tukey–Kramer test and p values < 0.05 were considered statistically significant.
Results
Impact of temperature stress on mitochondrial functions
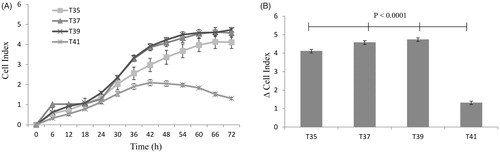
The total protein content was measured in C2C12 cells subjected to thermal stress at 35 °C, 37 °C, 39 °C and 41 °C. No significant differences in total protein levels were observed after cultivation at 35 °C or 39 °C compared to 37 °C. However, total protein levels were significantly reduced at 41 °C (p < 0.0001) (). This was confirmed by using the xCelligence system. The cell index was significantly reduced at 41 °C (p < 0.0001) (). No change in cell index at all temperatures up to 24 h. After 48 h, the cell index of heat-stressed cells (41 °C) was constant with decreasing tendency.
Figure 2. Average total protein content per temperature derived from C2C12 culture at different temperature for 72 h. No significant of total protein between 35 °C and 39 °C but significantly differentiated to 41 °C. All data are from three independent plates and four temperatures.
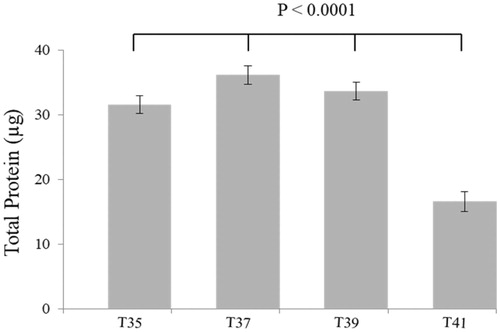
Figure 3. The temperature reduces the proliferating C2C12 myoblasts by measuring in real-time with the xCELLigence system. (A) The cell index curves represent the monitoring of living cells by impedance measurements in which the cells are exposed to different temperatures for 72 h. (B) Changes in cell index over 72 h are significantly differentiated between 35, 37 and 39 to 41 °C. The number of observations was n = 6–8 per temperature and the error bars represent least squares means and SE.
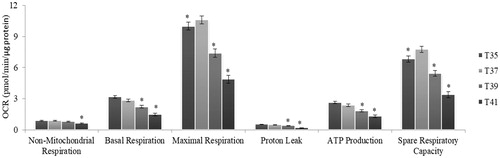
The metabolic flux was analyzed by measuring OCR values normalized for total protein content. The levels of nonmitochondrial and basal respiration were consistently and significantly decreased at high temperature (). The results indicated that oxygen consumption, both outside and inside the mitochondria, by cytoplasmic oxidases and OXPHOS, respectively, were reduced under thermal stress. The uncoupling agent (FCCP), creating artificial energy demand, allows for the measurement of maximal respiration (MR) and spare respiratory capacity (SRC), which are indicators of mitochondrial function. A significant reduction in both parameters was observed in heat-stressed cells (39 °C and 41 °C) compared to cells cultured under standard conditions (37 °C) (). These results suggested that mitochondrial functions were compromised in C2C12 cells under thermal stress. The proton leak decreased with the increase of temperature stress, and was lowest at 41 °C.
Figure 4. Metabolic flux in C2C12 cells in culture under thermal stress at 35, 37, 39 and 41 °C. The non-mitochondrial respiration, basal respiration, maximal respiration, proton leak, ATP production and spare respiratory capacity and calculated according to the Cell Mito Stress Test kit. All data are from three independent plate and four temperature and six well of 3000 cells/well per plate and per temperature (N = 72). All values (Lsmeans ± SE) are given in pmol O2/min/µg protein. *p < 0.01 versus T37 as control.
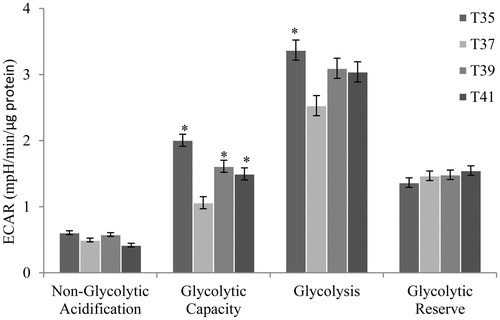
Impact of temperature stress on glycolysis
Thermal stress resulted in the alteration of different glycolytic functions in C2C12 cells thermal stress. Both non-glycolytic acidification and glycolytic reserve were found to change under temperature stress, albeit no statistically significant difference was found (). The glycolytic capacity markedly increased following both low- (35 °C) and high- (39 °C and 41 °C) temperature stresses, compared to normothermic conditions (37 °C) (). Glycolysis also exhibited a similar pattern, with a significant increase at 35 °C. These results suggested that both the glycolytic capacity and glycolysis were required as compensatory mechanisms under conditions of low- and high-temperature stress, to rapidly meet the energy requirements and maintain cellular physiological conditions. These changes may also reflect the attempt to reduce the thermal stress effects on the energy metabolism of C2C12 cells.
Figure 5. Metabolic flux in C2C12 cells in culture under thermal stress at 35, 37, 39 and 41 °C. The non-glycolytic, glycolytic capacity, glycolysis and glycolytic reserve were calculated according to the Glyco Stress Test kit. All data are from three independent plate and four temperature and 6 well of 3000 cell/well per plate and temperature (N = 72). Values (lsmeans ± sem) are given in mpH/min/µg protein. *p < 0.01 VS T37 as control.
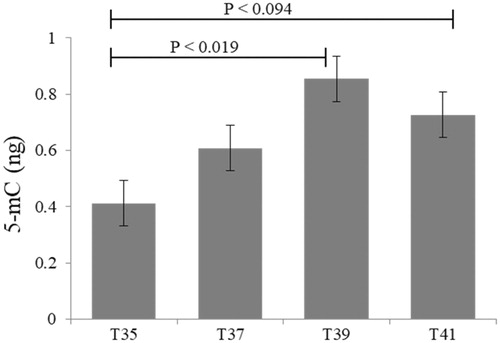
Heat stress induced changes in DNA cytosine methylation
The impact of thermal stress on global DNA methylation was also evaluated in C2C12 cells. No statistically significant differences were observed following low- (35 °C) or high-temperature (39 °C and 41 °C) stress compared to normothermic conditions. However, heat stress induced higher global DNA methylation compared to cold stress (). Global DNA methylation was significantly decreased at 35 °C compared to 39 °C (p = 0.019). However, overall increased temperature stress (39 °C and 41 °C) resulted in increased DNA methylation ().
Figure 6. Global methylation in C2C12 cells in culture under thermal stress at 35, 37, 39 and 41 °C. Data presented as lsmean ± sem. A Statistical difference compared between temperature groups (p < 0.05).
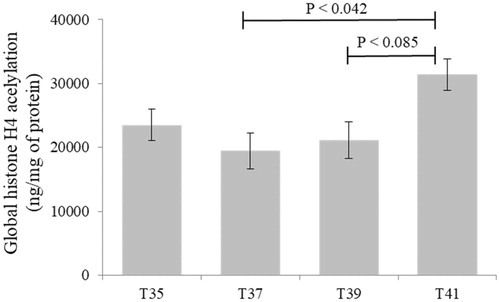
Effect of heat stress on H4 acetylation levels
Histone H4 acetylation levels were measured in C2C12 cells cultured under thermal stress conditions. The global H4 acetylation level tended to increase for both low (35 °C) and high (41 and 39 °C) temperature stress conditions compared to that of the control (37 °C) (). However, a significant difference was observed only when cells exposed to 37 °C and 41 °C were compared (p = 0.042). The levels of H4 acetylation largely indicate active chromatin and gene expression indicating the higher expression at normothermic conditions compared to heat stressed cells where gene expression comparatively suppressed.
Figure 7. Global histone H4 acetylation levels in C2C12 cells in culture under thermal stress at 35, 37, 39 and 41 °C. Data presented as lsmean ± sem. A Statistical difference compared between temperature groups (p < 0.05).
Crosstalk between energy metabolism and the epigenome
Genes encoding for key metabolic enzymes and major epigenetic modifications were evaluated to verify the crosstalk between energy metabolism and the epigenome under thermal stress conditions.
The central cellular metabolic enzyme, Pgc1α (peroxisome proliferator-activated receptor-gamma coactivator-1 alpha), was significantly decreased upon low-temperature stress (35 °C) and significantly increased following high-temperature stress (41 °C). Sirtuin 1 (Sirt1) was found significantly reduced by both high- (41 °C) and low-temperature stress (35 °C) compared to normothermic conditions ().
Figure 8. Expression patterns of genes encode enzymes responsible for epigenetic modifications. Statistical difference compared between control (T37) and other temperature groups (p < 0.05).
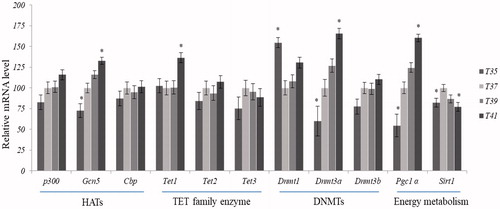
DNA methyltransferase1 (Dnmt1), which is responsible for the maintenance of DNA methylation, was significantly increased at 35 °C compared to 37 °C, and tended to increase at 41 °C, whereas it was not affected by mild heat stress (39 °C). DNA methyltransferases 3 (Dnmt3a and Dnmt3b), both responsible for de novo DNA methylation, were increased as the culture temperature increased. Dnmt3a was significantly decreased upon low thermal stress (35 °C) and increased upon at high thermal stress (41 °C) compared to normothermic condition (). No significant effects of temperature on Dnmt3b expression were detected. The ten–eleven translocase (TET) proteins, TET1, TET2 and TET3, are responsible for the formation of 5-hydroxymethyl from the methyl group of cytosine. Only transcript of Tet1 was significantly upregulated under high thermal stress (41 °C) compared to control conditions ().
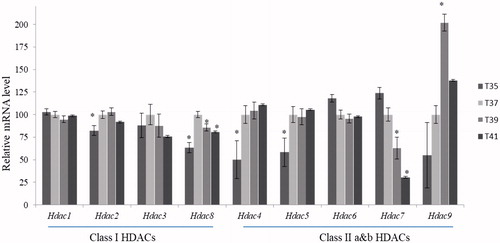
Histone acetyl transferases (HATs), responsible for acetylation of histone tails, include the three major subtypes p300, Gcn5 and Cbp. The overall expression levels of HATs were increased in response to rising temperatures. Noteworthy, the Gcn5 subtype was significantly upregulated in high thermal stress (41 °C) and downregulated by low temperature stress (35 °C), compared to normothermic condition (). Histone deacetylases (HDACs) are responsible for removal of acetyl group from the tails of histones belonging to class I HDACs (Hdac1, Hdac2, Hdac3 and Hdac8) and class II HDACs (Hdac4, Hdac5, Hdac6, Hdac7 and Hdac9). Under low-temperature conditions (35 °C), Hdac2 and Hdac8 (Class I) as well as Hdac4 and Hdac5 (Class II), were significantly downregulated relative to the control cells, while Hdac6 and Hdac7 tended to be upregulated, albeit the latter changes did not reach statistical significance. Hdac8 (Class I) and Hdac7 (Class II) were significantly downregulated in both high-temperature conditions tested (39 °C and 41 °C) (). In contrast, Hdac9 was upregulated in the high temperature conditions.
Figure 9. Expression patterns of genes encode enzymes responsible for the removal of the acetyl group from histone protein tails. Statistical difference compared between control (T37) and other temperature groups (p < 0.05).
Discussion
Skeletal muscle cells have great metabolic flexibility and adaptation capacity in response to environmental cues implying different energy demands [Citation3]. Mitochondria generate most of the energy necessary for cellular function via OXPHOS, and are involved in many key cellular processes such as apoptosis, calcium homeostasis and ROS production. C2C12 cells provide an excellent experimental model to quantify the effect of temperature stress on energy metabolism by extracellular flux measurements. The present study revealed compromised mitochondrial functions in C2C12 cells subjected to temperature stress. Both maximal respiration and spare respiratory capacity were significantly lower in heat-stressed cells. Spare respiratory capacity is defined as the difference between basal and maximal respiration and represents the reserve capacity of cells, enabling them to respond to additional ATP demand and withstand periods of stress. Decreased spare respiratory capacity can be associated with mitochondrial dysfunction. Heat stress was found to induce overproduction of mitochondrial superoxide and intracellular reactive oxygen species (ROS) levels in cultured avian muscle cells [Citation14]. Genes involved in oxidative stress response are generally upregulated at high temperatures [Citation15,Citation16]. Recently, it was reported that elevated temperature leads to calcium leakage which causes mitochondrial fragmentation and dysfunction [Citation17] and induce Ca2+ overload, oxidative stress and altered mitochondrial membrane permeability [Citation18]. Moreover, impaired mitochondrial functions were previously observed in the skeletal muscle of heat-stressed chickens [Citation19].
Heat stress alters the glycolytic in skeletal muscle cells. Earlier studies indicated that a compensatory glycolytic mechanism is activated following sudden increases in ATP demand [Citation7]. It was also found that heat shock protein 70 (HSP70), induced by heat stress, inhibits OXPHOS and simultaneously enhances glycolysis to compensate the ATP unbalance [Citation20]. In broiler birds, the sustained exposure to high temperature impairs mitochondrial function, affecting aerobic energy metabolism and increasing glycolytic activity and lactic acid accumulation in the skeletal muscle [Citation21, Citation22]. Consistently, in our study, we also found that heat stress at both 39 °C and 41 °C induced a significant increase in the glycolytic capacity compared to control conditions.
The complexity of cellular and molecular adaptation to cold stress has been poorly investigated. Exposure of C2C12 myoblasts to low temperature was previously found to increase the metabolic flux, and differentiating myotubes respond to low temperature by increasing their metabolic rate, ATP production, and glycolytic flux [Citation23]. These findings are in line with the results of our experiments on myoblasts cultured for 72 h. We found that the rate of basal respiration, ATP production, and glycolysis was significantly increased at low temperature. Interestingly, under these conditions, cells preferred glycolysis for energy production, indicating an adaptive thermogenic response based on glucose metabolism.
PPARG coactivator 1 alpha (PGC-1α) is a nuclear-encoded transcription factor involved in mitochondrial biogenesis and OXPHOS [Citation24]. In a previous study, we showed that the level of PGC-1α mRNA is significantly correlated with the expression of both mitochondrially and nuclearly encoded OXPHOS subunits, as well as with the enzyme activities of complexes I, II and IV [Citation25]. In the present study, decreased and increased expression of PGC-1α was observed under low- and high-temperature stress conditions, respectively. These results were consistent with a preference of cells for glycolysis, as a means for energy production, under low-temperature stress and for OXPHOS under high-temperature stress.
Epigenetic changes such as DNA methylation and histone modifications have been found to occur in response to environmental changes [Citation26]. Here, we analyzed the effects of temperature stress on different epigenetic modifications by comparing global DNA methylation and histone H4 acetylation, as well as the expression pattern of genes encoding various HDACs, HATs, DNMTs and TETs. Altered methylation in genes for heat shock proteins (HSPs) and corticotropin-releasing hormone, induced by heat stress during early embryonic stages, has an impact on the thermotolerance capacity in the postnatal life of broiler chickens [Citation12,Citation13]. We showed that, upon heat stress, C2C12 cells exhibited differential global DNA methylation compared to cells exposed to cold stress. An earlier study reported reduced global 5 mC% in heat-conditioned, compared to non-conditioned, chickens. Notably, poly(ADP-ribose) polymerase inhibitor (PARPi) influenced the DNA methylation pattern and most likely affects the response to long-term heat stress [Citation27].
Our results indicated higher levels of histone H4 acetylation in heat stressed C2C12 cells. Earlier, histone H4 acetylation at heat shock element of hsp70 and hsp90 promoters was found elevated during heat acclimatization in rats [Citation28]. HAT and HDAC have antagonistic actions and determine the overall level of histone protein acetylation. Following analysis of different HATs, we found that Gcn5 was significantly upregulated under high temperature stress. Gcn5 is known to induce gene expression during stress response in yeast, plants and higher vertebrates [Citation29–31]. Our results also indicated similar patterns, indicating a role of Gcn5 in cell response to heat stress. Interestingly, class II HDAC complexes showed heterogeneous profiles in C2C12 cells subjected to high-temperature stress, including the downregulation of Hdac7 and the upregulation of Hdac9, while Hdac4 and 5 were both downregulated at low temperature. The role of Class IIa HDACs (HDAC4, 5, 7 and 9) in muscle physiology and metabolism is well recognized, but their relationship with temperature stress is still unclear [Citation32].
The DNA methyltransferases DNMT1, DNMT3a and DNMT3b catalyze the methylation of CpG dinucleotides, with DNMT1 being a maintenance methyltransferase and DNMT3a and DNMT3b serving as de novo methyltransferases [Citation33]. A study using skeletal muscle-specific Dnmt3a knockout mice demonstrated that satellite cell differentiation appears to be regulated via DNA methylation [Citation34]. Previously, it was reported that heat stress upregulates DNMT3a expression and its binding to relevant CpG methylation sites was confirmed [Citation35]. In addition, we previously showed that the maternal diet has a significant effect on fetal muscle expression of DNMT3A, but not DNMT3B [Citation36]. Consistently, we did not detect changes in Dnmt3b expression following different temperature stresses. We found highly differential expression of Dnmt1 under low temperature conditions. In particular, Dnmt3a expression was highly increased at high temperature. This indicated that, at low temperature, the cells prefer to maintenance genomic methylation instead of activating de novo methylation.
Three DNA demethylation enzymes belonging to the ten–eleven translocation (TET) protein family proteins (TET1, TET2 and TET3) were examined. A previous study revealed that TET1 can convert 5mC to 5hmC in mammalian cells [Citation37]. Our study showed that temperature stress had no effect on the expression of Tet2 and Tet3. On the other hand, Tet1 was upregulated at 41 °C compared to 37 °C. We found that both Tet1 and Dnmt3a were highly expressed at 41 °C. A recent study reported that DNMT3a and TET1 regulate gene expression not only by controlling DNA methylation but also regulating the histone landscape upon binding to the relevant promoters [Citation38].
In summary, this study showed that temperature stress shifted the OXPHOS and the glycolytic functions in muscle cells line. Heat stress significantly reduced maximum respiration and spare respiratory capacity, which are associated with mitochondrial dysfunction. In contrast to Pgc-1α, a key regulator of OXPHOS, was significantly increased following high-temperature stress. Under cold stress, glycolysis is the preferential pathway for energy production, indicating an adaptive thermogenic response promoting enhanced glucose metabolism. Epigenetic changes were observed both under heat and cold stress conditions. Among the different HATs analyzed, Gcn5 was upregulated while that of Hdac7 was downregulated under high-temperature stress. Regarding DNA methylation, the expression pattern of DNA methyltransferases revealed that the cells preferred to maintain methylation under cold stress, while they activated de novo methylation under heat stress. Taken together, these data showed that genomic DNA methylation is dynamic over the entire ranges of temperature, which is consistent with a role in the regulatory mechanism that contributes to the plasticity of the phenotype of cell adaptation.
Supplemental Material
Download PDF (114.7 KB)Acknowledgements
The authors thank Joana Bittner, Nicole Gentz and Annette Jugert for excellent technical assistance.
Disclosure statement
The authors declare that no potential conflict of interest.
Additional information
Funding
Related Research Data
References
- Lancaster G, Suprunenko YF, Jenkins K, et al. Modelling chronotaxicity of cellular energy metabolism to facilitate the identification of altered metabolic states. Genetics. 2016;6:29584.
- Smith IC, Bombardier E, Vigna C, et al. ATP consumption by sarcoplasmic reticulum Ca(2)(+) pumps accounts for 40-50% of resting metabolic rate in mouse fast and slow twitch skeletal muscle. PLoS One. 2013;8:e68924.
- Westerblad H, Bruton JD, Katz A. Skeletal muscle: energy metabolism, fiber types, fatigue and adaptability. Exp Cell Res. 2010;316:3093–3099.
- Baker JS, McCormick MC, Robergs RA. Interaction among skeletal muscle metabolic energy systems during intense exercise. J Nutr Metab. 2010;2010:1.
- Westerblad H, Allen DG, Lannergren J. Muscle fatigue: lactic acid or inorganic phosphate the major cause? News Physiol Sci. 2002;17:17–21.
- Egan B, Zierath JR. Exercise metabolism and the molecular regulation of skeletal muscle adaptation. Cell Metab. 2013;17:162–184.
- Febbraio MA. Alterations in energy metabolism during exercise and heat stress. Sports Med. 2001;31:47–59.
- Zhao L, McMillan RP, Xie G, et al. Heat stress decreases metabolic flexibility in skeletal muscle of growing pigs. Am J Physiol Regul Integr Comp Physiol. 2018;315:R1096–R106.
- Liu CT, Brooks GA. Mild heat stress induces mitochondrial biogenesis in C2C12 myotubes. J Appl Physiol (1985). 2012;112:354–361.
- Quinlan CL, Orr AL, Perevoshchikova IV, et al. Mitochondrial complex II can generate reactive oxygen species at high rates in both the forward and reverse reactions. J Biol Chem. 2012;287:27255–27264.
- Hao Y, Cui Y, Gu X. Genome-wide DNA methylation profiles changes associated with constant heat stress in pigs as measured by bisulfite sequencing. Sci Rep. 2016;6:27507.
- Vinoth A, Thirunalasundari T, Shanmugam M, et al. Evaluation of DNA methylation and mRNA expression of heat shock proteins in thermal manipulated chicken. Cell Stress Chaperones. 2018;23:235–252.
- Cramer T, Rosenberg T, Kisliouk T, et al. Early-life epigenetic changes along the corticotropin-releasing hormone (CRH) gene influence resilience or vulnerability to heat stress later in life. Mol Psychiatry. 2019;24:1013–1026.
- Kikusato M, Yoshida H, Furukawa K, et al. Effect of heat stress-induced production of mitochondrial reactive oxygen species on NADPH oxidase and heme oxygenase-1 mRNA levels in avian muscle cells. J Therm Biol. 2015;52:8–13.
- Yang DH, Jung KW, Bang S, et al. Rewiring of signaling networks modulating thermotolerance in the human pathogen Cryptococcus neoformans. Genetics. 2017;205:201–219.
- Steen BR, Lian T, Zuyderduyn S, et al. Temperature-regulated transcription in the pathogenic fungus Cryptococcus neoformans. Genome Res. 2002;12:1386–1400.
- Momma K, Homma T, Isaka R, et al. Heat-induced calcium leakage causes mitochondrial damage in Caenorhabditis elegans body-wall muscles. Genetics. 2017; 206:1985–1994.
- Qian L, Song X, Ren H, et al. Mitochondrial mechanism of heat stress-induced injury in rat cardiomyocyte. Cell Stress Chaper. 2004;9:281–293.
- Huang C, Jiao H, Song Z, et al. Heat stress impairs mitochondria functions and induces oxidative injury in broiler chickens. J Anim Sci. 2015;93:2144–2153.
- Wang L, Schumann U, Liu Y, et al. Heat shock protein 70 (Hsp70) inhibits oxidative phosphorylation and compensates ATP balance through enhanced glycolytic activity. J Appl Physiol (1985). 2012;113:1669–1676.
- Zhang ZY, Jia GQ, Zuo JJ, et al. Effects of constant and cyclic heat stress on muscle metabolism and meat quality of broiler breast fillet and thigh meat. Poult Sci. 2012;91:2931–2937.
- Lu Z. Chronic heat stress impairs the quality of breast-muscle meat in broilers by affecting redox status and energy-substance metabolism. J Agric Food Chem. 2017;65:11251–11258.
- Little AG, Seebacher F. Thermal conditions experienced during differentiation affect metabolic and contractile phenotypes of mouse myotubes. Am J Physiol Regul Integr Comp Physiol. 2016;311:R457–R465.
- LeBleu VS, O’Connell JT, Gonzalez Herrera KN, et al. PGC-1α mediates mitochondrial biogenesis and oxidative phosphorylation in cancer cells to promote metastasis. Nat Cell Biol. 2014;16:992–1003.
- Liu X, Trakooljul N, Hadlich F, et al. Mitochondrial-nuclear crosstalk, haplotype and copy number variation distinct in muscle fiber type, mitochondrial respiratory and metabolic enzyme activities. Sci Rep. 2017;7:14024.
- Horowitz M. Heat acclimation-mediated cross-tolerance: origins in within-life epigenetics? Front Physiol. 2017;8:548.
- Cramer T, Rosenberg T, Kisliouk T, et al. PARP inhibitor affects long-term heat-stress response via changes in DNA methylation. Neuroscience. 2019;399:65–76.
- Tetievsky A, Horowitz M. Posttranslational modifications in histones underlie heat acclimation-mediated cytoprotective memory. J Appl Physiol (1985). 2010;109:1552–1561.
- Johnsson A, Xue-Franzen Y, Lundin M, et al. Stress-specific role of fission yeast Gcn5 histone acetyltransferase in programming a subset of stress response genes. Eukaryot Cell. 2006;5:1337–1346.
- Xue-Franzen Y, Henriksson J, Burglin TR, et al. Distinct roles of the Gcn5 histone acetyltransferase revealed during transient stress-induced reprogramming of the genome. BMC Genomics. 2013;14:479.
- Hu Z, Song N, Zheng M, et al. Histone acetyltransferase GCN5 is essential for heat stress-responsive gene activation and thermotolerance in Arabidopsis. Plant J. 2015;84:1178–1191.
- Mihaylova MM, Shaw RJ. Metabolic reprogramming by class I and II histone deacetylases. Trends Endocrinol Metab. 2013;24:48–57.
- Turek-Plewa J, Jagodzinski PP. The role of mammalian DNA methyltransferases in the regulation of gene expression. Cell Mol Biol Lett. 2005;10:631–647.
- Hatazawa Y, Ono Y, Hirose Y, et al. Reduced Dnmt3a increases Gdf5 expression with suppressed satellite cell differentiation and impaired skeletal muscle regeneration. Faseb J. 2018;32:1452–1467.
- Yossifoff M, Kisliouk T, Meiri N. Dynamic changes in DNA methylation during thermal control establishment affect CREB binding to the brain-derived neurotrophic factor promoter. Eur J Neurosci. 2008;28:2267–2277.
- Altmann S, Murani E, Schwerin M, et al. Maternal dietary protein restriction and excess affects offspring gene expression and methylation of non-SMC subunits of condensin I in liver and skeletal muscle. Epigenetics. 2012;7:239–252.
- Tahiliani M, Koh KP, Shen Y, et al. Conversion of 5-methylcytosine to 5-hydroxymethylcytosine in mammalian DNA by MLL partner TET1. Science. 2009;324:930–935.
- Gu T, Lin X, Cullen SM, et al. DNMT3A and TET1 cooperate to regulate promoter epigenetic landscapes in mouse embryonic stem cells. Genome Biol. 2018;19:88.