
Abstract
Objective: Thermosensitive liposomal doxorubicin (TSL–Dox) is a promising stimuli-responsive nanoparticle drug delivery system that rapidly releases the contained drug in response to hyperthermia (HT) (>40 °C). Combined with localized heating, TSL–Dox allows highly localized delivery. The goals of this study were to demonstrate that real-time fluorescence imaging can visualize drug uptake during delivery, and can predict tumor drug uptake.
Methods: Nude mice carrying subcutaneous tumors (Lewis lung carcinoma) were anesthetized and injected with TSL–Dox (5 mg/kg dose). Localized HT was induced by heating tumors for 15, 30 or 60 min via a custom-designed HT probe placed superficially at the tumor location. In vivo fluorescence imaging (excitation 523 nm, emission 610 nm) was performed before, during, and for 5 min following HT. After imaging, tumors were extracted, drug uptake was quantified by high-performance liquid chromatography, and correlated with in vivo fluorescence. Plasma samples were obtained before and after HT to measure TSL–Dox pharmacokinetics.
Results: Local drug uptake could be visualized in real-time during HT. Compared to unheated control tumors, fluorescence of heated tumors increased by 4.6-fold (15 min HT), 9.3-fold (30 min HT), and 13.2-fold (60 min HT). HT duration predicted tumor drug uptake (p = .02), with tumor drug concentrations of 4.2 ± 1.3 µg/g (no HT), 7.1 ± 5.9 µg/g (15 min HT), 14.1 ± 6.7 µg/g (30 min HT) and 21.4 ± 12.6 µg/g (60 min HT). There was good correlation (R2 = 0.67) between fluorescence of the tumor region and tumor drug uptake.
Conclusions: Real-time in vivo fluorescence imaging can visualize drug uptake during delivery, and can predict tumor drug uptake.
Introduction
Conventional cancer chemotherapy has been limited by insufficient drug delivery to the tumor site, with only ∼0.1% of the infused drug reaching tumors [Citation1]. To enhance tumor drug uptake, numerous drug delivery systems such as liposomes and other nanoparticles have been devised, most often based on increased tumor nanoparticle uptake due to the enhanced permeability and retention (EPR) effect [Citation1,Citation2]. Even though such drug delivery systems facilitate increased (∼0.7% of infused dose [Citation1]) tumor accumulation compared to free (unencapsulated) drug, this did not translate to enhanced tumor control, with patient benefit limited to reduced toxicities. The lack of efficacy improvement is likely because the drug remains encapsulated and does not become bioavailable following tumor uptake [Citation3,Citation4].
Stimuli-responsive delivery systems such as thermosensitive liposomes (TSL) are a promising approach to locally enhance drug bioavailability while also reducing toxicities [Citation5,Citation6]. TSL rapidly release the contained drug in response to hyperthermia (HT) >40 °C, with newer TSL formulations based on the intravascular triggered release paradigm; here, drug release from TSL occurs within the heated microvasculature, followed by rapid tissue uptake of the released drug [Citation3,Citation7,Citation8].
While various drugs have been encapsulated in TSL, doxorubicin (Dox) is the most widely investigated agent [Citation5,Citation6]. Combined with localized heating, TSL–encapsulated doxorubicin (TSL–Dox) allows highly localized delivery (∼10–30× local dose compared to unencapsulated Dox) [Citation6,Citation9,Citation10], with complete regression of tumors achieved in some preclinical studies [Citation9,Citation11,Citation12]. Only a single formulation of TSL-Dox has so far advanced to clinical trials in conjunction with either radiofrequency ablation (RFA), high intensity focused ultrasound (HIFU), or microwave HT, for treatment of liver cancer and recurrent chest wall cancer [Citation13–18].
The drug quantity delivered by TSL depends on the heating device, as different devices generate different heating profiles [Citation19]. In addition, the duration of HT dictates drug uptake [Citation20,Citation21]. Both the duration and method of HT in preclinical animal studies differ considerably, with HT duration ranging from 2 to 12 min for RFA [Citation12,Citation20], 2 to 40 min for HIFU [Citation22,Citation23], 60 min for heated water bath [Citation8,Citation9,Citation24] and cold light lamp [Citation19], and 5 to 60 min when a laser was used as heat source [Citation19,Citation25].
In the current study with TSL–Dox, we present real-time in vivo fluorescence imaging methods for monitoring, and for quantification of tumor drug uptake. Dox is inherently fluorescent, and in vivo microscopy studies have exploited this property to monitor drug uptake at the microscopic level during delivery with TSL–Dox and to characterize drug penetration [Citation8,Citation26–28]. One study employed optical spectroscopy measurements obtained via a fiber-optic probe to quantitatively monitor tumor drug uptake [Citation29]. Several groups have employed whole-body in vivo fluorescence imaging to visualize drug accumulation from TSL–Dox release after completion of HT. To our knowledge, there is no in vivo whole-body fluorescence imaging study that monitored spatial drug distribution in real-time during heating and delivery. The goals of this study were to demonstrate that (Citation1) time lapse in vivo fluorescence imaging can be used to monitor drug uptake in real-time during HT mediated drug delivery, and (Citation2) that in vivo fluorescence intensity can predict tumor Dox accumulation (.
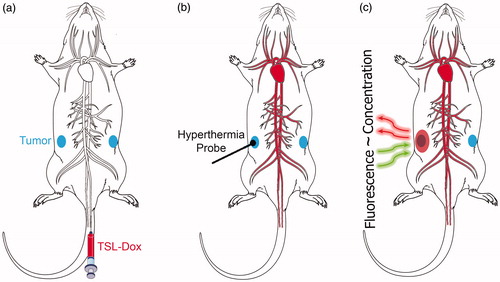
Figure 1. Schematics of experimental setup. (a) A mouse carrying two tumors (blue ellipsoids) is injected with TSL–Dox (red). (b) The infused TSL-Dox is restricted to the blood vessels (red). Application of localized hyperthermia to the tumor releases Dox from TSL within the tumor vasculature. This released drug is taken up by tumor tissue, which can be visualized by fluorescence imaging. (c) The fluorescence intensity of the delivered Dox in the tumor region (pink ellipsoid) during and after hyperthermia is predictive of the tumor drug concentration.
Materials and methods
Tumor cell line culture
Lewis lung carcinoma (LLC) cells were routinely cultured at 37 °C in 5% CO2/95% air in Dulbecco’s modified Eagle’s medium (Sigma-Aldrich, D6429) supplemented with 10% inactivated fetal bovine serum (Invitrogen), 1% Penicillin and streptomycin (Invitrogen). TSL–Dox has relevance for lung cancer since tumor ablation is used in lung cancer, and the combination of tumor ablation and TSL–Dox is currently in clinical trial for liver cancer [Citation13,Citation30]. In addition, there are prior studies with TSL–Dox in LLC tumors [Citation27].
Mice and tumors
All experiments were approved by the Medical University of South Carolina’s Institutional Animal Care and Use Committee. 8–12 week old female athymic BALB/c nude mice were housed at 3–5 mice in ventilated polycarbonate microisolation cages. Each cage contained sterile 1/8″ paper strip enrichment (Enviro-Dri, Shepherd Specialty Papers, Milford, NJ, USA) and 1/8″ corn cob bedding (The Andersons, Maumee, OH, USA). All mice had free-choice access to autoclaved reverse osmosis water and commercial chow (Teklad Global Diet 2918S, Envigo, Madison, WI, USA). The rodent housing rooms were maintained at 22 ± 1 °C on a 12:12 h light:dark cycle. All animals were acclimated for at least 5 days prior to any experimental manipulation. A specific-pathogen-free status was maintained for Mycoplasma pulmonis, Helicobacter spp., endo- and ecto- parasites, mouse hepatitis virus, minute virus of mice, mouse parvovirus, enzootic diarrhea of infant mice virus, ectromelia virus, Sendai virus, pneumonia virus of mice, Theiler murine encephalomyelitis virus, reovirus, lymphocytic choriomeningitis virus, mouse adenovirus, mouse norovirus, and polyomavirus. Tumors were initiated per procedures previously described [Citation31]. Briefly, 1 × 10⁶ LLC cells were injected subcutaneously to the lower leg flanks of the animal on both sides. The tumors were allowed to grow until they reached a diameter of 4–5 mm before being treated.
Thermosensitive liposomal doxorubicin (Dox) preparation
Thermosensitive liposomal doxorubicin (Dox) was prepared as previously described by Negussie et al. [Citation32] with slight modifications. Briefly, lipids dipalmitoyl-sn-glycero-3-phosphocholine (DPPC), 1,2-distearoyl-sn-glycero-3-phosphoethanolamine-N-PEG2000 (DSPE-PEG2000), and monostearoyl phosphatidylcholine (MSPC) (Avanti Lipids, Alabaster, AL, USA) were dissolved in chloroform and then dried under a stream of air to form a thin film of lipids. This thin film was hydrated with 300 mM citrate buffer (pH 4.0) at 55 °C for one hour and extruded through a 100 nm filter using a thermobarrell extruder (Lipex, Northern Lipids, Canada) at 60 °C. Dox hydrochloride (Sigma-Aldrich, USA) was dissolved in deionized water (2 mg/mL) and loaded into TSL by pH gradient with phosphate buffered saline (PBS, pH 7.4) [Citation32].
Temperature dependent drug release kinetics of these TSL was measured between 37 and 43 °C by a microfluidic device previously described [Citation33,Citation34]. Briefly, TSL-Dox was diluted to 80 μg/ml in PBS at room temperature. This solution was pumped through the microfluidic device, where a capillary tube was heated to a predetermined temperature while being imaged with a fluorescence imaging system (Maestro, Caliper Life Sciences, Hopkinton, MA, USA). While Dox fluorescence is quenched while encapsulated in TSL, fluorescence increases when Dox is released [Citation35]. As TSL–Dox pass through the heated capillary tube, the fluorescence signal increases during release allowing calculation of released fraction over time. Size of the liposomes was measured by dynamic light scattering (ZetaPALS, Brookhaven, CT, USA) after diluting 20 µl of liposomes in 3 ml of PBS.
Hyperthermia probe
Our goal was to perform fluorescence imaging during heating. Since most HT devices are not sufficiently small for use inside the imaging system, or do not provide unobstructed view of the heated tissue region for fluorescence imaging, we custom-designed a miniature HT probe. This HT probe for heating subcutaneous tissues was based on a 2.5 mm diameter thermistor (Honeywell, NTC 121). The uninsulated wires attached to the thermistor element were insulated by inserting them in glass capillary tubes, which were then filled with epoxy resin (Figure S1(A)). We developed hardware and software to heat the probe to a defined target temperature. Part of the software was implemented on the Arduino prototyping platform, and handled measurement of heating probe resistance as well as applying a voltage to the thermistor probe. The Arduino board communicated with a PC via software written in Python that ran on the PC. The Python software read the thermistor resistance, converted it to temperature, and then calculated the required thermistor voltage based on a proportional–integral (PI) controller so that the thermistor achieved the desired target temperature. A graphical user interface allowed the user to enter the target temperature and monitor the probe temperature in real-time (Figure S1(B)). The thermistor was calibrated to determine the relation between temperature and thermistor resistance by placing the thermistor probe in a water bath of defined temperature. To estimate the expected temperature profile produced by the probe in vivo, we measured the temperature profiles produced by the probe in gel phantoms at 50 °C target temperature while recording temperature maps with an infrared camera (Mikron M7500) for 60 min. In addition, we measured surface skin temperature profiles produced by the probe in live animals inside the fluorescence imaging system with an infrared camera (FLIR C2).
Thermal animal support
We performed studies to ensure that the core body temperature of the animals stays within the physiological range during HT and imaging, to determine the optimal temperature setting for thermal support inside the imaging system. We set the temperature of the thermal support in the imaging system to either 34 °C or 37 °C while measuring the rectal temperature of the animals for 1 h inside the imaging system (n = 3 per group). In addition, we obtained blood samples at 6 min and at 75 min after injection of TSL–Dox to quantify plasma Dox concentration and identify any accelerated leakage from TSL due to elevated body temperature.
Temperature sensitivity of doxorubicin fluorescence
Since fluorophores often exhibit temperature dependence of fluorescence intensity, we performed an in vitro study to quantify any temperature sensitivity of Dox fluorescence. A Dox solution was pumped into a capillary tube placed on top of a heating element as used in prior studies [Citation33]. Fluorescence images were acquired at temperatures between 37 and 50 °C and Dox fluorescence intensity was quantified.
In vivo fluorescence imaging
On the day of the experiments, animals were weighed and tumor sizes were measured. Mice were anesthetized by isoflurane (1–5%), a background fluorescence image was obtained, and TSL–Dox was intravenously administered at a dose of 5 mg/kg. Five to 6 min after the infusion of TLS-Dox, a plasma sample was collected and 200 μL of Lactated Ringer’s solution was administered subcutaneously for hydration. The animals were then transferred to the in vivo fluorescence imaging system (Maestro, Caliper Life Sciences, Hopkinton, MA, USA). The thermal support for the animal was set at 34 °C rather than 37 °C to keep the animals body temperature within physiological range and avoid any enhanced systemic leakage of TSL–Dox. Care was taken to ensure that the heating probe was on the skin surface located centrally on the tumor. We employed a fixed angle stand to stabilize the probe and ensure a similar probe angle in all animals. In addition, care was taken to ensure the same pressure was applied. The contralateral tumor was used as a control without being exposed to HT. The temperature probe was set at 50 °C, which resulted in a ∼43 °C probe surface temperature (50 °C is measured inside the probe center). The tumors were exposed for 15, 30 or 60 min to HT. Time-lapse whole-body fluorescence images were obtained before start of HT, every 5 min while heating, and until 5 min after heating was stopped. Then the heating probe was removed, and a final fluorescence image was taken. If imaging lasted for over 30 min, the animals were given 50 μL of Lactated Ringer’s solution subcutaneously every 30 min to keep them hydrated. Following imaging, the animals were sacrificed, blood was collected, and the entire tumors were harvested. Plasma samples obtained by centrifuging the blood samples and the harvested tumor tissues were stored at −80 °C until analyzed. Extracted tumors were imaged by the fluorescence imaging system before being frozen.
Fluorescence imaging was performed with filters appropriate for Dox for excitation (523 nm) and emission (610 nm). The images were exported from the imaging system software as tif-format files and imported into ImageJ (NIH, Bethesda, MD). In ImageJ, image stacks were created from all acquired images during each individual HT experiment. Images were then converted from 16- to 32-bit to improve accuracy of any subsequent image processing. The brightness and contrast of the entire image stack was adjusted to ensure optimal visualization of tumor fluorescence. The fluorescent region of the heated tumor was manually outlined (region of interest (ROI)), excluding the thermistor (heating probe). The average intensity of the tumor ROI was calculated, and intensity of the background image (before heating) within this ROI was subtracted for each image frame. For the control tumors, a tumor ROI of equivalent size to those of heated tumors was drawn at the contralateral tumor location.
Plasma Dox quantification
Plasma Dox concentration was measured by a fluorimeter as described previously [Citation36]. Briefly, samples were thawed. Subsequently, to 30 μL of plasma sample, 90 μL of phosphate buffered saline and 100 μL of 10% Triton™ X-100 (diluted in deionized water) were added. The fluorescence intensity of the sample was measured by a microplate reader (Synergy HT, Biotek Instruments Inc., Winooski, VT, USA) using appropriate filters for Dox (excitation 485 nm, emission 590 nm). The drug concentration was determined by a comparison against a standard curve prepared from mouse plasma samples spiked with known concentrations of Dox (1–100 µg/ml).
Tumor tissue Dox quantification
Doxorubicin quantification of the entire tumor tissue samples was performed following a protocol reported by us earlier [Citation37]. Tumor tissue samples were homogenized in aqueous KH2PO4 (pH = 3.8) using a homogenizer (Bead Ruptor 24; Omni International, GA, USA) at 5 m/s for five minutes. The homogenized tissue was centrifuged, and supernatant collected. A 90 μL fraction of each extracted sample was mixed with 50 μL, 2.5 μg daunorubicin/mL (internal standard [IS]) in a 2 ml vial, vortexed and incubated at 37 °C for 15 min. Acetone (250 μL) and a saturated solution of zinc sulfate (100 μL) were added, and samples were vortexed and incubated at 37 °C for 15 min, centrifuged, and 200 µL of supernatant recovered and dried. Dried residues were dissolved in high-performance liquid chromatography (HPLC) mobile phase (acetonitrile and deionized water [34:66] with 0.1% trifluoroacetic acid) and Dox concentration was evaluated by using a reversed-phase column (Zobrax Eclipse Plus C18; Agilent Technologies, CA, USA). Detection was performed at appropriate excitation/emission wavelengths of 498/593 nm. Data acquisition was done using ChemStation Version B 04.03 software (Agilent Technologies). Concentrations of the analyte in tissue samples were determined using peak-area ratios of the sample analyte to the IS from the linear calibration curve using least squares regression method based on the nominal concentration (generated from untreated tissue spiked with different concentration of Dox and IS). Additional details are available as Supplementary Information.
Statistical analysis
To statistically validate the uptake of Dox in tumor tissue, we ran several non-parametric tests. First, we compared drug concentration before and after HT (n = 15 pairs) using the Wilcoxon signed rank test. To determine if the uptake of Dox was associated with duration of HT, Wilcoxon sum rank tests were used to compare the means of the three different HT treatment durations (15 min vs. 30 min vs. 60 min). Additionally, a linear regression model was constructed regressing Dox concentration in the tumor on the length of HT with measurements from unheated control tumors assigned a treatment time of zero minutes. To determine if fluorescence and Dox concentration were associated, a linear regression model was built. Additionally, linear regression models were created to evaluate the associations between HT duration, Dox concentration, and tumor ROI fluorescence (AU).
Results
In vitro characterization of TSL–Dox
Complete release of Dox from the TSL–Dox occurred within 2 s at temperatures above 40 °C (Figure S2(a)). About 20% of the drug was released at 37 °C within the first few seconds [Citation36] (data not shown). The liposome size was 109 ± 4.9 nm based on dynamic light scattering (Figure S2(b)).
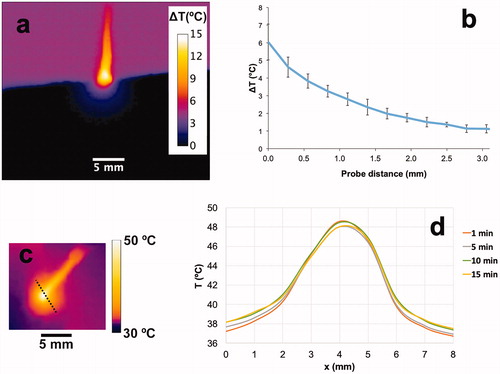
Figure 2. Temperature profile surrounding the hyperthermia probe. (a) In vitro cross sectional temperature map measured ∼20 min after hyperthermia start. (b) In vitro radial temperature profile measured from the probe tip surface (x = 0). Temperature difference (ΔT (°C)) relative to baseline temperature is shown in both figures. (c) In vivo tumor surface temperature measured 1 min after hyperthermia start. (d) In vivo surface temperature profile at different times (along dashed line in ) demonstrates steady state after ∼10 min.
Temperature sensitivity of Dox fluorescence
Compared to 37 °C, fluorescence intensity of Dox increased by 6% when heated to 40 °C, and by 11% when heated to 43 °C (Figure S4).
Hyperthermia probe
Gel phantom experiments showed that temperature reached steady-state within ∼2 to 3 min (). While the HT probe temperature was set to 13 °C above phantom baseline temperature, this represents the internal probe temperature (i.e., inside the heated thermistor bead). The probe surface temperature reached only 6 °C above baseline, which would correspond to 43 °C in vivo (37 + 6 °C). Temperature dropped rapidly with distance from the probe tip, and temperatures adequate for TSL drug release were limited to ∼1 to 1.5 mm distance from the probe ().
In addition, we performed in vivo studies inside the imaging system with the same environmental temperature settings as used in in vivo studies with TSL–Dox where we measured tumor surface temperature with an infrared camera (FLIR C2, FLIR Systems) during heating in two mice, where we assumed an emissivity of 0.98 for mouse skin [Citation38] (). Steady state was reached within 5–10 min. Since TSL release effectively above ∼40 °C, we considered the region within the 40 °C isotherm as an estimate of the region of drug release. The diameter of the tissue region above 40 °C was 4–4.6 mm after 1 min of heating, and plateaued at 4.6–5.4 mm after 5–10 min (). This corresponds to a location of the 40 °C isotherm at a distance of 1.1–1.5 mm from the thermistor probe surface, similar to the results from the gel phantom studies. Upon cessation of HT, temperature returned to baseline within less than 1 min.
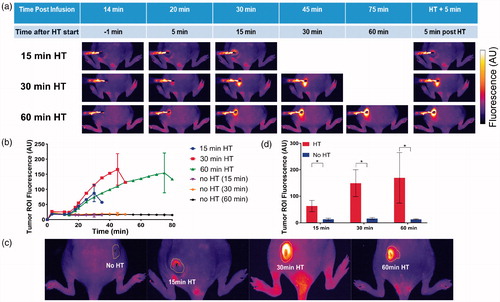
Figure 3. Uptake of doxorubicin (Dox) during hyperthermia (HT) can be visualized by fluorescence imaging. (a) Fluorescence image series of representative tumors exposed to HT for 15 min (top row), 30 min (middle row), and 60 min (bottom row) are shown. Fluorescence increases during HT and indicates the tissue region where drug delivery occurred. Fluorescence of unheated contralateral tumors did not change. (b) Mean fluorescence intensity of each tumor ROI visually not obstructed by the probe was quantified during heating. Tumor ROI fluorescence in heated tumors increased as long as HT was applied, with subsequent drop in fluorescence upon discontinuation of heating. Tumor ROI fluorescence of unheated control tumors did not increase. (c) Representative fluorescence images after HT completion and probe removal, with tumor ROI indicated as yellow outline. The tumor ROI was manually outlined as the tissue region with visual fluorescence enhancement. (d) Mean fluorescence intensity in tumor ROI for heated (HT, red bars) and unheated tumors (no HT, blue bars), after HT completion and probe removal. Tumor ROI fluorescence increased with HT duration, and all tumors in HT groups exhibited significantly higher fluorescence signals than the unheated control tumors in the same group (*p < .05).
Dox uptake can be visualized by fluorescence imaging during delivery
Following infusion of TSL–Dox, there was an overall increase in the fluorescence compared to pre-infusion in the whole animal. The fluorescence of the unheated tumors did not change significantly during HT exposure of the contralateral tumors. The uptake of Dox by tumors exposed to HT could be monitored by fluorescence imaging during heating, visualizing spatially where drug was delivered (). The fluorescence intensity increased as long as tumors were exposed to HT, suggesting continuous drug uptake as long as HT was applied. Once the heating stopped there was a rapid decrease in the fluorescence suggesting wash-out of free Dox not bound to tissue constituents (). HT duration was a statistically significant predictor of tumor ROI fluorescence (p = .03). Compared to unheated control tumors, tumors exposed to HT had fluorescence of the tumor ROI enhanced by 6.2-fold (15 min HT), 8.8-fold (30 min HT) and 9.7-fold (60 min HT) (). The reported fluorescence intensity in is limited to tumor ROI regions not visually obstructed by the HT probe.
Five minutes after the conclusion of HT treatment, the HT probe was removed () and mean fluorescence intensity was measured of the now unobstructed tumor ROI (). Compared to unheated control tumors, the fluorescence intensity in tumor ROIs of heated tumors was enhanced 4.6-fold (15 min HT), 9.3-fold (30 min HT) and 13.2-fold (60 min HT) (, ). While during heating () the temperature sensitivity of Dox contributed towards the observed increase in fluorescence (∼6–11% of the observed increase can be attributed to enhanced fluorescence at hyperthermic temperatures (see Figure S4)), the imaging studies after conclusion of HT () were done with tumor temperature returned to baseline as confirmed by our infrared imaging studies, that is, without any contribution from enhanced fluorescence at hyperthermic temperatures.
Figure 4. Tumor drug uptake increases with duration of HT. (a) At the conclusion of HT, the entire tumors were excised and fluorescence imaging was performed for both lateral and medial views. Higher fluorescence in lateral views indicated more drug was delivered in tumor regions adjacent to the HT probe. (b) Tumor Dox concentration was quantified by HPLC for tumors receiving HT (red bars), and contralateral tumors with no HT (blue bars). Tumor concentration (average of whole tumors) was significantly higher in heated vs. unheated tumors in the groups receiving either 30 or 60 min of HT. A comparison of the heated tumor concentrations between 15 and 30 min, and between 15 and 60 min HT approached significance (p = .06). A regression analysis identified HT duration as significant predictor of tumor drug uptake (p = .02).
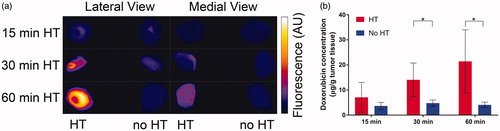
Table 1. Tissue fluorescence and concentration of (Dox) exposed to varying durations of HT.
Duration of HT dictates tumor drug uptake
The excised tumors were imaged by fluorescence imaging both from lateral and medial views, demonstrating that the drug was not evenly distributed throughout the tumors (). Measurement of tumor drug concentration by HPLC revealed that compared to unheated control tumors, the tumor Dox concentration of heated tumors was 1.9-fold (15 min HT), 2.9-fold (30 min HT) and 5.2-fold (60 min HT) higher (, ). Tumor dox concentration was significantly higher with, compared to without HT (). Based on a linear regression analysis with HT duration (15, 30 and 60 min) as predictor variable, HT duration was a statistically significant predictor of tumor drug uptake (p = .02); on average, each additional minute of HT enhanced tumor drug uptake by 0.31 µg/g.
Table 2. Statistical tests to determine effects of hyperthermia (HT).
Plasma pharmacokinetics
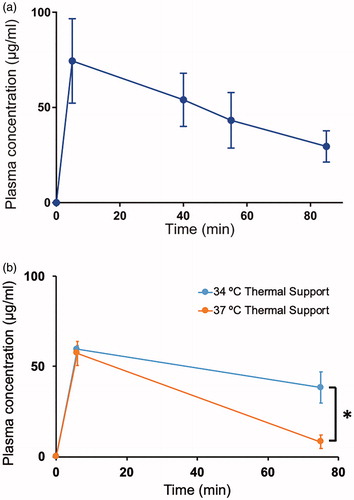
Plasma concentration of Dox was measured by fluorometry, as a prior study showed that HPLC and fluorometry achieve similar accuracy in plasma [Citation36]. Peak Dox plasma concentration was 74.5 ± 22.2 μg/mL, measured 5 min post infusion (). Large variation in the concentration of Dox in plasma of different animals was observed, and may be due to differential clearance between animals, from varying blood volumes, and from variation in TSL leakage. Plasma half-life was 56.0 ± 15.9 min, which is similar to a prior study in mice [Citation39] and comparable to the half-life of 45 min observed in canine studies [Citation36], and 55 min from clinical studies in human patients [Citation13], all with lysolipid based TSL formulations as used here.
Figure 5. Plasma pharmacokinetics. (a) Plasma concentration of Dox was measured after injection of TSL-Dox, and after completion of hyperthermia in each of the groups (15, 30 and 60 min). Plasma half-life was 56.0 ± 15.9 min. (b) Plasma concentration of Dox was measured at 6 min and 75 min after injection with animals on either 34 °C or 37 °C thermal support inside the imaging system. At 37 °C thermal support, core temperature was elevated above 39 °C, resulting in accelerated systemic leakage from TSL and a diminished plasma half-life.
Elevated body temperature results in enhanced systemic TSL leakage
We measured the rectal temperature of animals during 60 min inside the imaging system with thermal support either at 34 °C or 37 °C (n = 3 per group). The body temperature in the animals with 34 °C support was within the physiological range (36–37 °C) for BALB/c mice [Citation40], whereas body temperature was elevated to above 39 °C when thermal support was set to 37 °C (Figure S3). The body temperature dropped by 2–3 °C immediately after the administration of TSL–Dox since the solution was at room temperature, and returned to baseline within ∼20 min. The elevated body temperature at 37 °C thermal support setting resulted in premature leakage of drug from TSL. The plasma concentration 6 min after TSL–Dox administration was 59.5 ± 2.2 ug/ml (34 °C thermal support) and 57.3 ± 6.7 ug/ml (37 °C thermal support), and dropped to 38.4 ± 8.7 ug/ml (34 °C thermal support) and 8.3 ± 3.7 ug/ml (37 °C thermal support) after 75 min (). These results demonstrate the importance of monitoring of body temperature and selecting an appropriate thermal support temperature in any TSL studies.
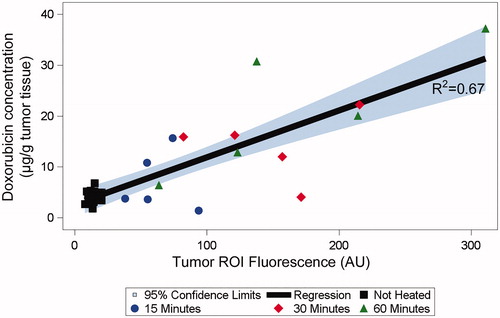
In vivo fluorescence intensity is predictive of tumor drug concentration
Fluorescence intensity was a statistically significant predictor of tumor drug uptake (p = .002), and there was a strong linear correlation (R2=0.67) between the fluorescence intensity measured after HT conclusion and the Dox delivered to the tumors (. Since the tumor ROI was manually drawn and not based on the actual tumor boundaries (as tumors were not visible under fluorescence imaging), it is reasonable to assume that the correlation would improve further if we were able to measure fluorescence within the actual tumor region, for example, by using fluorescently labeled tumors.
Figure 6. Fluorescence intensity predicts drug delivered to tumors. The mean fluorescence in the tumor ROI measured after hyperthermia conclusion was predictive of the concentration of doxorubicin delivered to tumors (p = .002).
For our HT probe, the predicted hyperthermic zone (>40 °C) where TSL release occurs extends to about ∼1.5 mm depth, based on infrared imaging studies in an agar gel phantom (. This means that tumors were only partially exposed to hyperthermic temperatures, with some parts not adequately heated. This was confirmed by fluorescence imaging of extracted tumors that showed limited fluorescence when viewed from medial direction (). Thus, we anticipate that tumor drug uptake could be further enhanced with a more uniform HT method.
Discussion
Thermosensitive liposomes are a triggered drug delivery system that releases the encapsulated drug upon exposure to hyperthermic temperatures (>40 °C), and were first described four decades ago [Citation41]. The more recent fast-release TSL formulations encapsulating Dox [Citation31,Citation42] or idarubicin [Citation43] are based on the intravascular triggered release paradigm, where drug release occurs inside the heated tumor microvasculature, followed by tumor uptake of the released drug [Citation3,Citation7,Citation8].
In the current study we employed a TSL–Dox formulation similar to the one currently used in clinical trials [Citation31] with slightly modified lipid composition as described earlier [Citation32]. We applied HT locally to subcutaneous tumors by a custom-designed miniature probe (). Importantly, the miniature probe enabled us for the first time to perform real-time in vivo fluorescence imaging inside a fluorescence imaging system during HT. Since Dox is fluorescent, the tissue region where drug uptake took place could be visualized during delivery, providing direct feedback on location of delivery (). Fluorescence of tissue surrounding the HT probe was visibly enhanced within 5 min, and increased as long as heat was applied. Fluorescence rapidly declined once heating stopped (), suggesting that drug delivery was limited to the duration of HT, similar to prior studies [Citation3,Citation8,Citation44]. Since Dox fluorescence is slightly enhanced at elevated temperatures (by 6–11% between 40–43 °C, see Figure S4), a small fraction of the observed fluorescence increase during heating () can be explained by this direct temperature dependence of Dox fluorescence. Any persistent fluorescence after tumor temperature returned to baseline (<1 min after HT cessation) is attributable to tumor drug uptake alone ().
Intravital studies have demonstrated that for TSL based delivery, fluorescence primarily originates from intracellular Dox that has been taken up by cells [Citation44], rather than from intravascular free or encapsulated drug. This suggests that also in our studies, fluorescence comes primarily from intracellular drug.
There are several factors that affect the amount of drug delivered to the targeted tissue by TSL based on the intravascular triggered release paradigm. These factors include the device/method of HT (since the device affects tumor temperature distribution) [Citation19], the applied temperature, and the HT duration [Citation11,Citation20,Citation21]. Prior preclinical studies with TSL employed varying HT durations ranging from 2 to 60 min [Citation8,Citation9,Citation12,Citation19,Citation20,Citation22,Citation24,Citation25], with all studies limited to a single duration except for three recent reports that examined two HT durations [Citation11,Citation20,Citation21]. In the current study we demonstrated that the amount of Dox delivered to tumors quantified by HPLC increased with HT duration, for the three durations of 15, 30 and 60 min (, ). HT duration was a statistically significant predictor of tumor drug uptake (p = .02), and on average each additional minute of heating increased tumor drug uptake by 0.31 µg/g. In addition to tumor drug uptake, also the mean fluorescence in the tumor ROI after conclusion of heating depended on the HT duration (p = .03) (). These results suggest that tumor drug uptake can be modulated by adjusting the HT duration, providing control over the locally delivered dose – this ability to modulate the dose is unlike the vast majority of drug delivery systems that provide no means to adjust this locally delivered dose. The dependence of tumor drug uptake on HT duration can be explained based on the intravascular triggered release paradigm: TSL-encapsulated drug in systemic circulation continuously enters the heated tissue volume, releasing the drug. This process continues as long as heat is applied, and TSL-encapsulated drug is available in systemic circulation. Therefore, the longer heat is applied, the more drug is locally released.
Further of considerable relevance is, whether real-time fluorescence was predictive of tumor drug uptake. We found that mean fluorescence intensity in the tumor ROI at the conclusion of HT (after the HT probe was removed) was predictive of tumor drug uptake (p = .002) and correlated well with the quantity of Dox delivered to the tumor (R2=0.67) (. This is a particularly promising result since we did not use the exact tumor boundaries to define the tumor ROI where fluorescence was measured, and presumably the correlation would further increase with fluorescence measurement limited to the actual tumor region. Thus, with real-time fluorescence imaging during HT we could monitor where the drug is delivered to, and also predict how much drug was delivered. Combined with the ability to modulate drug uptake based on HT duration, this opens up the possibility of delivery of a prescribed dose to a targeted tissue region in rodent studies. In this scenario, HT would be applied until the fluorescence in the target volume corresponds to the desired minimum dose.
The presented methods are however limited to fluorescent drugs (e.g., anthracycline family, topotecan, methotrexate), and to fluorescently labeled drugs (e.g., cisplatin, carboplatin [Citation45]). Another limitation of our study is, that we only partially exposed the tumors to hyperthermic temperatures. While this does not impact the study conclusions, future studies where tumor control is measured and compared to tumor uptake predicted by fluorescence imaging will require a more effective HT device that can expose the tumor completely to hyperthermic temperatures.
For most human tumors, 3 D imaging would be required to ensure adequate drug delivery to all regions within a deep-seated tumor volume which is not possible with fluorescence imaging. Several studies have attempted to estimate the delivered drug dose by indirect methods via co-encapsulating MRI contrast agents together with Dox that are released together with the drug [Citation23,Citation32,Citation46], and recent studies demonstrate very good correlation between MR contrast uptake and tumor drug uptake [Citation47,Citation48]. The described methods are thus more directly applicable to preclinical studies with limited applicability in human tumors apart possibly from surface tumors.
Conclusions
We demonstrated that real-time in vivo fluorescence imaging can visualize where drug uptake takes place during delivery with TSL. In addition, in vivo fluorescence was predictive of tumor drug uptake, and we demonstrated that HT duration dictates tumor drug uptake. The combination of these concepts may enable a preclinical platform for delivery of a prescribed dose to a targeted tumor.
Supplemental Material
Download PDF (953.9 KB)Acknowledgments
We would like to thank Dr. Michael J Madson from the MUSC writing center for providing editorial assistance. We would like to thank Dr. Besim Orgretmen, Dr. Shanmugam Panneer Selvam (Department of Biochemistry, Medical University of South Carolina) and Dr. Amanda LaRue (Department of Pathology, Medical University of South Carolina) for providing Lewis lung carcinoma (LLC) cells.
Disclosure statement
No potential conflict of interest was reported by the authors.
Additional information
Funding
Related Research Data
References
- Wilhelm S, Tavares AJ, Dai Q, et al. Analysis of nanoparticle delivery to tumours. Nat Rev Mater. 2016;1:16014.
- Shi J, Kantoff PW, Wooster R, et al. Cancer nanomedicine: progress, challenges and opportunities. Nat Rev Cancer. 2017;17:20–37.
- Gasselhuber A, Dreher MR, Rattay F, et al. Comparison of conventional chemotherapy, stealth liposomes and temperature-sensitive liposomes in a mathematical model. PLoS One. 2012;7:e47453.
- Seynhaeve AL, Dicheva BM, Hoving S, et al. Intact doxil is taken up intracellularly and released doxorubicin sequesters in the lysosome: evaluated by in vitro/in vivo live cell imaging. J Control Release. 2013;172:330–340.
- Kneidl B, Peller M, Winter G, et al. Thermosensitive liposomal drug delivery systems: state of the art review. Int J Nanomed. 2014;9:4387–4398.
- Haemmerich D, Motamarry A. Thermosensitive liposomes for image-guided drug delivery. Adv Cancer Res. 2018;139:121–146.
- Li L, ten Hagen TL, Schipper D, et al. Triggered content release from optimized stealth thermosensitive liposomes using mild hyperthermia. J Control Release. 2010;143:274–279.
- Manzoor AA, Lindner LH, Landon CD, et al. Overcoming limitations in nanoparticle drug delivery: triggered, intravascular release to improve drug penetration into tumors. Cancer Res. 2012;72:5566–5575.
- Kong G, Anyarambhatla G, Petros WP, et al. Efficacy of liposomes and hyperthermia in a human tumor xenograft model: importance of triggered drug release. Cancer Res. 2000;60:6950–6957.
- Mikhail AS, Negussie AH, Pritchard WF, et al. Lyso-thermosensitive liposomal doxorubicin for treatment of bladder cancer. Int J Hypertherm. 2017;33:733–740.
- Kheirolomoom A, Lai C-Y, Tam SM, et al. Complete regression of local cancer using temperature-sensitive liposomes combined with ultrasound-mediated hyperthermia. J Control Release. 2013;172:266–273.
- Andriyanov AV, Koren E, Barenholz Y, et al. Therapeutic efficacy of combining pegylated liposomal doxorubicin and radiofrequency (rf) ablation: comparison between slow-drug-releasing, non-thermosensitive and fast-drug-releasing, thermosensitive nano-liposomes. PLoS One. 2014;9:e92555.
- Wood BJ, Poon RT, Locklin JK, et al. Phase i study of heat-deployed liposomal doxorubicin during radiofrequency ablation for hepatic malignancies. J Vasc Interv Radiol. 2012;23:248–255.e7.
- Zagar TM, Vujaskovic Z, Formenti S, et al. Two phase i dose-escalation/pharmacokinetics studies of low temperature liposomal doxorubicin (ltld) and mild local hyperthermia in heavily pretreated patients with local regionally recurrent breast cancer. Int J Hypertherm. 2014;30:285–294.
- Lencioni R, Cioni D. Rfa plus lyso-thermosensitive liposomal doxorubicin: In search of the optimal approach to cure intermediate-size hepatocellular carcinoma. Hepatic Oncol. 2016;3:193.
- Dou Y, Hynynen K, Allen C. To heat or not to heat: challenges with clinical translation of thermosensitive liposomes. J Control Release. 2017;249:63–73.
- Motamarry A, Asemani D, Haemmerich D. Thermosensitive liposomes. In: Catala A, editor. Liposomes. Rijeka: InTech, 2017. Ch. 07.
- Lyon PC, Gray MD, Mannaris C, et al. Safety and feasibility of ultrasound-triggered targeted drug delivery of doxorubicin from thermosensitive liposomes in liver tumours (tardox): a single-centre, open-label, phase 1 trial. Lancet Oncol. 2018;19:1027–1039.
- Willerding L, Limmer S, Hossann M, et al. Method of hyperthermia and tumor size influence effectiveness of doxorubicin release from thermosensitive liposomes in experimental tumors. J Control Release. 2016;222:47–55.
- Rossmann C, McCrackin MA, Armeson KE, et al. Temperature sensitive liposomes combined with thermal ablation: effects of duration and timing of heating in mathematical models and in vivo. PLoS One. 2017;12:e0179131.
- Bing C, Patel P, Staruch RM, et al. Longer heating duration increases localized doxorubicin deposition and therapeutic index in vx2 tumors using mr-hifu mild hyperthermia and thermosensitive liposomal doxorubicin. Int J Hypertherm. 2019;36:196–203.
- Hijnen N, Langereis S, Grull H. Magnetic resonance guided high-intensity focused ultrasound for image-guided temperature-induced drug delivery. Adv Drug Deliv Rev. 2014;72:65–81.
- Hijnen N, Kneepkens E, de Smet M, et al. Thermal combination therapies for local drug delivery by magnetic resonance-guided high-intensity focused ultrasound. Proc Natl Acad Sci USA. 2017;114:E4802–e11.
- Li L, ten Hagen TL, Haeri A, et al. A novel two-step mild hyperthermia for advanced liposomal chemotherapy. J Control Release. 2014;174:202–208.
- Chen MM, Liu YY, Su GH, et al. Nir responsive liposomal system for rapid release of drugs in cancer therapy. IJN. 2017;12:4225–4239.
- Li L, ten Hagen TL, Bolkestein M, et al. Improved intratumoral nanoparticle extravasation and penetration by mild hyperthermia. J Control Release. 2013;167:130–137.
- Dicheva BM, ten Hagen TL, Schipper D, et al. Targeted and heat-triggered doxorubicin delivery to tumors by dual targeted cationic thermosensitive liposomes. J Control Release. 2014;195:37–48.
- Santos MA, Goertz DE, Hynynen K. Focused ultrasound hyperthermia mediated drug delivery using thermosensitive liposomes and visualized with in vivo two-photon microscopy. Theranostics. 2017;7:2718–2731.
- Palmer GM, Boruta RJ, Viglianti BL, et al. Non-invasive monitoring of intra-tumor drug concentration and therapeutic response using optical spectroscopy. J Control Release. 2010;142:457–464.
- Tak WY, Lin SM, Wang Y, et al. Phase iii heat study adding lyso-thermosensitive liposomal doxorubicin to radiofrequency ablation in patients with unresectable hepatocellular carcinoma lesions. Clin Cancer Res. 2018;24:73–83.
- Needham D, Anyarambhatla G, Kong G, et al. A new temperature-sensitive liposome for use with mild hyperthermia: characterization and testing in a human tumor xenograft model. Cancer Res. 2000;60:1197–1201.
- Negussie AH, Yarmolenko PS, Partanen A, et al. Formulation and characterisation of magnetic resonance imageable thermally sensitive liposomes for use with magnetic resonance-guided high intensity focused ultrasound. Int J Hypertherm. 2011;27:140–155.
- Burke C, Dreher MR, Negussie AH, et al. Drug release kinetics of temperature sensitive liposomes measured at high-temporal resolution with a millifluidic device. Int J Hyperthermia. 2018;34:786–794.
- Asemani D, Motamarry A, Haemmerich D. In vitro measurement of release kinetics of temperature sensitive liposomes with a fluorescence imaging system. Proceedings of 40th IEEE Engineering in Medicine and Biology Society; 2018 Jul 17–21; Honolulu, Hawaii; p. 3216–3219.
- Gaber MH, Wu NZ, Hong K, et al. Thermosensitive liposomes: extravasation and release of contents in tumor microvascular networks. Int J Radiat Oncol Biol Phys. 1996;36:1177–1187.
- Bredlau AL, Motamarry A, Chen C, et al. Localized delivery of therapeutic doxorubicin dose across the canine blood-brain barrier with hyperthermia and temperature sensitive liposomes. Drug Deliv. 2018;25:973–984.
- Ranjan A, Jacobs GC, Woods DL, et al. Image-guided drug delivery with magnetic resonance guided high intensity focused ultrasound and temperature sensitive liposomes in a rabbit vx2 tumor model. J Control Release. 2012;158:487–494.
- Fiebig K, Jourdan T, Kock MH, et al. Evaluation of infrared thermography for temperature measurement in adult male NMRI nude mice. J Am Assoc Lab Anim Sci. 2018.
- Banno B, Ickenstein LM, Chiu GNC, et al. The functional roles of poly(ethylene glycol)‐lipid and lysolipid in the drug retention and release from lysolipid‐containing thermosensitive liposomes in vitro and in vivo. J Pharmaceut Sci. 2010;99:2295–2308.
- Rikke BA, Johnson TE. Lower body temperature as a potential mechanism of life extension in homeotherms. Exp Gerontol. 2004;39:927–930.
- Yatvin MB, Weinstein JN, Dennis WH, et al. Design of liposomes for enhanced local release of drugs by hyperthermia. Science. 1978;202:1290–1293.
- Lindner LH, Eichhorn ME, Eibl H, et al. Novel temperature-sensitive liposomes with prolonged circulation time. Clin Cancer Res. 2004;10:2168–2178.
- Lu T, Lokerse WJ, Seynhaeve AL, et al. Formulation and optimization of idarubicin thermosensitive liposomes provides ultrafast triggered release at mild hyperthermia and improves tumor response. J Control Release. 2015;220:425–437.
- Li L, Ten Hagen TL, Hossann M, et al. Mild hyperthermia triggered doxorubicin release from optimized stealth thermosensitive liposomes improves intratumoral drug delivery and efficacy. J Control Release. 2013;168:142–150.
- Miller MA, Askevold B, Yang KS, et al. Platinum compounds for high-resolution in vivo cancer imaging. ChemMedChem. 2014;9:1131–1135.
- Ponce AM, Viglianti BL, Yu D, et al. Magnetic resonance imaging of temperature-sensitive liposome release: Drug dose painting and antitumor effects. J Natl Cancer Inst. 2007;99:53–63.
- Peller M, Willerding L, Limmer S, et al. Surrogate MRI markers for hyperthermia-induced release of doxorubicin from thermosensitive liposomes in tumors. J Control Release. 2016;237:138–146.
- Kneepkens E, Heijman E, Keupp J, et al. Interleaved mapping of temperature and longitudinal relaxation rate to monitor drug delivery during magnetic resonance-guided high-intensity focused ultrasound-induced hyperthermia. Invest Radiol. 2017;52:620–630.