
 ?Mathematical formulae have been encoded as MathML and are displayed in this HTML version using MathJax in order to improve their display. Uncheck the box to turn MathJax off. This feature requires Javascript. Click on a formula to zoom.
Abstract
Purpose: This study evaluates the effects of various pulsing paradigms, on the irreversible electroporation (IRE) lesion, induced electric current, and temperature changes using a perfused porcine liver model.
Materials and methods: A 4-monopolar electrode array delivered IRE therapy varying the pulse length and inter-pulse delay to six porcine mechanically perfused livers. Pulse paradigms included six forms of cycled pulsing schemes and the conventional pulsing scheme. Finite element models provided further insight into the effects of cycled pulsing on the temperature and thermal injury distribution.
Results: ‘Single pulse cycle with no interpulse delay’ deposited maximum average energy (2.34 ± 0.35 kJ) and produced the largest ratio of thermally damaged tissue area and IRE ablation area from all other pulse schemes (18.22% 8.11, p < .0001 all pairwise comparisons). These compared favorably to the conventional algorithm (2.09 ± 0.37 kJ, 3.49%
2.20, p < .0001, all comparisons). Though no statistical significance was found between groups, the ‘5 pulse cycle, 0 s delay’ pulse paradigm produced the largest average IRE ablation cross sectional area (11.81 ± 1.97 cm2), while conventional paradigm yielded an average of 8.90 ± 0.91 cm2. Finite element modeling indicated a ‘10 pulse cycle, 10 s delay’ generated the least thermal tissue damage and ‘1 pulse cycle, 0 s delay’ pulse cycle sequence the most (0.47 vs. 3.76 cm2), over a lengthier treatment time (16.5 vs. 6.67 minutes).
Conclusions: Subdividing IRE pulses and adding delays throughout the treatment can reduce white tissue coagulation and electric current, while maintaining IRE treatment sizes.
Introduction
Irreversible Electroporation (IRE) is an energy directed therapeutic used to treat patients with unresectable tumors [Citation1]. This focal ablation technique relies on the application of brief, high-amplitude, pulsed electric fields between two or more needle applicators/electrodes to increase the transmembrane potential of a cell above a critical threshold, destabilizing the lipid bilayer of the cell membrane, increasing the cell-membrane permeability, and ultimately leading to cell death within the targeted region [Citation1–3]. The overall ablation volume is contingent on the underlying tissue properties and the various energy delivery parameters [Citation4]. Energy delivery can be partially defined as a function of the physical delivery system (the electrode geometry, the number of electrodes utilized, and electrode spacing), as well as the systematic electrical pulse parameters (voltage amplitude, pulse frequency, and pulse repetition). The proper tuning of these electrode properties and pulse parameters can enable a targeted, non-thermal treatment of local and inoperable tumors. Consequently, this minimally invasive technique can be used to target malignancies enveloping critical structures (blood vessels, major nerves, etc.) and is less influenced by the convective effects of local blood perfusion (heat sink effect) in comparison to thermal ablative technologies (radiofrequency ablation, and microwave ablation, etc.) [Citation5]. Additionally, the non-thermal nature of IRE encourages a unique immune response compared to other ablative technologies. More recently, it was shown that IRE could trigger as much as 2-3 times the amount of T cell proliferation in comparison to thermal therapies [Citation6].
While the mechanisms for IRE cell death are non-thermal, temperature and electric current variations occur due to high electric field gradients immediately adjacent to the needle electrodes. Treatment of large tumors benefit from higher voltages which in turn cause moderate temperature and current variations, the latter has been linked to overall treatment outcomes [Citation4,Citation5,Citation7,Citation8]. Studies have shown that while a higher delivered electrical energy can be associated with larger treatment zones, it also causes an increase in white tissue coagulation due to Joule heating effects [Citation9,Citation10]. Some thermal mitigation strategies have been explored, including methods to absorb and remove heat via internal perfusion and the use of phase change materials within the electrode/applicator core [Citation11–13]. However, these methods may increase operational complexity and/or require thicker electrodes. In many instances, clinicians performing IRE treatments will also rely on increasing the number of monopolar IRE applicators to three or more to encompass a large or irregularly shaped tumor. On these occasions, conventional IRE generators would deliver the entirety of the set number of pulses for a given electrode pair before proceeding to the next electrode pair until all of the desired electrode pair combinations have been activated, minimizing the conductive and convective cooling of the tissue and promoting thermal damage.
This study investigates the effects of various cycled pulsing paradigms in comparison to conventional pulsing schemes via a multi-electrode IRE therapy (4-electrode configuration) on the IRE treatment zone size, deployed electrical current, temperature changes, and treatment time. We hypothesized that subdividing the number of pulses delivered per electrode pair; and adding delays throughout the treatment could reduce tissue temperatures, electric current, and the overall thermal damage while maintaining IRE treatment zone sizes. Further, an adjustment to the order in which each electrode pair is activated during treatment was also explored in an attempt to further minimize the potential for Joule heating.
Materials and methods
Electroporation pulse delivery
All IRE treatments were performed in a perfused organ model [Citation13,Citation14]. A total of six livers were used for this study with 6 – 8 treatments delivered per liver using a 4-electrode configuration electrode array. Five cycled pulsing variations were performed () and evaluated in comparison to the conventional algorithm provided with a commercially available IRE generator (NanoKnife®, AngioDynamics, Marlborough, MA). The commercial NanoKnife® pulsing protocol deposits the total number of pulses desired across one electrode pair before moving to the next electrode pair, as illustrated within where 100 pulses are deposited per electrode pair. This pulsing algorithm includes a 3.5 s delay per every 10 pulses to recharge the capacitor bank, which inherently provides some thermal mitigation at the expense of overall treatment time. By comparison, the cycled pulsing schemes investigated differ slightly by partitioning of the pulse-train into subsets of pulses (30, 60, 120, etc.) and cycling between active electrode pairs until the desired final number of pulses is achieved per electrode pair (. Thus, the ‘5 pulse cycle, 0 s delay’ scheme applies 20 pulses per electrode pair (6 electrode pairs), yielding a total of 120 pulses per ‘cycle’. This procedure is repeated until a total of 600 pulses are applied (i.e., a total of 5 cycles). While there is no delay associated with this method, the addition of a delay between each cycle was also investigated. Lastly, the order in which electrode pairs activate was examined to minimize consecutive electrode activation. illustrates the enhanced electrode pair activation pattern (EPAP) evaluated.
Figure 1. (A) Illustration of the conventional NanoKnife® pulse delivery scheme where, 100 pulses were delivered per electrode pair for a total number of 600 pulses to the target tissue. (B) An example of a cycled pulse paradigm (5 pulse cycle, 0 s delay scheme), where, 20 pulses were delivered per electrode pair, yield 120 total pulses per cycle and, again, a total of 600 pulses to the target region. (C) The same cycled pulse paradigm shown in B with an enhanced electrode pair activation pattern such that no single electrode was activated more than two consecutive times.
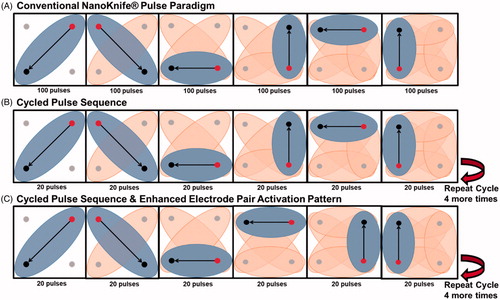
Table 1. Summary of the treatment variations of cycled pulse sequencing. Six different pulsing paradigms were compared. The conventional NanoKnife® pulsing sequence inherently incorporates a 3.5 s delay per every 10 pulses, while all other pulsing paradigms implements their delays between cycles. Pulse delivery was iterated between 4-monopolar electrodes equally spaced apart by 2 cm, with an electrode exposure of 1.5 cm. The IRE generator was set to deliver 600 pulses at a rate of 90 pulses per minute and a constant voltage of 2700 V.
Perfused whole organ tissue testing
Organ preparation
All experimental IRE procedures were performed on a previously validated perfused organ model [Citation13,Citation14]. Porcine livers were excised at a local abattoir and immediately fit with Luer-Lock connectors at the major ports of the specimen for a constant pressure flush (∼90 mmHg) with three liters of modified phosphate buffer solution (conductivity of ∼0.8 S/m) to mitigate thrombosis and improve overall tissue perfusion. The tissue was then transported via static cold storage (SCS) until anastomosed to the organ preservation system (∼120 min on SCS). The perfusate temperature on the preservation system was set and maintained at 30 °C. After IRE treatments were delivered, organs were maintained on the system for an additional 2 h at hypothermic conditions, 4 °C, and prior to sectioning/staining. A total of six livers were used, with 6–8 treatments performed per liver (total N = 42). All animals were euthanized and handled in strict accordance with good animal practice as defined by the relevant national and local animal welfare bodies, and approved by Virginia Tech.
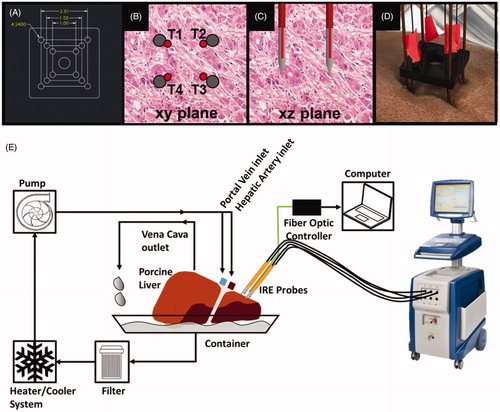
To ensure that all electrodes were equidistant for each treatment performed during these experiments, a custom built ‘support block’ was designed and laser-cut from acrylic material. illustrates the monopolar support block for the 4-monopolar electrode configuration, fiber optic sensor placement relative to the electrode array, and a detailed schematic of the machine perfused liver model.
Figure 2. (A) Computer-Aided Design of a 4-electrode support device to ensure equidistant spacing throughout each treatment, showing critical dimensions (units in cm), (B, C) fiber optic thermal sensor (red) placement in the ‘xy’ and ‘xz’ plane, respectively. Each temperature sensor was labeled T1 – T4 to understand temperature trends at each electrode. (D) The implementation of the support devices on the perfused organ model for the 4-monopolar electrode configuration. (E) Schematic diagram of the perfusion, fiber optic thermal measurement, and pulse delivery systems.
Morphologic analysis
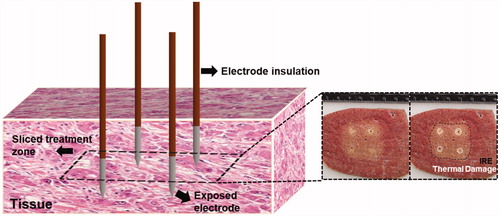
Sectioning was performed 2 h after the last ablation performed to allow for IRE changes to manifest [Citation15]. The total perfusion time was no more than 6 h. The tissue was sectioned and sliced through the mid-plane of the treatment regions for gross evaluation. These sections were stained with triphenyl tetrazolium chloride (TTC) (MP Biomedicals, LLC Santa Ana, California) in phosphate buffered saline (15 g/L) for 5–10 min without light exposure. Following staining, the treatment zones were photographed and measured along the long and short axis to determine the overall area of the treatment region. Samples were fixed in formalin overnight and measured once more 12 h later. Prior studies have shown no statistical difference in ablation size when comparing the long and short axis measurements pre- and post-formalin [Citation13,Citation14]. Thus, the post formalin measurements were used to represent ablation size throughout the manuscript. ImageJ software (NIH, Bethesda, MD) was used to analyze and measure the thermally damaged regions and IRE ablated regions of each tissue sample. Briefly, threshold techniques were utilized to identify the thermally damaged tissue (discolored tissue regions) and IRE ablation (pale discolored tissue regions). Then, the average thermally damaged area and average IRE ablation area were expressed as percentage ratio of thermal damage to IRE ablation. illustrates the sectioning and ablation measurement process. It should be noted the calculated IRE ablation area also includes the thermally damaged area; this combination was purposely included to calculate the percentage of thermal damage in proportion to the entire ablation, both nonthermal and thermal.
Figure 3. Schematic showing the placement of four monopolar electrodes. The sliced plane is taken at the midpoint of the IRE ablation depth. One half is used to measure the cross-sectional area. IRE ablation zone and thermally damaged regions are highlighted.
Thermal measurements
Fiber optic thermal sensors (STB, Luxtron m3300, LumaSense, Santa Clara, CA, USA) were adhered to the surface, and positioned at the midpoint of each exposed electrode. The tissue temperature was measured during treatment at a rate of 0.5 samples per second. Temperature data were plotted over time to illustrate the thermal differences between each pulsing paradigm investigated. Further, the collected thermal data were utilized to validate the numerical models. specifies the location of each fiber optic temperature sensor in relation to the electrodes.
Current measurements
The NanoKnife® generated .xml data files containing the treatment protocol and procedure, voltage, current, and resistance information. All data were imported and read using an in-house MATLAB program for analysis of the measured current. Similar data (voltage, current and resistance) were generated and saved for all cycled pulsing paradigms. The total energy delivered to the tissue was calculated via EquationEquation (1)(1)
(1) .
(1)
(1)
where the average voltage, and average current,
are defined as the area under the curve divided by the treatment length.
Numerical modeling of varying cycled pulsing paradigms
Numerical modeling was performed in parallel with experimental procedures to explore the effects of various cycled pulsing paradigms for multi-electrode IRE treatments in ex vivo porcine liver tissue. Previously measured experimental voltage and current data [Citation14] were employed to visualize electroporation-induced changes in electrical conductivity, thereby solving for more representative electric field distributions and applied electric currents. The finite element model was developed using COMSOL Multiphysics v5.4a (COMSOL Inc., Stockholm, Sweden). The domains consisted of liver tissue modeled as a cm ellipsoid and four monopolar NanoKnife® electrodes modeled as cylinders with height, diameter, and spacing of 1.5 cm, 1 mm, and 2 cm, respectively. All numerical model material properties are displayed in [Citation16,Citation17].
Table 2. Material properties used within the numerical model.
The final mesh consisted of 187,418 tetrahedral elements with a maximum of 2,264,706 degrees of freedom. The electric potential distribution was solved using the Laplace equation (EquationEquation (2)(2)
(2) ), and taking the gradient of the electric potential (EquationEquation (3)
(8)
(8) ),
(2)
(2)
(3)
(3)
where
represents the electrical conductivity,
is the electric potential, and
is the electric field. Considering a four-electrode configuration, and assuming that all six electrode pair combinations were used within the treatment, a total of six current modules were required to solve for the effective electric field distribution, each of which had imposed boundary conditions of
and
All external boundaries were set as electrically insulating with the boundary condition
Prior studies [Citation18–20] have shown tissue electroporation results in an increase in bulk tissue electrical conductivity. This effect is captured in the model by using a sigmoidal curve previously characterized in O’Brien et al. [Citation13] for porcine liver tissue on the perfused organ model,
(4)
(4)
where
is the initial non-electroporated conductivity,
is the peak electroporated conductivity,
is the magnitude of the electric field at any given position, and D, B, and A are fitting terms. In the context of the perfused organ model, the empirically determined values for
D, B, and A are 0.12 S/m, 0.42 S/m, 10, 30 V/cm, and 580 V/cm, respectively [Citation14]. Due to the increase ionic mobility during therapy, the electrical conductivity of biological tissue increases with temperature, and is incorporated within the model via the electrical conductivity temperature coefficient,
(5)
(5)
For direct current (DC) and low-to-medium frequencies (30 kHz–1 GHz), is a positive coefficient taking on values between
[Citation21]. Here, the
coefficient was defined as
Temperature profiles are simulated using Pennes’ bioheat equation that models conductive heat transfer and includes effects of heat dissipation due to a distributed blood perfusion term. The bioheat equation was modified to incorporate IRE Joule heating effects through the addition of a Joule heating term. To reduce computational time, the energy delivered during one pulse (100 µs) was averaged over the pulsing period (1 s) by scaling this Joule heating term to the duty cycle of the pulse. Thus, discrete pulses can now be defined as a continuous heat source without complex modifications to the numerical time stepping.
Lastly, the cycled pulsing schemes are implemented by combining the duty cycle approach with time dependent ‘thermal envelopes’. These thermal envelopes are implemented analytically where a defined coefficient is used to simulate the on (
) and off (
) period of the Joule Heating term. Since the Joule Heating term is a continuous source, these ‘thermal envelopes’ enable the numerical model to mimic cyclic pulsing across various electrode pairs, with Joule Heating occurring only across the immediately energized electrode pair. This resulted in the following equation,
(6)
(6)
where ρ describes the density of tissue,
is the specific heat of tissue,
is the thermal conductivity,
is the perfusion,
describes the density of blood,
is the specific heat of blood,
is the arterial blood temperature,
represents the electrical conductivity,
is the period per pulse, and
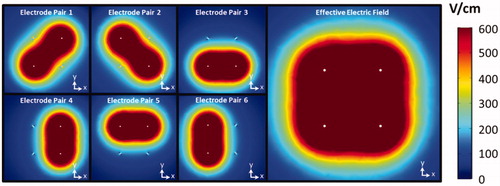
represents the on-time per pulse. illustrates the numerically calculated electric field distributions for each individual electrode pair and the cumulative or effective electric field using the conventional NanoKnife® pulsing paradigm for a four electrode configuration. The area was calculated for tissue that exceeded electric field thresholds of 400, 600 800, and 1000 V/cm and both the conventional and enhanced EPAPs using a surface integration taken across the plane at the midpoint of the electrodes within the 3D model.
Figure 4. Visualization of the electric field distributions for each electrode pair. The combined maximum intensity of each individual field represents the effective electric field distribution from treatment with this four electrode array. This sequence of pulsing represents the conventional NanoKnife® pulsing scheme.
The accumulation of tissue thermal injury tissue due to pulsing was quantified using a thermal damage function initially quantified by Henriques’ and Moritz [Citation22],
(7)
(7)
where
is the frequency factor (
),
is the activation energy (
),
is the universal gas constant,
is the absolute temperature in Kelvin, and
is the total injury due to thermal insult. A value of, Ω
was used to define the minimum conditions to obtain irreversible hepatic white tissue coagulation [Citation21–24].
The total treatment time was calculated using the formula displayed in EquationEquation (8)(8)
(8) ,
(8)
(8)
where P# is defined as the number of pulses per electrode pair, represents the delay between cycles,
is the total number of electrode pair combinations employed in the therapy,
is the number of cycles, and f is the pulse delivery rate (90 pulses per minute).
To determine and closeness of fit and validate the numerical model, the numerically calculated initial and final electrical current for each pulsing scheme was compared to the experimentally measured initial and final current. Further, the temperature at each electrode was calculated and compared to the experimentally measured temperatures at each electrode.
Numerical model validation
The numerical model current was determined by integrating the normal current density over the sink electrode. Percentage error calculations were performed to compare the numerically calculated currents and average experimentally measured currents at the start and end of treatments. Further, temperature measured at each electrode was compared to the numerical model via root mean square error (RMSE) calculation, also shown in . illustrates the closeness in fit from a thermal perspective.
Figure 5. Illustrates the measured and numerically calculated thermal response for a ‘10 pulse cycle, 10 s delay’ pulsing sequence at electrode 2 (T2). A schematic illustrating fiber optic thermal probe location relative to electrodes is shown in the top right corner of the figure. The average RMSE for each electrode was 6.02 °C for this pulsing paradigm.
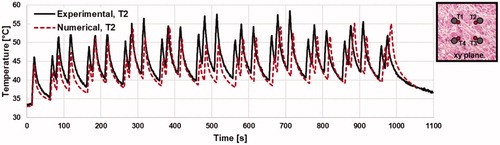
Table 3. Comparison between the numerical model and actual experimental results for the initial and final current of each pulsing scheme.
Statistical analysis
A total of six livers were used, with 6–8 treatments performed per liver (total N = 42). Data are presented as mean values standard deviation of the mean. A one-way analysis of variance (ANOVA) was used to determine whether different pulsing paradigms yielded an effect for the parameter of interest. For parameters in which the ANOVA showed an effect, a secondary Tukey’s test was performed to determine which pulsing paradigm(s) were significantly different from others. All statistical analysis was performed within JMP® Pro version 14.0.0 (SAS Institute Inc., Cary, NC).
Results
Perfused whole organ tissue testing
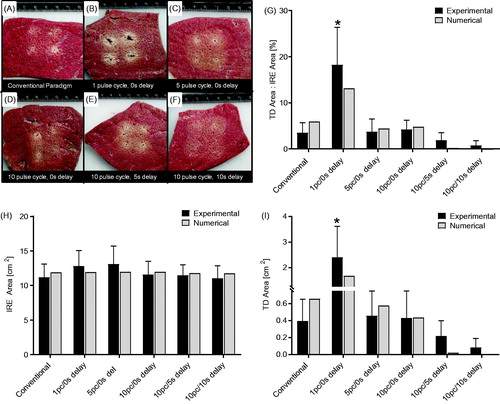
display representative images of the cross-sectional tissue samples for each pulsing paradigm tested, along with the corresponding ratio percentage of thermal damage to IRE ablation. shows the percentage ratio of white tissue coagulation area to IRE treatment zone area for each pulsing scheme. These measurements illustrated that 20.59 ± 6.48% of the ablation presented white tissue coagulation for the ‘1 pulse cycle, 0 s delay’ pulse scheme, whereas all other groups demonstrated less than 5% white tissue coagulation associated with the ablation (p < .0001, all pairwise comparisons). Similarly, express average IRE treatment zone area and white tissue coagulation area, respectively. No statistical significance was found between IRE treatment zone area for any pulse schemes evaluated. However the ‘1 pulse cycle, 0 s delay’ pulse scheme produced, 2.53 ± 0.48 cm2 of white tissue coagulation whereas all other groups demonstrated less than 0.5 cm2 white tissue coagulation associated with the IRE treatment zone (p < .0001, all comparisons).
Figure 6. Representative cross-sectional tissue sample images for the (A) conventional paradigm, (B) 1 pulse cycle, 0 s delay, (C) 5 pulse cycles, 0 s delay, (D) 10 pulse cycles, 0 s delay, (E) 10 pulse cycles, 5 s delay, (F) 10 pulse cycles, 10 s delay. Further, a comparison between the experimental and numerical results for (G) the percentage ratio of white tissue coagulation area to IRE treatment zone area (p < .0001, all pairwise comparisons), (H) the average cross-sectional ablation area for each pulse scheme, and (I) the average area of white tissue coagulation (Ω=2.3, p < .0001, all pairwise comparisons).
illustrates the energy delivered for each pulse paradigm tested. No statistical significance was found between experimental groups in energy deposition. The ‘1 pulse cycle, 0 s delay’ group induced an average energy of 2.33 ± 0.35 kJ, while the commercial pulse scheme yielded a 2.09 ± 0.37 kJ on average. The ‘5 pulse cycle, 0 s delay’, ‘10 pulse cycle, 0 s delay’, and the ‘10 pulse cycle, 10 s delay’ averages of 1.98 ± 0.32 kJ, 1.88 ± 0.34 kJ and 1.89 ± 0.23 kJ, of energy respectively. The ‘10 pulse cycle, 5 s delay’ pulse scheme generated an average energy of 2.14 ± 0.38 kJ.
Figure 7. (A) The calculated average energy delivered to the tissue, and (B) the measured treatment time for each pulse paradigm, where *, #, and % groups are significantly different from one another (p < .0001, all pairwise comparisons).
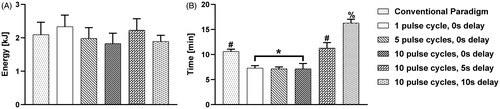
expresses the measured treatment duration. Here, all pulse cycle groups with a zero second delay were statistically similar in treatment time and further displayed shorter treatment times on average (approximately 7 min for all 0 s delay pulse schemes; p < .0001 all pairwise comparisons, group *) than other pulse schemes. The conventional paradigm and ‘10 pulse cycle, 5 s delay’ group were found to be statistically similar compared to other groups (10.61 ± 0.46 min, and 11.29 ± 1.11 min; p < .0001 all pairwise comparisons, group #). Lastly, the treatment time for the ‘10 pulse cycle, 10 s delay’ group was the longest on average and statistically greater than all other groups (16.29 ± 0.76 min, p < .0001 all pairwise comparisons, group %).
Numerical model results
Here we assumed that the minimum electric field required to induce cell death with HFIRE (the lethal threshold) could be determined by comparing the measured ablation area with those predicted from the numerical model [Citation25–28]. The electric field that yielded the closest matching volumetric dimensions would be designated as the lethal threshold. illustrates the area of tissue within the electric field threshold of 601 V/cm for each pulse paradigm. This threshold was most similar to the experimentally measured IRE areas for each pulse paradigm (∼12 cm2). There was no more than 3% difference, between any of the pulsing schemes 400, 600, 800, or 1000 V/cm. Volume integration for tissue greater than 601 V/cm was also performed, which revealed approximately 25 cm3 of tissue with an electric field threshold of 601 V/cm.
illustrates the thermally damaged tissue area for each pulse scheme. The ‘1 pulse cycle, 0 s delay’ pulse group portrayed 1.68 cm2 of tissue experiencing white tissue coagulation (Ω = 2.3), well within one standard deviation of the experimental data (difference of 0.72 cm2). The conventional pulsing protocol yielded at 0.65 cm2 of tissue experiencing white tissue coagulation. The ‘10 pulse cycle, 10 s delay’ pulse cycle sequence illustrated the least, with an area of 0.005 cm2, or a 99.3% reduction of thermal damage area in comparison to the conventional pulse scheme. Each multi-cycle pulsing paradigms illustrated less area thermal damage on average than the single-cycle scheme (‘1 pulse cycle, 0 s delay’ and the conventional pulse scheme).
The percentage ratio of thermal injury area to IRE ablation area was also evaluated numerically. These numerical results were within one standard deviation of the experimentally measured results and indicated that as much as 13.14% of the ‘1st pulse cycle, 0 s delay’ ablation area would present white tissue coagulation. illustrates these findings in detail.
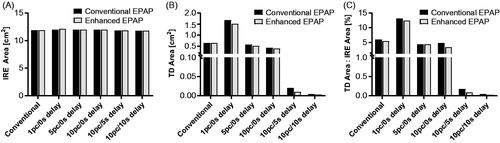
Further, a direct comparison between the conventional and enhanced EPAPs was performed to identify any significant differences in IRE or white tissue coagulation areas. The results indicate essentially no changes to the IRE area () and a slight, but not statistically significant, reduction in thermal damage area () for all pulse paradigms. Overall, the incorporation of cycled pulsing, with an enhanced EPAP could reduce the surface area and volumetric thermal damage by as much as 13.6% in comparison to the conventional pulse paradigm, while maintaining the effective electric field thresholds within 2.1%.
Figure 8. Numerical modeling data of (A) the area of tissue that experiences an electric field greater than 601 V/cm for the conventional and enhanced EPAPs. (B) The area of tissue that experiences thermal damage (Ω=2.3) for both EPAPs. (C) The percentage ratio of thermal damage area to IRE treatment zone area. The initial temperature within the numerical model was set to to match the experimental settings.
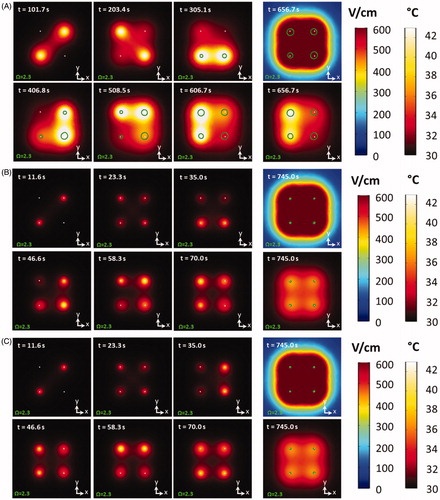
shows the numerical results for the comparison of the conventional sequence (), a 10 pulse cycle, 5 s delay pulse paradigm (), and the same cycled pulse paradigm model with an enhanced EPAP (. Analysis was performed across the plane, at the midpoint of the electrodes within the 3 D model. A series of time-lapse images illustrates the thermal distribution at the first cycle of each electrode pair. The farthest right panels illustrate the thermal distribution and effective electric field at the completion of each treatment. Further, the boundary at which white tissue coagulation (Ω=2.3) occurs is overlaid and outlined in green. The thermal distribution throughout and completion of treatment illustrates an asymmetric thermal distribution for the conventional pulse paradigm, while both cycled pulsing schemes illustrated uniform temperature distributions and smaller thermal damage volumes. Two supplemental videos labeled Multimedia S1A (https://doi.org/10.6084/m9.figshare.9599690) and Multimedia S1B (https://doi.org/10.6084/m9.figshare.9598943), illustrate more detail on these numerical findings and demonstrate the differences between the ‘1 pulse cycle, 0 s delay’ and the ‘5 pulse cycle, 0 s delay’ pulse paradigms.
Figure 9. The numerically derived thermal distribution at the completion of each initial electrode pair activation, as well as the final electric field and thermal distribution 50 s post therapy for a (A) conventional paradigm and conventional EPAP, (B) a cycled pulsing paradigm (10 pulse cycles, 5 s delay) with a conventional EPAP, (C) a cycled pulsing paradigm (10 pulse cycles, 5 s delay) with an enhanced EPAP. The time at each electrode pair activation is displayed in the top left corner. The area in which the onset of thermal damage occurs (Ω=2.3) is outlined in green. Initial temperature within the numerical model was set to to match the experimental settings.
Discussion
In this study, the effects of varying pulsing paradigms on induced current, resultant temperature, and treatment zone size were investigated for multi-electrode (4-electrode configuration) IRE treatments. The desirable effects of IRE treatments are not dependent on thermal events, but thermal damage can still occur due to Joule heating [Citation7]. The restructuring of the pulse delivery mechanism with the intent to redistribute the delivered energy uniformly across all electrodes and reduce the successive on (energized) time that any active electrode may experience throughout treatment could improve IRE treatment by limiting thermal tissue damage, preventing generator crashes, and enhancing energy delivery to the tissue.
Finite Element Analysis provided insight into the effects of cycled pulsing on the temperature distribution, and thermal injury distribution. More specifically, it was found that cycled pulsing patterns mitigate the overall temperature rise and thermal damage in comparison to single cycle pulsing schemes. Further, the work reported here illuminated the potential importance of electrode-pair activation-order within the pulsing scheme. Although, the difference was not large, any reduction in potential thermal damage is critical for clinicians operating in sensitive regions. Additionally, the procedure time was also evaluated, as too long of a treatment time could increase risk within the operating room and ultimately deter clinicians from adopting such pulse schemes.
The experimental results utilizing a perfused organ model as a test bed demonstrated that the use of cycled pulse paradigms can reduce the effects of Joule heating while effectively maintaining and, in some cases, improving the IRE treatment zone dimensions in comparison to treatments administered with a conventional pulse scheme. We have verified the effects of using pulse cycle patterns on electrical current, tissue temperature, treatment zone size, and total treatment time for several pulsing schemes. The results indicated that the ‘5 pulse cycle, 0 s delay’ pulsing scheme provided the largest ablation areas while maintaining a relatively low electrical current output and thermal damage index on average. By comparison, the conventional NanoKnife® pulsing scheme yielded the second smallest ablation area, a longer treatment time, and a slightly larger electrical current output on average. Regardless, all of the multi-cycle pulse paradigms evaluated yielded a lower current output and larger ablation area than both single-cycle pulse schemes. Further, experimental testing established that inter-cycle delays become a critical factor in determining statistical significance between pulse schemes.
We acknowledge that our results must be interpreted with caution. For example, it should be noted that the numerical models described throughout this work define tissue temperature at 30 °C to match the perfused organ model settings, rather than a more representative tissue temperature during surgery (∼35 °C). Further, the numerical model defines tissue perfusion as a constant value and as half the physiologic value found in literature [Citation16] to “gain a” better match the perfused organ model settings [Citation13]. Models were developed to evaluate the thermal damage volumes at these elevated temperatures and perfusion settings. These models revealed larger thermal injury volumes (<2.2 cm3 difference). However, the differences in thermally damaged area for cycled pulse schemes in comparison to the conventional pulse paradigm remained similar. Further, each of the numerical models described throughout this work defined tissue perfusion as constant. A more representative model might express perfusion as a function of electroporation, heating, and/or thermal damage [Citation17,Citation29,Citation30]. Another limitation is that only explanted, actively perfused porcine liver tissue was used within this study and the verification of this thermal mitigation strategy for other tissue types is still required. Further, all liver tissue used was from healthy animals and the presence of significant liver pathology (i.e., steatohepatitis, cirrhosis, or tumors, for example) may alter IRE effects. Additionally, the cycle pulsing paradigms evaluated were not exhaustive. More studies are required to optimize the mitigation of thermal tissue damage via IRE pulse delivery. We also appreciate that the work shown here was only for a 4-electrode configuration and that other electrode configurations could respond differently to cycled pulsing schemes. Further, the work herein could be useful in the development of high voltage generators in the future. The conventional NanoKnife® generator results were effective, but ultimately serendipitous. The reduction in white tissue coagulation was a direct result of the 3.5 s delay built into the energy delivery scheme. This delay was added as a safety feature to account for the small capacitor banks within the generator.
In conclusion, this study tested the effects of using several pulse-timing paradigms on electrical current, tissue temperature, and tissue treatment size. This work successfully shows that cycled pulsing schemes reduce the electrical current, increase the treatment zone size, and ultimately maintain a low tissue temperature in comparison to conventional pulsing schemes in an ex vivo perfused porcine liver model. Cycled pulsing patterns may hold promise for enhancing the efficacy of IRE application in clinical practice. This technology could lead to better overall outcomes for patients.
Disclosure statement
Rafael V. Davalos, John L. Robertson, Robert E. Neal II., Timothy J. O’Brien, and Melvin F. Lorenzo all have issued and pending patents in the area of irreversible electroporation and may receive royalties. Robert E. Neal II. is an employee of Angiodynamics (Marlborough, MA). Further, S. Nahum Goldberg is a consultant to Angiodynamics (Marlborough, MA), Cosman Company (Cambridge, MA), and XACT Robotics (Caesaria, Israel).
Additional information
Funding
References
- Davalos RV, Mir LM, Rubinsky B. Tissue ablation with irreversible electroporation. Ann Biomed Eng. 2005;33:223–231.
- Al-Sakere B, André F, Bernat C, et al. Tumor ablation with irreversible electroporation. PLoS One. 2007;2:e1135–e1138.
- Weaver JC. Electroporation: a general phenomenon for manipulating cells and tissues. J Cell Biochem. 1993;51:426–435.
- Ben-David E, Ahmed M, Faroja M, et al. Irreversible electroporation: treatment effect is susceptible. Radiology. 2013;269:738.
- Bulvik BE, Ahmed M, Andriyanov AV, et al. Irreversible electroporation versus radiofrequency ablation : a comparison of local and systemic. Radiology. 2016;280:413–424.
- Shao Q, et al. Engineering T cell response to cancer antigens by choice of focal therapeutic conditions. Int J Hyperth. 2019;0:1–9.
- Davalos RV, Rubinsky B. Temperature considerations during irreversible electroporation. Int J Heat Mass Transf. 2008;51:5617–5622.
- Bonakdar M, Latouche EL, Mahajan RL, et al. The feasibility of a smart surgical probe for verification of IRE treatments using electrical impedance spectroscopy. IEEE Trans Biomed Eng. 2015;62:2674–2684.
- Faroja M, Ahmed M, Appelbaum L, et al. Irreversible electroporation ablation: is all the damage nonthermal? Radiology. 2013;266(2):462–470.
- Ahmed M, Solbiati L, Brace CL, et al. Image-guided tumor ablation: standardization of terminology and reporting criteria–a 10-year update. Radiology. 2014;273(1):241–260.
- Arena CB, Mahajan RL, Nichole Rylander M, et al. An experimental and numerical investigation of phase change electrodes for therapeutic irreversible electroporation. J. Biomech. Eng. 2013;135(11):111009. DOI: 10.1115/1.4025334.
- Jiang C, Shao Q, Bischof J. Pulse timing during irreversible electroporation achieves enhanced destruction in a hindlimb model of cancer. Ann Biomed Eng. 2015;43(4):887–895.
- OBrien TJ, et al. Effects of internal electrode cooling on irreversible electroporation using a perfused organ model. Int J Hyperth. 2018;35(1):44–55.
- Bhonsle S, Bonakdar M, Neal RE, et al. Characterization of irreversible electroporation ablation with a validated perfused organ model. J Vasc Interv Radiol. 2016;27(12):1913–1922.e2.
- Lee EW, Chen C, Prieto VE, et al. Advanced hepatic ablation technique for creating complete cell death: irreversible electroporation. Radiology. 2010;255(2):426–433.
- Hasgall P, Di Gennaro F, Baumgartner C, et al. IT’IS Database for thermal and electromagnetic parameters of biological tissues. 2018. [Online]. Available from: www.itis.ethz.ch/database
- Haemmerich D, Wood BJ. Hepatic radiofrequency ablation at low frequencies preferentially heats tumour tissue. Int J Hyperth. 2006;22(7):563–574.
- Bhonsle S, Lorenzo M, Safaai-Jazi A, et al. Characterization of nonlinearity and dispersion in tissue impedance during high frequency electroporation. IEEE Trans Biomed. 2017;X(X):1–12.
- Miklavcic D, Sel D, Cukjati D, et al. Sequential finite element model of tissue electropermeabilisation. Conf Proc IEEE Eng Med Biol Soc. 2004;5:3551–3554.
- Ivorra A, Al-Sakere B, Rubinsky B, et al. In vivo electrical conductivity measurements during and after tumor electroporation: conductivity changes reflect the treatment outcome. Phys. Med. Biol. 2009;54(19):5949–5963.
- Rossmanna C, Haemmerich D. Review of temperature dependence of thermal properties, dielectric properties, and perfusion of biological tissues at hyperthermic and ablation temperatures. Crit Rev Biomed Eng. 2014;42(6):467–492.
- Henriques FC, Moritz AR. Studies of thermal injury. I. The conduction of heat to and through skin and the temperatures attained therein. A theoretical and an experiental investigation. Am J Pathol. 1947;23:531–549.
- Chang IA, Nguyen UD. Thermal modeling of lesion growth with radiofrequency ablation devices. Biomed Eng Online. 2004;3:1–19.
- Diller KR, Hayes LJ. A finite element model of burn injury in blood-perfused skin. J Biomech Eng. 1983;105(3):300–307.
- Arena CB, Szot CS, Garcia PA, et al. A three-dimensional in vitro tumor platform for modeling therapeutic irreversible electroporation. Biophys J. 2012;103(9):2033–2042.
- Ivey JW, Latouche EL, Sano MB, et al. Targeted cellular ablation based on the morphology of malignant cells. Sci Rep. 2015;5:1–17.
- Wasson EM, Ivey JW, Verbridge SS, et al. The feasibility of enhancing susceptibility of glioblastoma cells to IRE using a calcium adjuvant. Ann Biomed Eng. 2017;45(11):2535–2547.
- T. J. O'Brien et al., Experimental high-frequency irreversible electroporation using a single-needle delivery approach for nonthermal pancreatic ablation in vivo. J Vasc Interv Radiol. 2019;30(6):854–862.e7.
- Kos B, Voigt P, Miklavcic D, et al. Careful treatment planning enables safe ablation of liver tumors adjacent to major blood vessels by percutaneous irreversible electroporation (IRE). Radiol Oncol. 2015;49(3):234–241.
- Jarm T, Cemazar M, Miklavcic D, et al. Antivascular effects of electrochemotherapy: Implications in treatment of bleeding metastases. Expert Rev Anticancer Ther. 2010;10(5):729–746.