
 ?Mathematical formulae have been encoded as MathML and are displayed in this HTML version using MathJax in order to improve their display. Uncheck the box to turn MathJax off. This feature requires Javascript. Click on a formula to zoom.
Abstract
Purpose: Although experimental data have suggested that temporary occlusion of the coronary sinus (CS) can facilitate the creation of transmural lesions across the atrial wall (AW) during mitral isthmus radiofrequency (RF) ablation, no computer modeling study has yet been made on the effect of the blood flow inside the epicardial vessels and its stoppage by an occlusion balloon.
Methods: Computer simulations using constant power were conducted to study these phenomena by two methods: (1) by setting blood velocity in the CS to zero, which mimics a distal occlusion; and (2) by including a balloon filled with air in the model just below the ablation site, which mimics a proximal occlusion.
Results: For short ablations (15 s) and perpendicular electrode/tissue orientation, lesion size was smaller with proximal occlusion compared to distal or no occlusion, regardless of the AW-CS distance (from 0.5 mm to 3.4 mm). For other angulations (0 and 45°) lesion size was almost the same in all cases. For longer ablations (60 s), the internal CS blood flow (no occlusion) considerably reduced lesion size, while stoppage combined with the proximal presence of a balloon produced the largest lesions. This performance was similar for different catheter angulations (0, 45 and 90°). Balloon length (from 10 to 40 mm) was found to be an irrelevant parameter when proximal occlusion was modeled.
Conclusions: Using an air-filled balloon to occlude CS facilitates mitral isthmus ablation in long ablations, while proximal occlusion could impede transmural lesions in the case of short ablations (15 s).
1. Introduction
Mitral isthmus radiofrequency (RF) ablation is a well-established technique for the treatment of peri-mitral atrial flutter. It classically involves creating an endocardial ablation line extending from the mitral annulus to the left inferior pulmonary vein (LIPV). The mean distance from the LIPV to the mitral annulus is ∼35 mm [Citation1], while the mean thickness of the atrial wall in this region is only 3 mm, which suggests that a transmural lesion should be achieved with the currently used ablation catheters. However, the presence of two epicardial vessels (left circumflex coronary artery –LCx– and coronary sinus –CS–) near the mitral annulus is thought to act as a heat-sink and to prevent transmural lesions during endocardial ablation by removing heat from the sub-epicardial muscle fibers in the mitral annulus. In fact, an experimental study by Fuller and Wood [Citation2] demonstrated that the blood flow in the intramyocardial vessels prevents the formation of transmural lesions, at least does so in the case of a thin marginal artery (0.34 mm diameter). In the larger vessels, such as the CS, direct evidence of its role in heat-sink was found in a previous work by some of the present authors [Citation3], which studied the effect of temporary occlusion of the CS with an air-filled balloon to displace the blood pool in a porcine model. The balloon was positioned with its center just under the ablation point. The results showed that when the balloon was not inflated, 90% of the ablation lines were not ablated on the most epicardial side of the mitral isthmus. However, transmural lesions were achieved on all lines when the balloon was inflated. There was no significant difference in catheter tip temperature, mean power or impedance with and without CS balloon inflation, which suggests that CS occlusion was the critical factor in creating transmural lesions.
Although there is experimental evidence on the thermal effect of the epicardial vessels in the mitral isthmus during RF ablation with an occlusion balloon, some important issues have still not been addressed, for example the effect of balloon length, the distance between atrial wall and epicardial vessels, and ablation duration. Although computer modeling has traditionally been used as a proof-of-concept before conducting ex vivo and in vivo experiments, in this case it seems reasonable to use an in-silico model to solve these questions. In fact, this approach can map electrical current density distribution around the ablation electrode, which is impossible with an experimental setup, and could physically explain some of the results. Our objective was thus to describe the electrical and thermal impact of vascular structures near the ablation line and the effect of occluding the CS with an air-filled balloon during mitral isthmus ablation in a mathematical model including electric, thermal and fluid dynamics associated with RF cardiac ablation near vascular structures.
2. Methods
2.1. Model geometry
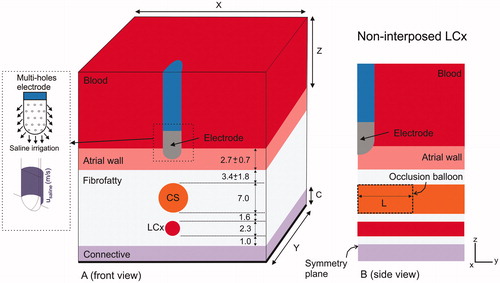
shows the modeled physical situation in which an ablation electrode is placed on the endocardium following an ablation line extending from LIPV to mitral valve (MV) [Citation4]. Two epicardial vessels (left circumflex coronary artery –LCx– and coronary sinus –CS–) are typically situated just below this ablation line. shows the geometry and dimensions of the proposed three-dimensional computational model. It consisted of an irrigated-tip electrode (3.5 mm, 8 Fr) with multi-holes in the distal zone, which corresponds with the commercial model ThermoCool® SF (Biosense Webster, Diamond Bar, CA, USA). To reduce computational complexity, the irrigation holes were not individually included in the physical model, as their small size would require an unnecessarily fine computational mesh in their neighborhood [Citation5,Citation6]. The electrode was initially placed perpendicular to the endocardial surface of the mitral isthmus and inserted into cardiac tissue to a depth of 0.5 mm, similar to the range of penetration depths of RF ablation electrode in frequently ablated areas of the endocardium [Citation7]. The electrode was assumed to be statically placed on a flat surface, specifically at the worst place in terms of capacity to create a transmural lesion, i.e., near to the epicardial vessels, and hence where the heat-sink effect could be expected to be the highest, implying that the length of the ablation line was irrelevant in the context of this study. Indeed, the important parameter in our in silico analysis was the spatial distribution of the elements along the entire wall bounded by the endocardium and epicardium: the atrial wall and epicardial vessels [Citation8].
Figure 1. Anatomical context modeled in the study. Anatomical pictures (left) and histological image (right) showing the spatial relation between the catheter ablation electrode and the two epicardial vessels (left circumflex coronary artery –LCx– and coronary sinus –CS–) (reused from Damián Sánchez-Quintana et al. [Citation4], which is an open access article distributed under the Creative Commons Attribution License).
![Figure 1. Anatomical context modeled in the study. Anatomical pictures (left) and histological image (right) showing the spatial relation between the catheter ablation electrode and the two epicardial vessels (left circumflex coronary artery –LCx– and coronary sinus –CS–) (reused from Damián Sánchez-Quintana et al. [Citation4], which is an open access article distributed under the Creative Commons Attribution License).](/cms/asset/751657ed-f013-45b4-a902-398b5fe13733/ihyt_a_1686181_f0001_c.jpg)
Figure 2. Geometry of the model (out of scale, dimensions in mm). A: Front view showing the spatial distribution of the left circumflex coronary artery (LCx) and coronary sinus (CS). The dimensions of cardiac chamber X = 80 mm and Y = 40 mm (Z = Y) and connective tissue C = 23 mm were obtained from a convergence test. An irrigated multi-hole electrode (3.5 mm, 8 Fr) inserted a depth of 0.5 mm in the tissue was modeled: ThermoCool® SF (Biosense Webster, Diamond Bar, CA, USA). The dispersive electrode was modeled by an electrical boundary condition on the bottom surface of the model (thick black line). The saline irrigation through the small holes in the electrode tip was modeled by an inlet velocity boundary condition (usaline) at the electrode-blood interface. B: Side view showing how the CS goes across the model, and the occlusion balloon (length L) occupies the zone exactly under the electrode (proximal occlusion).
The atrial wall (pink in ) was assumed to be composed of muscle fibers. We also included a layer of adjacent fibrofatty tissue surrounding the epicardial vasculature. Due to lack of information on the electrical and thermal characteristics of fibrofatty tissue, we assumed it to be a combination of adipose and connective tissue. Finally, we added the vagus nerve plexus and a zone of fibrous pericardium and fibrofatty tissue of irregular thickness containing arteries. In the computer model this zone was assumed to be homogenous ‘connective tissue’ (see ) and was included farther away in the model so as not to impact on the thermal lesion. The dispersive electrode was modeled as a boundary condition on the bottom surface of the connective tissue layer. The thickness of the convective tissue layer and the cardiac chamber dimensions (X, Y and Z) were estimated by means of a convergence test in order to avoid boundary effects. In this test, the value of the maximal temperature achieved in the tissue (Tmax) after 60 s of RF heating was used as a control parameter. To determine the appropriate parameters of C, X and Y (Z = Y), we increased their values by equal amounts. When the difference in the Tmax between consecutive simulations was less than 0.5% we considered the former values to be adequate. We then conducted a similar convergence test to determine adequate spatial and temporal resolution using the same control parameter. Discretization was spatially heterogeneous: the finest zone was always the electrode-tissue interface, where the largest voltage gradient was produced and hence the maximum value of current density. In the tissue, grid size was increased gradually with distance from the electrode-tissue interface.
Regarding the relative spatial arrangement between LCx and CS, we considered the case of non-interposed LCx, where LCx is beyond the CS, on the site exactly opposite to the ablation electrode. The CS diameter was set to 7 mm [Citation9], while the LCx diameter was 2.3 mm, which is within the reported range of 1.9 – 2.7 mm [Citation8]. The distance between CS and LCx was 1.6 mm [Citation8], and the thickness of the fibrofatty layer from LCx to connective tissue was 1 mm [Citation8].
We redesigned the model to include different electrode-tissue angular orientations, since the electrode is not always perpendicular during ablation inside the left atrium, considering two additional electrode positions with respect to the tissue: 0° (parallel) and 45°. The criterion was to maintain the same electrode insertion depth inside the tissue in all positions, with a different electrode surface in contact with the tissue in each case: 2.04 mm2, 3.72 mm2 and 3.60 mm2 for 90, 45 and 0°, respectively.
2.2. Modeling of the occlusion
We studied the electrical and thermal effect of balloon occlusion of the coronary sinus under different distances from the atrial wall (AW) and CS (from an extremely low value of 0.5 mm to a typical value of 3.4 mm). Stopping the blood flow in the CS was modeled in two ways: (1) by simply setting the blood velocity to zero, to mimic a distant occlusion caused by a balloon at a certain distance from the ablation electrode, and hence where the portion of CS just below the ablation electrode would be full of blood at rest; and (2) by including in the model a balloon filled with air just below the ablation site (see ), i.e., a proximal occlusion. In this second scenario, the effect of the length of the balloon (from 10 to 40 mm) was also assessed. The balloon was assumed to completely stop the blood flow inside the CS. The balloon membrane thickness was considered to be negligible. Two values of atrial wall thickness were considered: 2.7 mm and 3.4 mm. This means we considered four in silico scenarios by varying atrial wall thickness and the AW-CS distance (see and ): case A) typical anatomical values with an atrial wall of 2.7 mm [Citation8] and distance between AW–CS of 3.4 mm; cases B, C and D) with anatomical configurations hampering complete transmural lesions, i.e., atrial wall of 3.4 mm and decreasing AW–CS distances (1.6, 1.0 and 0.5 mm). The different values of AW–CS distance were to model patients of different body size and diverse fibro-fatty tissue thickness.
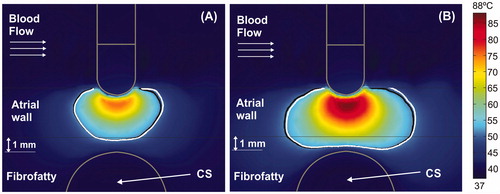
Figure 3. Temperature distributions (scale in °C) at 15 s with the electrode in perpendicular position for four arrangements: (A) typical case with 2.7 mm atrial wall (AW) and 3.4 mm distance from AW to CS (AW-CS distance); (B) 3.4 mm AW and 1.6 mm AW-CS distance; (C) 3.4 mm AW and 1 mm AW-CS distance; (D) 3.4 mm AW and 0.5 mm AW-CS distance. Lines represent the thermal lesion contours for the cases without occlusion (solid white line), with distal occlusion (solid black line), and with proximal occlusion (dashed black line), i.e., with the 40 mm balloon just below the electrode.
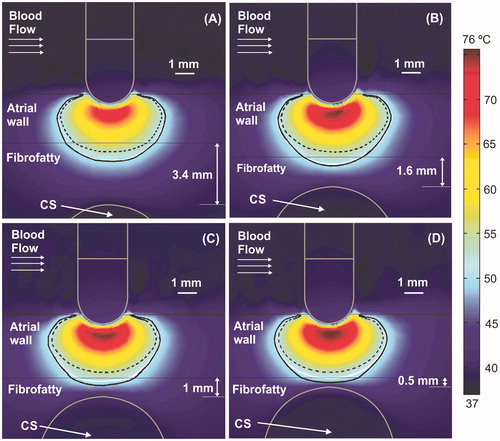
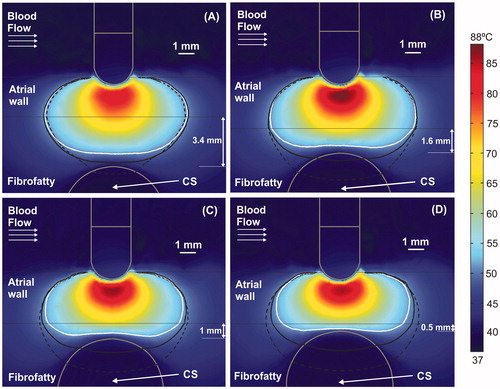
Figure 4. Temperature distributions (scale in °C) at 60 s with the electrode in perpendicular position for four arrangements: (A) typical case with 2.7 mm atrial wall (AW) and 3.4 mm distance from AW to CS (AW-CS distance); (B) 3.4 mm AW and 1.6 mm AW-CS distance; (C) 3.4 mm AW and 1 mm AW-CS distance; (D) 3.4 mm AW and 0.5 mm AW-CS distance. Lines represent the thermal lesion contours for the cases without occlusion (solid white line), with distal occlusion (solid black line), and with proximal occlusion, i.e., with the 40 mm balloon just below the electrode (dashed black line).
The goal of mitral isthmus RF ablation is to create an isolating lesion across the entire AW, i.e., to achieve a transmural lesion while avoiding thermal damage to the epicardial vessels. With this in mind, we planned a set of computer simulations to obtain the temperature distributions and thermal lesion contours for all the above-described cases. The 50 °C isotherm was used as the thermal lesion contour, since previous studies consider this the threshold necessary to achieve irreversible tissue injury [Citation10,Citation11].
2.3. Computer model
The computer model involved solving a coupled electric-thermal-flow problem, which was done numerically using the Finite Element Method (FEM) on COMSOL Multiphysics software (COMSOL, Burlington MA, USA). The governing equation for the thermal problem was the Bioheat Equation, while blood velocity was computed by the incompressible Navier-Stokes Equations in a modeling pipeline similar to the one used in [Citation5,Citation6,Citation12,Citation13]. The Bioheat Equation modified by the enthalpy method [Citation14], incorporating the phase change in order to model tissue vaporization.
(1)
(1)
where ρ was density (kg/m3), h enthalpy (J/kg), t time (s), k thermal conductivity (W/m·K), T temperature (°C), q the heat source caused by RF power (W/m3), Qp the heat loss caused by blood perfusion (W/m3) and Qm the metabolic heat generation (W/m3). Qp was not considered since its effect was expected to be minor in our study [Citation15]. Likewise, Qm was not considered because its effect is negligible in comparison to the other terms [Citation16]. In biological tissues, enthalpy is related to temperature by the following expression [Citation14]:
(2)
(2)
where ρi and ci were the density and specific heat of cardiac tissue before phase-change (i.e., liquid phase, i = l) and post-phase-change (i.e., gas phase, i = g), respectively; Hfg was the latent heat and C the tissue water content. We considered a latent heat value of 2.162 × 10⁹ J/m3, which is the product of the water vaporization latent heat (2257 kJ/kg), the water density at 100 °C (958 kg/m3) [Citation17] and the tissue water content inside the cardiac tissue (75%).
The last term in EquationEquation (1)(1)
(1) is the advection term, which represents the heat loss due to blood flow. The velocity field u(x,y,z) (m/s) is described by the incompressible Navier-Stokes Equations, which consist of a Momentum equation and a Mass equation:
(3)
(3)
(4)
(4)
where P is the pressure (Pa), μ the viscosity of the blood (2.1 × 10⁻³ Pa·s) [Citation18] and F (Fx, Fy, Fz) the body forces (N/m3), which were neglected in the context of our study [Citation13].
At the frequencies used in RF heating (∼500 kHz) and over the distance of interest, the biological medium can be considered almost totally resistive, and a quasi-static approach can therefore be used to solve the electrical problem [Citation19]. The distributed heat source q is then given by q = σ|E|2, where |E| is the magnitude of the vector electric field (V/m) and σ the electrical conductivity (S m−1) · E = –∇Ф is calculated from the gradient of the voltage Φ (V), which, in absence of internal electric sources, satisfies ∇⋅(σ∇Ф) = 0.
The thermal and electrical properties of the model are shown in [Citation12,Citation20]. The initial model temperature was 37 °C, except at the electrode tip, which was 22 °C in order to simulate the initial temperature of an open-irrigated electrode caused by saline irrigation (which is kept at ambient temperature) [Citation5]. The electrical (σ) and thermal conductivity (k) of cardiac tissue were temperature-dependent piecewise functions: for σ we considered an exponential growth of +1.5%/°C up to 100 °C [Citation18], where 0.541 S/m was the electrical conductivity assessed at 37 °C (see ), and was then reduced by 4 orders for five degrees to model the tissue desiccation process [Citation21]; and k grew linearly 0.12%/°C up to 100 °C, 0.531 W/m·K being the thermal conductivity assessed at 37 °C (see ), after which k was kept constant [Citation22].
Table 1. Thermal and electrical characteristics of the elements employed in the models.
We modeled a constant power ablation at the electrode-tip, which is the usual mode for open-irrigated electrodes in RF cardiac ablation [Citation5,Citation6]. All the outer surfaces of the model (except the bottom surface) were fixed to a null electric flux. The voltage on the bottom surface was set to 0 V (dispersive electrode) to mimic a monopolar configuration in which RF current was forced to flow between the active and dispersive electrodes. Constant power RF ablations were simulated using a value of 10 W. Although this value is lower than that clinically employed (20 – 35 W), it was chosen since higher values cause steam pops (100 °C) in the first few seconds, a limitation observed in previous modeling studies [Citation16,Citation23–25]. The reason for this discrepancy between the power used in clinical practice and in the computer model is due to the simplification used in computer models for RF cardiac ablation of including only a relatively small region around the active electrode, i.e., the computational domain includes only a fragment of cardiac tissue and blood, whose size depends on preventing the boundary conditions from affecting the results. Additionally, simulation errors may also be responsible for the discrepancy since our model was experimentally validated. Although this limited domain may be appropriate in terms of thermal behavior, it means that the computational domain includes only a section of the electrical circuit between the active and dispersive electrodes, and hence assumes that practically all the power delivered by the RF generator is absorbed by the area around the active electrode. This situation ignores the fact that the RF current actually passes through tissues of different electrical conductivities (bone, lung, skin, etc.). In the current clinical scenario in which RF cardiac ablation is conducted with programed constant power, it is crucial to know how much of this power is absorbed at the target site and how much by the rest of the thoracic tissues. The part of the electrical circuit not associated with the thermal lesion, i.e., away from the active electrode, has traditionally been ignored, not only in computational modeling but also in ex-vivo models, which have always been based on fragments of cardiac tissue placed in a bath. This meant that both types of study had to ‘justify’ the specified power being less than the power used in clinical practice, since only part of the domain was considered. The problem is that this ‘adjustment’ value has never been sufficiently quantified, in spite of which it is broadly accepted that part of the power applied by the RF generator is somehow lost away from the target. However, in the absence of information on the exact relationship between total power and that deposited around the active electrode, it is not possible to make an exact extrapolation. In any case, an exact quantification of the power is not really necessary, since our computer modeling study was not intended to accurately predict the effects of a specific power level, but to determine how temperature distributions change when the parameters are changed (for example, occlusion vs. no occlusion, type of occlusion, catheter orientation, etc.). In this regard, the exact value of the power used in the model is irrelevant.
Even though ablations imply spot applications of 20–30 s, the simulations took up to 60 s in order to identify any differences in the electrical and thermal impact of the occlusion between short (15 s) and long (60 s) ablations. The results from 20 – 30 s can be expected to be between those obtained for 15 and 60 s.
For the thermal boundary conditions, a null thermal flux was used on the symmetry plane and a constant temperature of 37 °C was fixed on the outer surfaces of the model. For the velocity boundary conditions, an inlet velocity boundary condition was applied to the left surface of the blood volume to simulate a blood flow velocity of 8.5 cm/s, which in previous studies was considered as a high flow rate in the cardiac chamber [Citation13]. We conducted additional simulations with a higher flow rate of 25 cm/s in order to assess whether it had an impact on lesion size, especially on lesion depth and lesion width at epicardium level. The saline irrigation flow was taken into account by an inlet velocity condition in the blood region, applied to the electrode-blood interface surface around the holes, except in the part of the electrode tip inserted in the tissue (see violet zone in ) [Citation5]. The saline velocity condition was calculated as the ratio between the saline irrigation flow rate and the electrode area through which the saline flows. We considered a saline irrigation flow rate of 8 ml/min, since this is the clinical value recommended by the manufacturer for a multi-hole electrode using power levels below 30 W [Citation26].
For the problem of solving the blood velocity distribution, a no slip condition (non-permeable surface) was applied to the upper surfaces of the blood volume, at the tissue-blood and electrode-blood interfaces, and at the vessels walls (CS and LCx). An outlet boundary condition of zero pressure was fixed on the right surface of the blood volume and on the outlet CS surfaces (only in the non-occlusion case) and LCx placed on the symmetry plane. The blood velocity inside the CS (no occlusion) was simulated by an inlet velocity condition of 4 cm/s, which was applied at the CS inlet surface (opposite to the symmetry plane) [Citation9]. In the case of the blood velocity inside the LCx, we simplified the situation by assuming a constant velocity of 0.5 m/s, which is half of the peak value reported in [Citation27], and could be close to the average value. This condition was applied at the CS inlet surface (opposite to the symmetry plane).
Results
After conducting several convergence tests we obtained the following optimum values for some relevant geometrical parameters of the model: dimensions of cardiac chamber, (X, Y) = (80, 40) mm (Z = Y); connective tissue thickness, C = 23 mm; grid size of 0.2 mm in the finest zone (electrode-tissue interface); and time step of 0.05 s. The model had nearly 60,000 tetrahedral elements (10,800 mesh nodes).
shows the temperature distributions at 15 s for four different arrangements without occlusion, along with the lesion contour (white solid lines). The temperature inside the non-occluded CS was always around 37 °C, regardless of the AW–CS distance. The black lines show the thermal lesion contours for cases with distant (solid line) and proximal occlusion (dashed line). Since the effect of changing the balloon length was almost irrelevant in all cases, from now on the figures only represent the 40 mm balloon. shows that in short ablations (15 s) the presence of the air-filled balloon (proximal occlusion) provides smaller lesion sizes than the non-occluded and distal occlusion cases. For instance, for a typical AW–CS distance (), lesion width at the epicardial level is 4.9 mm, both with and without distant occlusion, while it is reduced to 4.0 mm with proximal occlusion. The lesion depth is also 0.6 mm smaller with proximal occlusion than in the other two cases. In general, lesion sizes are very similar with and without distal occlusion, except for a very short AW–CS distance (), where lesion size is smaller without occlusion: lesion width at the epicardial level (interface between atrial wall and fibrofatty tissue) is 3.1 mm for distant occlusion vs. only 1.5 mm without occlusion. No lesion is thus presented at the epicardial level with proximal occlusion. It is also important to note that in short ablations the lesions have an approximately conical shape and are wider at the endocardial level and narrower at the epicardial level.
shows the temperature distributions for a 60 s long ablation in non-occluded cases along with the lesion contour (solid white line). Unlike short durations, the lesions here are more or less oval shaped. It can also be observed that the temperature inside the CS is always around 37 °C, regardless of the AW–CS distance. As opposed to short ablations, the presence here of the internal CS flow (no occlusion) considerably reduced the lesion size, while stoppage combined with the balloon (proximal occlusion) produced the largest lesions. Although both distal and proximal occlusion lesions reached the CS itself, they were 1.5 mm deeper with proximal occlusion.
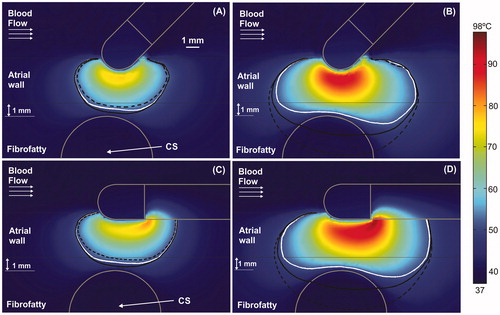
shows the temperature distributions for two different electrode-tissue angular orientations (0 and 45°). Only the case of the 3.4 mm thick atrial wall with 1 mm between atrial wall and CS (Case C in and ) was considered. When the electrode was not perpendicular to tissue in a short ablation (15 s), the air-filled balloon (proximal occlusion) caused slightly smaller lesions than the non-occluded and distal occlusion cases (). In particular, at 45°, the lesion width at the epicardial level was reduced from 5.3 mm with distal occlusion to 3.8 mm with proximal occlusion, while at 0° it was reduced from 5.3 mm to 3.5 mm (at 90° it was reduced from 4.9 mm to 4.0 mm). In these cases the lesions were always transmural, unlike the perpendicular position, in which at 15 s the proximal occlusion lesion was not. However, the behavior of the different occlusion types was similar to the perpendicular electrode scenario for larger ablations (60 s), even though temperature distributions next to the electrode tip were slightly different, especially at 0°, when the hottest point was at the electrode-plastic shaft joint (). The initial impedances slightly varied depending on the angle: 98 Ω, 99 Ω, and 99 Ω for 90°, 45° and 0°, respectively.
Figure 5. Temperature distributions (scale in °C) for the case of 3.4 mm atrial wall and 1 mm between atrial wall and CS, considering two electrode angular orientations with respect to the tissue: 45° at 15 s (A) and at 60 s (B); and 0° (parallel) at 15 s (C) and at 60 s (D). Lines represent the thermal lesion contours for the cases without occlusion (solid white line), with distal occlusion (solid black line), and with proximal occlusion, i.e., with the 40 mm balloon just below the electrode (dashed black line).
Discussion
It is currently accepted that the creation of contiguous and transmural linear lesions across the mitral isthmus is technically challenging and may be associated with significant complications [Citation28]. Since extensive ablation on the mitral isthmus can cause serious complications, including cardiac tamponade, circumflex artery occlusion, and atrio-esophageal fistula [Citation29,Citation30], increasing the RF power and ablation duration should be performed very carefully because of the increased risk of complications [Citation31]. For this reason alternative strategies may be explored to overcome certain anatomic limitations and achieve durable mitral isthmus block, such as cryoablation [Citation32], ethanol infusion into the vein of Marshall [Citation33], and temporary occlusion of coronary sinus blood flow [Citation34,Citation35]. Our study aimed to assess the thermal impact of vascular structures near the ablation site during mitral isthmus ablations. In particular, we focused on the proximity of the CS, which has been suggested to act as a heat-sink [Citation3]. We also assessed how a CS occlusion can alter temperature distributions. We distinguished between two possible scenarios: a proximal occlusion by air-filled balloon placed in the CS segment just below the ablation electrode, and a distant occlusion balloon, in which case the mentioned CS segment is full of blood instead of air. Methodologically, we chose an in silico model, since it is almost impossible to keep the variables involved under control in an experimental setup (in vivo/ex vivo): i.e., distance between AW and CS, accurate relative location between ablation electrode and occlusion balloon, blood flow inside CS, etc.
Our results suggested that the CS may work as a heat-sink (when vascular flow is not stopped), keeping its surrounding temperature to ∼37 °C for short (15 s) and long (60 s) ablations, and even for very short distances between AW and CS (0.5 mm). This heat-sink effect may imply that the lesion contour encircles the vessel without touching it, which is especially noticeable at long times (see and ). This result is in agreement with the experimental findings that found the cardiac tissue around a coronary artery was not thermally injured after RF ablation [Citation2].
Overall, our results suggest that the presence of the CS does not impede transmural lesions (even for very small AW–CS distances), which is in agreement with the clinical results that reported that CS occlusion does not improve the overall success rate of the isthmus block [Citation34,Citation35]. In this respect, our results show that the lesion width at the epicardial level is reduced by the CS’s heat-sink effect, and that this reduction is more marked at very small AW–CS distances (0.5 mm), reaching a value of ∼1.5 mm for short ablations () and up to 8 mm for long ablations (). This behavior was also confirmed for other catheter positions (). Our results also suggest that this effect could become more marked in short ablations ( and ), with more conical lesion shapes than long ablations ( and ).
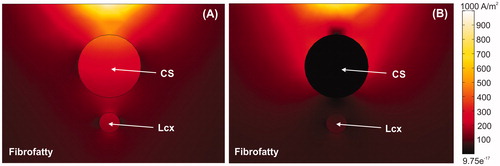
Regarding the effect of CS occlusion on the lesion across the AW, our results show interesting differences between proximal and distal occlusions. It seems that the presence of air (proximal occlusion) instead of blood (distal occlusion) at rest in the vicinity of the ablation electrode substantially modifies electrical current distribution, which can be confirmed by comparing the lesion contours (dashed and solid black lines for proximal and distal occlusion, respectively, in and ) at 15 s, since at the start of heating the lesion is mainly created by electrical energy deposition rather than thermal conduction. Our main hypothesis to explain this phenomenon is that in short durations (15 s or less) the lesion is mostly created by the power absorbed by the tissue (SAR, Specific Absorption Rate, W/m3), which depends on current density and tissue conductivity (σ) at each point (SAR = J2·σ). In other words, the thermal conduction mechanism only plays a minor role in the first few seconds. For this reason, SAR will be more or less similar for circulating blood (no occlusion) and for distal occlusion (distal occlusion), potentially explaining the similarity between the distal occlusion and no-occlusion lesions. Using the same reasoning, the proximal occlusion (in which a significant volume is occupied by an air-pocket, with a drastically lower σ value) induced much lower SAR values and hence smaller lesions. This can also be seen in , where the electrical current density is plotted. The current density is lower between AW and CS when the air-filled balloon is present (see ), which suggests that electrical currents are diverted around the balloon, thus preventing lesion growth in both depth and width. This seems to be true for short durations (15 s), as shown in , where lesion size in the presence of a balloon (proximal occlusion) is always smaller than other cases. Surprisingly, the behavior seems to be the opposite as time progresses, as shown in and , when lesion size in the presence of a balloon (proximal occlusion) is always bigger than other cases. This suggests that the presence of air also substantially modifies thermal conduction, which becomes more relevant than electrical conduction in long durations. The explanation could lie in the different thermal inertia () of air and blood. In the case of proximal occlusion, the inertia of air being much lower than that of blood (270 times smaller) would imply a shorter time for the material to reach equilibrium, i.e., higher temperatures at 60 s, and hence larger lesions.
Figure 6. Current density around CS for cases without balloon (A) and with air balloon (B). Note that electrical current is drastically distorted by the presence of the balloon. The current goes through the CS in the case without a balloon, whereas it surrounds the CS when an air-filled balloon is placed inside it.
An interesting aspect of our results is the fact that for long ablations the CS itself can be thermally affected under occlusion. Although this may be considered as undesirable, the truth is that the existence of electrical connections between the AW and CS suggests that the thermal ablation must sometimes reach the CS itself in order to eliminate these connections [Citation36,Citation37]. Our computer results suggest that the combination of long ablation and occlusion (both distal and proximal) would facilitate mitral isthmus ablation.
We obtained similar lesion sizes for different catheter positions, as opposed to the numerical study carried out by Panescu et al. [Citation38], in which the 45° lesions were bigger. However, this cannot be compared with the present study, since they modeled a constant temperature ablation (with higher applied power in the 45° case) while we modeled the usual clinical constant-power ablative mode used with an irrigated-electrode.
Our results suggested that the blood flow rate has no impact on modeled lesion size. As can be seen in , lesion depth and width at epicardium level were not affected at any ablation time when the blood flow rate was increased from 8.5 to 25 cm/s. All this seems to be in agreement with experimental data that show that blood flow does not have an impact on lesion size with irrigated electrodes [Citation25].
Figure 7. Temperature distributions (scale in °C) with the electrode in perpendicular position for the case of 3.4 mm atrial wall, 1 mm of AW-CS and without occlusion of CS at 15 s (A) and 60 s (B). The cardiac chamber blood flow velocity was increased from 8.5 cm/s (solid black line) to 25 cm/s (solid white line).
This modeling study is the first step in providing a method of helping electrophysiologists to predict lesion size in response to occlusion and how they could use this information to plan a procedure under a more or less simplified scenario. Future modeling studies will include personalized MRI patient geometries in order to optimize the procedure for individual patients.
Limitations
The main limitation of this study was the lack of experimental validation, which implies that there may be unknown temperature errors. The results were presented and discussed in terms of thermal lesion size, specifically, width and depth at the epicardial level. This approach allows an indirect comparison of the impact of vascular flow and its possible cessation by occlusion on the transmurality of the lesion across the AW, and hence on the clinical outcome of the ablation procedure. Note that the presence or absence of transmurality observed in the computer results also depends on many other factors which have been not assessed in this study, such as applied power, the tissue’s electrical characteristics, and the insertion depth of the electrode in the tissue. However, the present conclusions should remain valid were these factors to be changed.
The power value used in the simulations (10 W) is much lower than that used in actual clinical practice (25–30 W). This ‘adjustment’ has been used by some other computer models [Citation18,Citation38] and ex vivo setups [Citation39] (which employ power levels between 5 and 15 W). The reason for this is that computer models only include a fragment of the thorax, and thus ignore part of the electrical circuit, in which the programed power is actually absorbed, so that less power must be used in these limited-domain models than in clinical practice. To overcome this limitation, we opted for using the same constant power protocol in all the cases involved.
Conclusions
Our findings suggest that using an air-filled balloon to occlude the coronary sinus facilitates mitral isthmus ablation in long ablations (60 s). In contrast, proximal occlusion could impede transmural lesions in the case of short ablations (15 s). These conclusions could be equally valid for other vascularized tissues subjected to RF ablation in which an occlusion balloon could be applied.
Disclosure statement
The authors have no conflicts of interest or financial disclosures to make relevant to this submission.
Additional information
Funding
References
- Cabrera JA, Pizarro G, Sánchez-Quintana D. Muscular architecture of the mitral isthmus: anatomical determinants for catheter ablation. Europace. 2012;14(8):1069–1071.
- Fuller IA, Wood MA. Intramural coronary vasculature prevents transmural radiofrequency lesion formation: implications for linear ablation. Circulation. 2003;107(13):1797–1803.
- D'Avila A, Thiagalingam A, Foley L, et al. Temporary occlusion of the great cardiac vein and coronary sinus to facilitate radiofrequency catheter ablation of the mitral isthmus. J Cardiovasc Electrophysiol. 2008;19(6):645–650.
- Sánchez-Quintana D, López-Mínguez JR, Macías Y, et al. Left atrial anatomy relevant to catheter ablation. Cardiol Res Pract. 2014;2014:1.
- González-Suárez A, Berjano E, Guerra JM, et al. Computational modeling of open-irrigated electrodes for radiofrequency cardiac ablation including blood motion-saline flow interaction. PLoS One. 2016;11(3):e0150356.
- González-Suárez A, Pérez JJ, Berjano E. Should fluid dynamics be included in computer models of RF cardiac ablation by irrigated-tip electrodes? Biomed Eng Online. 2018;17(1):43.
- Bin Choy Y, Cao H, Tungjitkusolmun S, et al. Mechanical compliance of the endocardium. J Biomech. 2002;35(12):1671–1676.
- Yokokawa M, Sundaram B, Garg A, et al. Impact of mitral isthmus anatomy on the likelihood of achieving linear block in patients undergoing catheter ablation of persistent atrial fibrillation. Heart Rhythm. 2011;8(9):1404–1410.
- Watzinger N, Lund GK, Saeed M, et al. Myocardial blood flow in patients with dilated cardiomyopathy: quantitative assessment with velocity-encoded cine magnetic resonance imaging of the coronary sinus. J Magn Reson Imaging. 2005;21(4):347–353.
- Haines DE. Letter by Haines regarding article, “Direct measurement of the lethal isotherm for radiofrequency ablation of myocardial tissue. Circ Arrhythm Electrophysiol. 2011;4(5):e67.
- Nath S, Lynch C, 3rd, Whayne JG, et al. Cellular electrophysiological effects of hyperthermia on isolated guinea pig papillary muscle. Implications for catheter ablation. Circulation. 1993;88(4):1826–1831.
- González-Suárez A, Berjano E. Comparative analysis of different methods of modeling the thermal effect of circulating blood flow during RF cardiac ablation. IEEE Trans Biomed Eng. 2016;63(2):250–259.
- Jain MK, Wolf PD. A three-dimensional finite element model of radiofrequency ablation with blood flow and its experimental validation. Ann Biomed Eng. 2000;28(9):1075–1084.
- Abraham JP, Sparrow EM. A thermal-ablation bioheat model including liquid-to-vapor phase change, pressure- and necrosis-dependent perfusion, and moisture-dependent properties. Int J Heat Mass Tran. 2007;50(13-14):2537–2544.
- Pérez JJ, González-Suárez A, Berjano E. Numerical analysis of thermal impact of intramyocardial capillary blood flow during radiofrequency cardiac ablation. Int J Hyperth. 2018;34(3):243–249.
- Labonté S. Numerical model for radio-frequency ablation of the endocardium and its experimental validation. IEEE Trans Biomed Eng. 1994;41(2):108–115.
- Pätz T, Kröger T, Preusser T. Simulation of radiofrequency ablation including water evaporation. IFMBE Proc. 2009;25:287–290.
- Schutt D, Berjano EJ, Haemmerich D. Effect of electrode thermal conductivity in cardiac radiofrequency catheter ablation: a computational modeling study. Int J Hyperthermia. 2009;25(2):99–107.
- Doss JD. Calculation of electric fields in conductive media. Med Phys. 1982;9(4):566–573.
- Hasgall PA, Di Gennaro F, Baumgartner C, et al. IT’IS Database for thermal and electromagnetic parameters of biological tissues, Version 3.0. [2015 Sep 01], Available from: www.itis.ethz.ch/database.
- Haemmerich D, Chachati L, Wright AS, et al. Hepatic radiofrequency ablation with internally cooled probes: effect of coolant temperature on lesion size. IEEE Trans Biomed Eng. 2003;50(4):493–499.
- Berjano EJ. Theoretical modeling for radiofrequency ablation: state-of-the-art and challenges for the future. Biomed Eng Online. 2006;5(1):24.
- Tungjitkusolmun S, Woo EJ, Cao H, et al. Thermal–electrical finite element modelling for radio frequency cardiac ablation: effects of changes in myocardial properties. Med Biol Eng Comput. 2000;38(5):562–568.
- Shahidi AV, Savard P. A finite element model for radiofrequency ablation of the myocardium. IEEE Trans Biomed Eng. 1994;41(10):963–968.
- Guerra JM, Jorge E, Raga S, et al. Effects of open-irrigated radiofrequency ablation catheter design on lesion formation and complications: in vitro comparison of 6 different devices. J Cardiovasc Electrophysiol. 2013;24(10):1157–1162.
- Moreno J, Quintanilla JG, Molina-Morúa R, et al. Morphological and thermodynamic comparison of the lesions created by 4 open-irrigated catheters in 2 experimental models. J Cardiovasc Electrophysiol. 2014;25(12):1391–1399.
- Anjaneyulu A, Raghu K, Chandramukhi S, et al. Evaluation of left main coronary artery stenosis by transthoracic echocardiography. J Am Soc Echocardiogr. 2008;21(7):855–860.
- Liu Y, Shehata M, Wang X. Alternative approach for ablation of the mitral isthmus. Circ Arrhythm Electrophysiol. 2017;10(10):e005814.
- Takahashi Y, Jais P, Hocini M, et al. Acute occlusion of the left circumflex coronary artery during mitral isthmus linear ablation. J Cardiovasc Electrophysiol. 2005;16(10):1104–1107.
- Pappone C, Oral H, Santinelli V, et al. Atrio-esophageal fistula as a complication of percutaneous transcatheter ablation of atrial fibrillation. Circulation. 2004;109(22):2724–2726.
- Lee JH, Nam GB, Go TH, et al. Alternative strategies to improve success rate of mitral isthmus block. Medicine (Baltimore). 2018;97(48):e13060.
- Badertscher P, Wissner E. Case report: cryoballoon ablation of the mitral isthmus using a novel mapping system. Pacing Clin Electrophysiol. 2019;42(10):1414.
- Kawaguchi N, Okishige K, Yamauchi Y, et al. Clinical impact of ethanol infusion into the vein of Marshall on the mitral isthmus area evaluated by atrial electrograms recorded inside the coronary sinus. Heart Rhythm. 2019;16(7):1030–1038.
- Wong KC, Jones M, Qureshi N, et al. Balloon occlusion of the distal coronary sinus facilitates mitral isthmus ablation. Heart Rhythm. 2011;8(6):833–839.
- Hocini M, Shah AJ, Nault I, et al. Mitral isthmus ablation with and without temporary spot occlusion of the coronary sinus: a randomized clinical comparison of acute outcomes. J Cardiovasc Electrophysiol. 2012;23(5):489–496.
- Chauvin M, Shah DC, HaïSsaguerre M, et al. The anatomic basis of connections between the coronary sinus musculature and the left atrium in humans. Circulation. 2000;101(6):647–652.
- Ferrer-Albero A, Godoy EJ, Sebastian R, et al. Analysis of in-silico body Surface P-wave integral maps show important differences depending on the connections between coronary sinus and left atrium. Comput Cardiol. 2016;43:745–748.
- Panescu D, Whayne JG, Fleischman SD, et al. Three-dimensional finite element analysis of current density and temperature distributions during radio-frequency ablation. IEEE Trans Biomed Eng. 1995;42(9):879–890.
- Wright M, Harks E, Deladi S, et al. Visualizing intramyocardial steam formation with a radiofrequency ablation catheter incorporating near-field ultrasound. J Cardiovasc Electrophysiol. 2013;24(12):1403–1409.