
Abstract
Objectives: To compare image quality between filtered back projection (FBP) and iterative reconstruction algorithm and dedicated metal artifact reduction (iMAR) algorithms during antenna positioning for computed tomography-guided microwave ablation (MWA).
Materials and methods: An MWA antenna was positioned in the liver of five pigs under CT guidance. Different exposure settings (120kVp/200mAs-120kVp/50mAs) and image reconstruction techniques (FBP, iterative reconstruction with and without iMAR) were applied. Quantitative image analysis included density measurements in six positions (e.g., liver in extension of the antenna [ANTENNA] and liver >3 cm away from the antenna [LIVER-1]). Qualitative image analysis included assessment of overall quality, image noise, artifacts at the antenna tip, artifacts in liver parenchyma bordering antenna tip and newly generated artifacts. Two independent observers performed the analyses twice and interreader agreement was compared with Bland–Altman analysis.
Results: For all exposure and reconstruction settings, density measurements for ANTENNA were significantly higher for the I30-1 iMAR compared with FBP and I30-1 (e.g., 8.3−17.2HU vs. −104.5 to 155.1HU; p ≤ 0.01, respectively). In contrast, for all exposure settings, density measurements for LIVER-1 were comparable between FBP and I30-1 iMAR (e.g., 49.4−50.4HU vs. 50.1−52.5U, respectively). For all exposure and reconstruction settings, subjective image quality for LIVER-1 was better for the I30-1 iMAR algorithm compared with FBP and I30-1. Bland–Altman interobserver agreement was from −0.2 to 0.2 for FBP and iMAR, and Cohen’s kappa was 0.74.
Conclusion: Iterative algorithms I30-1 with iMAR algorithm improves image quality during antenna positioning and placement for CT-guided MWA and is applicable over a range of exposure settings.
Introduction
Image-guided percutaneous microwave ablation (MWA) is an established, minimally invasive treatment for liver malignancies [Citation1–3]. The delivery of spatially confined oscillating electromagnetic fields leads to heating of the target volume and consecutively to irreversible coagulation necrosis [Citation4]. According to different publications, a success rate of up to 95% can be obtained for MWA of hepatocellular carcinoma and metastases ≤3 cm [Citation5–8]. In best-case scenarios, the tumor and intended safety margin lie within a homogeneous coagulation zone with no skip areas [Citation9]. Therefore, the precise positioning of the antenna tip is of utmost importance after a specific prospective treatment protocol has been defined [Citation10]. Currently, computed tomography (CT) guidance is widely accepted and commonly used to position the MWA antenna into the target region; especially in case of overlapping ablation, an exact positioning is mandatory. Non-contrast CT is usually performed during the antenna placement, as Stattaus et al. showed that the visualization improves for a short period after contrast agent injecion, but deteriorates in the late phase [Citation11].
Regarding thermal ablation, different approaches have been published for the accurate positioning of the antenna tip to obtain clear margins. The Chebyshev Center Concept is a mathematical model implemented in an image-based visualization tool to assess size and position of the maximum treatable tumor size at a specific safety margin [Citation12]. Following the theoretical concept of Sommer et al., the parallel offset is a measure that defines the optimal distance between the antenna tip and the tumor margin at a specific eccentric antenna tract [Citation10]. Only if the parallel offset is realized, the coagulation volume can be positioned so that the intended safety margin is obtained homogeneously in all dimensions, while the maximum coagulation extent is minimized simultaneously [Citation10]. The relevance of the adequate antenna position and for overlapping coagulation zones has been demonstrated in clinical settings. Wang et al. showed that a homogeneous safety margin >5 mm is associated with best local tumor control after CT-guided radiofrequency ablation (RFA) of colorectal cancer liver metastases, and Shady et al. suggest safety margin ≥6 mm as crucial for patients with KRAS mutation [Citation13,Citation14].
Unfortunately, the limitations of CT-guided needle and antenna positioning are metal artifacts that can potentially impair image quality so that discerning the precise definition of the tip in relation to the target volume is challenging. In a clinical study of CT-guided biopsy of liver lesions, for example, the rate of insufficiently visualized lesions increased from 10.5 to 44.7% because of needle artifacts with a consequently high rate of false-negative biopsy results compared to lesions with a good visibility [Citation11]. Unfortunately, those authors did not discuss ways to avoid or at least reduce these metal artifacts. In a phantom model, McWilliams et al. investigated factors that influence occurrence and severity of metal artifacts during CT-guided needle biopsy [Citation15]. In their study, needle configuration (central stylet removed versus in situ) and needle thickness (19 G versus 17 G) were the positive predictors for reducing metal artifacts and improving visualization of the needle tip. In contrast, regarding the image reconstruction technique (adaptive statistical iterative reconstruction versus filtered back projection), there were no predictors for improved image quality.
Currently, new image post-processing algorithms are available that should allow minimization of metal artifacts and therefore maximization of visualization of the target volume. Evidence that these algorithms work in clinical settings has been demonstrated for different metal implants such as spine hardware, total hip replacement and dental prostheses [Citation16–18]. With respect to CT-guided MWA, however, no published data describe the positive and negative effects of metal artifact reduction software on image quality. In the present study, the value of iterative metal artifact reduction (iMAR), which iteratively combines the algorithms Normalized Metal Artifact Reduction (NMAR) and Frequency Split Metal Artifact Reduction (FSMAR) [Citation19,Citation20]. NMAR replaces those parts of the sinogram that are missing because of metal artifacts with the help of normalized interpolation. First, the metal is removed from the original image by multi-threshold metal segmentation. Second, linear interpolation is performed on the relatively normalized sinogram at locations indicated by the projections of the segmented metal trace. NMAR images are obtained by reconstruction of the corrected sinogram and reinsertion of the metal pixel values from the uncorrected images [Citation19]. FSMAR uses two sources: the image data created by NMAR and the original image data. With the help of the Gaussian filtration, high- and low-pass filtered versions of corrected and original images are generated. The final images are produced by a weighted combination of the high-pass filtered images of the uncorrected and corrected data and the low-pass filtered corrected images [Citation20]. Because image noise is contained in the high frequencies, it is expected that the image noise with iMAR is very similar to the image noise of the uncorrected image. These filtering and mixing steps are performed repeatedly and thus reduce the blurring of the anatomic structures near the metal object [Citation20]. As a result, metal artifacts should be markedly reduced, and images should provide better diagnostic quality.
iMAR application during antenna positioning for CT-guided MWA was analyzed in an in vivo pig liver model using different exposure settings and different slice thicknesses. We hypothesized that iMAR would reduce metal artifacts deriving from the MWA antenna and therefore improve image quality.
Materials and methods
The study was performed according to rules outlined by the local and governmental animal care committee instituted by the German government. The ethics committee approved this study as a part of other trials.
Animal preparation
Five German Landrace pigs with a body weight of 38–43 kg served as study animals. General anesthesia was induced by azaperone (6 mg/kg; Stresnil®, Janssen Animal Health, Beerse, Belgium), ketamine (8–10 mg/kg; Ketanest-S®, Medistar, Hannover, Germany) and midazolam (0.4 mg/kg; Dormicum®, Roche, Basel, Switzerland). Intubation with an oropharyngeal tube was performed to allow respiration control. A central venous catheter was placed into the jugular vein to apply intravenous medication. During the procedure, anesthesia was maintained by isoflurane (Isofluran CP®, CP-Pharma, Burgdorf, Germany) and mechanical ventilation (Servo-Ventilator 900c®, Siemens-Elema, Munich, Germany). Vecuronium (Vecuronium Inresa®, Inresa Arzneimittel GmbH, Freiburg, Germany) was applied intravenously to assure sufficient muscle relaxation for optimal respiration control. During mechanical ventilation-induced end-expiratory breath hold, a commercially available MWA antenna (EmprintTM MWA System Antenna, Medtronic Covidien, Mansfield, MA, USA) was positioned into the right liver lobe from a right lateral access under CT guidance. The antenna features an internally cooled needle with a straight needle design. The 13-gauge shaft consists of a single body fiberglass construction with a length of 15 cm and a fixed trocar tip at the distal end of the antenna, which is radiopaque and classified as a marker in this study [Citation21,Citation22]. The positioning of the antenna into the liver was performed in a standardized fashion with a coplanar course to the axial plane and with the antenna tip at a depth of ≥5 cm as measured from the body surface. The optimal antenna position was verified by a final CT scan.
CT protocol
All CT scans were performed without contrast media in the head-first supine position using a dual-source 64-MDCT scanner (Somatom® Definition Flash, Siemens Healthineers, Forchheim, Germany). In each animal, seven CT scans with different exposure settings were obtained during mechanical ventilation-induced end-expiratory breath hold. Respiratory control was crucial to scan all dose settings in one end-expiratory breath hold position to improve comparability between the acquisition settings. In a clinical setting, only one scan would be necessary to confirm the antenna’s position. Moreover, mechanical respiration would allow effective thermal ablation for reducing thorax movements. While the fixed tube potential was set to 120 kVp in all scans, the fixed tube current had different settings: 200 mA, 175 mA, 150 mA, 125 mA, 100 mA, 75 mA or 50 mA. The tube potential was chosen from our standard abdomen imaging protocol. Other parameters such as pitch of 0.6, collimation of 64 × 0.6 mm, gantry rotation time of 0.5 s and scan length of 5 cm were identical. The different CT scans resulted in a CTDIvol of 13.40 mGy, 11.77 mGy, 10.08 mGy, 8.39 mGy, 6.70 mGy, 5.01 mGy and 3.32 mGy, respectively. From the raw data, images were reconstructed with two reconstruction techniques: Filtered back projection (FBP), with a soft tissue B30f kernel (Siemens Healthineers, Erlangen, Germany); iMAR, with a level of 1 out of 3, applied based on anatomical location and meal implants device (Siemens Healthineers, Erlangen, Germany). Additionally, an iterative reconstruction method was combined with iMAR Advanced Modeled Iterative Reconstruction, at the level of 1 out of 5, (ADMIRE-1-I301; Siemens Healthineers, Erlangen, Germany).
Images were reconstructed with a slice thickness of 2 mm and 1 mm increment. A thin slice thickness of 2 mm ensured the delineation of small lesions. All images were reconstructed as multi-planar images in axial orientation and with identical field of view.
Image analysis
Two independent observers with 5 and 12 years of experience in diagnostic and interventional radiology performed the analyses. For quantitative image analyses, each observer performed two reads at an interval of 4–6 weeks between both reads (Read 1 and Read 2).
Quantitative image analysis
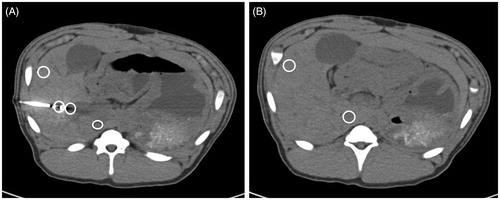
Quantitative analysis to define objective image quality was performed on a multi-modality workstation (Syngo.via, VAS48A, Siemens Healthineers, Erlangen, Germany) using standardized region of interest (ROI) measurements in different positions. In the axial slice showing the antenna, ROIs were positioned on the marker at the distal end of the antenna, on liver parenchyma directly bordering the antenna tip and on liver >3 cm away from the antenna (ventral right liver lobe) and in the inferior vena cava (. This analysis served for quantification of artifacts (because the maximum number of artifacts was identified at the marker at the distal end of the antenna and in liver in extension of the antenna). In a second slice without the antenna and with no visible artifacts, ROIs were positioned on liver (ventral right liver lobe) and on the inferior vena cava (. This analysis served for the calculation of image noise and signal-to-noise ratio (SNR), whereby the inferior vena cava served as a correlate for a hypodense liver lesion. All ROIs showed the same size (diameter: 1.10–1.15 mm; area: 0.95–1.05 mm2) and were placed manually into the first dataset (120 kVp/200 mA, 2/1 mm slices, FBP) of each animal. For the other 13 datasets (2/1 mm slices) per animal, these ROIs were copied by using a Syngo.via software tool. Accordingly, the different ROIs were exactly in the same position as previously described [Citation23]. The procedure was repeated for 8/8 mm slices. From the ROI, density measurements (means and standard deviations [SDs]) were obtained in Hounsfield units (HUs). Image noise was defined as the SD of the ROI measurement on liver, and SNR was defined as the mean of the ROI measurement on liver/SD of the ROI measurement on inferior vena cava according to established practice [Citation24].
Figure 1. Different standardized ROIs used to describe quantitative image quality. Axial slice showing the applicator and different region of interests (white circles): 1, on the marker at the distal end of the applicator; 2, on liver in extension of the applicator; 3, on liver >3 cm away from the applicator within the right liver lobe; 4, on the inferior vena cava (A); in a second slice without the applicator and without any visible artifacts, further ROIs were positioned: in the liver parenchyma and inferior vena cava (B).
Qualitative image analysis
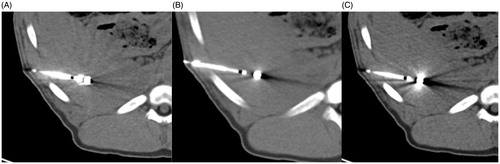
Qualitative analysis to define subjective image quality was performed by applying a standard diagnostic workstation (Picture Archive and Communication System Centricity, GE, Boston, MA, USA). All series were pre-adjusted to a standard abdomen setting (window center of 40 HU and window width of 400 HU). All datasets were blinded for image reconstruction technique and exposure settings and randomized. Observers could freely scroll through the entire datasets and adjust window center and width to obtain an optimal image impression. Different types of artifacts were evaluated on the axial slice showing the antenna. Artifacts at the distal end of the antenna were rated on a 4-point Likert scale (1, none; 2, mild: ≤100% artificial enlargement of the antenna tip thickness but preservation of the cylindrical shape of the antenna tip; 3, moderate: >100% artificial enlargement of the antenna tip thickness but preservation of the cylindrical shape of the antenna tip; and 4, severe: complete loss of the cylindrical shape of the antenna tip). Artifacts in liver in extension of the antenna <2 cm distance were rated on a 4-point Likert scale (1, none; 2, mild: artifacts leading to mild loss of visibility of liver in extension of the antenna; 3, moderate: artifacts leading to moderate loss of visibility of liver in extension of the antenna; and 4, severe: artifacts leading to complete loss of visibility of liver in extension of the antenna) ()). New artifacts generated by iMAR were rated on a 4-point Likert scale, depending on the location and extent (1, none; 2, mild: either around the antenna tip or at the image periphery; 3, moderate: around the antenna tip and at the image periphery; and 4, severe: distinct artifacts within the pig with constraint of diagnostic quality). Furthermore, image noise was rated on a 4-point Likert scale (1, discrete; 2, mild; 3, moderate; 4, severe). Finally, overall image quality was rated on a 5-point Likert scale taking into account visual conspicuity of the aorta, inferior vena cava, portal vein and gallbladder (1, excellent; 2, good; 3, fair; 4, poor; and 5, not interpretable). The different Likert scales were defined with consideration of previous publications and with slight modifications if indicated [Citation25–27].
Figure 2. Degree of artifacts in liver in extension of the applicator as a parameter to describe qualitative image quality. Likert score 2, mild: artifacts leading to mild loss of visibility of liver tissue in extension of the applicator (A); Likert score 3, moderate: artifacts leading to moderate loss of visibility of liver tissue in extension of the applicator (B); Likert score 4, severe: artifacts leading to complete loss of visibility of liver tissue in extension of the applicator (C).
Qualitative evaluations were tabulated similarly to quantitative data with separate sheets for slice thickness, with animals arranged in rows and grouped according to observer and reads, and columns grouped by non-iMAR and iMAR and subgrouped according to dose settings and once again subgrouped by quality criteria.
Statistical analysis
Statistical analysis was performed using the commercially available SPSS software package (SPSS Inc, Chicago, IL, USA). For quantitative image analysis, the normality of data distribution was assessed by using the Shapiro–Wilk test. Data for CT numbers, image noise and SNR were analyzed (I) for FBP B30, I30-1 and I30-1 with iMAR to define differences between the different exposure settings (one-way ANOVA in case of normal data distribution or the Kruskal–Wallis test in case of non-normal distribution of data), as well as (II) for each exposure setting to define differences between FBP and ADMIRE by comparing FBP B30 and I30-1 on the one hand and dedicated iterative metal artifact reduction algorithm by comparing I30-1 and I30-1 with iMAR on the other and (paired t-tests with normal data distribution and the Wilcoxon matched-pairs signed-rank test in case of a non-normal distribution). For qualitative image analysis, the same comparisons were made by applying Likert scores (the Friedman test or the Wilcoxon test). Statistical significance was considered at p < 0.05. For quantitative and qualitative image analysis, interobserver agreement was calculated by applying Bland–Altman analysis. All data of quantitative analysis were compared with Bland–Altman analysis for interobserver agreement [Citation28]. For the interobserver agreement of qualitative analysis, Cohen’s kappa and Landis and Koch classification were used [Citation29,Citation30].
Results
Quantitative image analysis
Density measurements
Results are shown in and . For liver in extension of the antenna, there were significant HU value differences between I30-1 and I30-1 with iMAR for all exposure settings, with significantly higher numbers for iMAR (8.3–17.2 HU) when compared with I30-1 (from −92.9 to −140.2 HU; p < 0.01). No difference in CT numbers was observed between FBP B30 and I30-1 For the marker at the distal end of the antenna, there was a singular significant HU value difference between FBP B30, I30-1 and I30-1 iMAR with higher numbers for I30-1 iMAR at exposure setting of 120 kVp/150 mAs. For liver >3 cm away from the antenna, there were no significant differences between FBP and I30-1 on the one hand and I30-1 and I30-1 iMAR on the other hand (p ≥ 0.05) with a maximum difference in CT numbers of 3.8 HU for all exposure settings.
Figure 3. CT numbers for liver in extension of the antenna for different mAs. 120 kVp was used for all scans. CT numbers for FBP B30 and I30-1 were significantly lower in comparison to I30-1 with iMAR with less streak artifacts at the tip of the antenna and thus higher CT numbers. No significant differences were seen between FBP B30 and its corresponding iterative reconstruction I30-1.
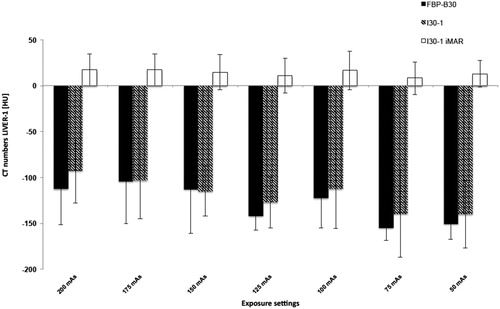
Table 1. Density measurements for 2/1 mm slices (considering the axial slice showing the antenna).
Image noise
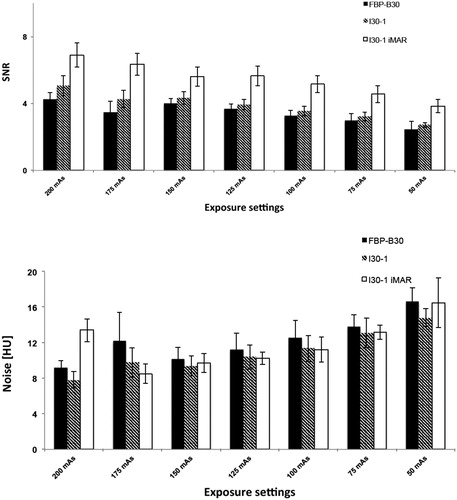
For image noise, there were significant differences between FBP B30 and I30-1 at exposure settings of 120 kVp/200 mAs, 120 kVp/150 mAs, 120 kVp/125 mAs, 120 kVp/100 mAs and 120 kVp/75 mAs with lower image noise for I30-1 (p between 0.003 and 0.04). I30-1 with iMAR had only significant difference in noise at 120 kVp/200 mAs (p = 0.01) and 120 kVp/150 mAs (p = 0.03). In general, high exposure settings had lower noise than lower exposure settings, i.e., CTDIvol 13.40 mGy: noise between 7.8 and 13.43 HU compared to CTDIvol 3.32 mGy: noise between 14.8 and 16.65 HU ().
Table 2. SNR and noise.
SNR
For SNR, significant higher SNR was observed for I30-1 iMAR at exposure setting of 120 kVp/50 mAs (p = 0.001), otherwise there were no significant differences between I30-1 (SNR: 3.22–5.06) and I30-1 iMAR (SNR: 4.56–6.88) (. For several exposure settings, SNR of I30-1 was higher than FBP B30 (p between <0.0001 and 0.02); SNR was significantly different for the different exposure settings, with significantly higher SNR for higher CTDIvol in comparison to lower CTDIvol irrespective of reconstruction technique (p < 0.01, respectively) ().
Figure 4. SNR (A) for different dose settings. 120 kVp was used for all scans. SNR was superior for I30-1 and I30-1 iMAR compared to FBP. SNR was best for iMAR images. SNR increased with applied dose with statistical significance. Noise (B) decreased significantly with increasing radiation dose. No general significant differences were observed between FBP B30, I30-1 and I30-1 iMAR.
Qualitative image analysis
Regarding artifacts at the distal end of the antenna, there were no significant differences between FBP (Mean Likert score: 2.5–2.6) and I30-1 (Mean Likert score: 2.4–2.6) nor between I30-1 and I30-1 iMAR (Mean Likert score: 1.8–1.9) for all exposure settings (p between 0.08–0.37) (.
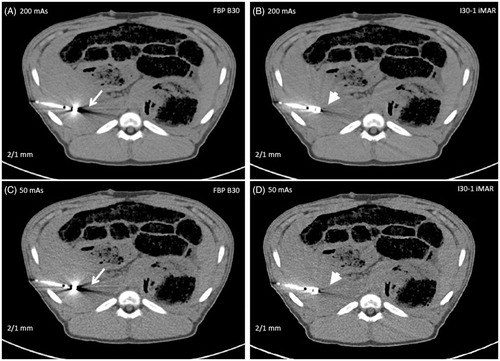
Figure 5. Representative image examples 2/1 mm slices at 200 mAs (A,B) and 50 mAs (C,D), each with FBP B30 (A,C) and I30-1 iMAR (B,D). Less streak artifacts especially in the liver parenchyma bordering to the antenna was observed for iMAR (arrow head) in comparison to FBP B30 (white arrow). More noise is noticed on images with 50 mAs (B).
With artifacts in liver in extension of the antenna, there was no significance between FBP (Mean Likert Score: 3.9–4.0) and I30-1 (Mean Likert score: 3.8–4.0) with p values of 0.37 but significant less artifacts for I30-1 iMAR in comparison to I30-1 (Mean Likert score: 1.3–1.9) with p < 0.01 for all exposure settings (.
New artifacts generated by iMAR
For all exposure settings, iMAR went along with the generation of new artifacts such as irregularities along the antenna edge as blooming artifacts (. Newly generated artifacts were noted at the periphery with radiating dark and white stripes, similar to splay artifacts (. These new artifacts never occurred at the antenna tip or in liver in extension of the antenna in the puncture direction, but they occurred in the periphery of the liver or abdomen. Mean Likert scores ranged for 2/1 mm slices between 1.9 and 2.2, with significant differences between the different exposure settings (p = 0.011) and for 8/8 mm slices between 1.0 and 1.2. In contrast to 2/1 mm slices, there were no significant differences between the different exposure settings for 8/8 mm slices (p = 0.423).
Figure 6. Image examples for new artifacts generated by iMAR: (A) Blooming artifacts especially around at the antenna (white arrows) and dark streaks at the image periphery (black arrows) generated by iMAR (B).
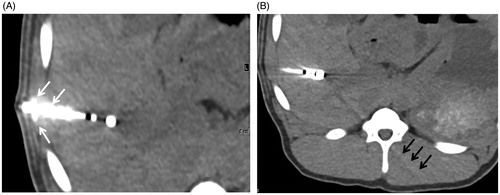
Image noise
There were qualitatively significant less noise between FBP and I301 for lower dose settings 50–125 mAs (p between 0.005 and 0.033). There were no significant differences in noise between I30-1 and I30-1 iMAR at any exposure setting (p between 0.24 and 0.62).
Overall image quality
Overall image quality was rated significant better for I30-1 in comparison to FBP and for I30-1 iMAR in comparison with I30-1 at low dose settings for 120 kVp and 50–75 mAs (p values between 0.004 and 0.033).
Interobserver agreement
The interobserver agreement in the Bland–Altman analysis for the above-listed five parameters was high. For FBP, it ranged from −0.2 to 0.2, and for iMAR, it ranged between −0.2 and 0.2. The Cohen’s kappa for qualitative analysis was substantial with 0.74.
Discussion
The results of this study showed that is no difference in metal artifacts between FBP and I30-1. However I30-1 with iMAR in comparison to I30-1 alone significantly reduced artifacts from microwave antennas, independent of the radiation dose used for CT-imaging. As expected, image noise decreased and SNR increased with higher fixed tube current. As a drawback of iMAR, the occurrence of new artifacts must be considered. Different studies have addressed this phenomenon, and the final conclusions were quite consistent: because the advantages of iMAR outweigh its disadvantages resulting in better visualization of anatomy and better conspicuity of anatomical abnormalities, the algorithm is ready for implementation in the clinical workflow [Citation5,Citation17,Citation18,Citation31]. It is worth noting that in this study, the new artifacts were not observed at the antenna tip or in the liver in extension of the antenna in the puncture direction, in other words, in the region of greatest interest.
In the current literature, data are lacking on the value of iMAR during antenna positioning for CT-guided MWA. To the best of our knowledge, there are no instances in the literature regarding artifact reduction for other CT-guided thermal ablation procedures such as RFA or cryoablation (CRYO). Two studies have addressed the optimal CT technique for different and commonly used tumor ablation applicators [Citation32,Citation33]. In the first study, 11 different MWA, RFA and CRYO applicators were positioned in bovine livers, followed by CT scans with fixed tube current (440 mAs) but different tube potentials (80–140 kVp), different scan times (0.5–2.0 s), different pitch factors (0.5–1.75) and different acquisition types (spiral or incremental) [Citation32]. Images were reconstructed with one-slice thickness (5 mm) but different adaptive statistical iterative reconstruction techniques (levels of 30, 60 and 90) and different algorithms (soft, standard and lung). Although higher tube potentials and longer scan times reduced applicator artifacts in general, it is noteworthy that there were different specific parameter combinations for optimal artifact reduction for each of the 11 applicators (e.g., tube potential, scan time, pitch factor and acquisition type of 120 kVp, 2 s, 0.5 and incremental for a Boston Scientific (Boston Scientific, Marlborough, Massachussetts, USA) applicator, respectively [with tines deployed] versus 140 kVp, 0.5 s, 0.94 and spiral for a NeuWave Medical Precision (Johnson & Johnson, New Brunswick, New Jersey, USA) [17 G] applicator, respectively).
In the second study, the results of the first study could be confirmed with the overall interaction of the different acquisition and image reconstruction parameters [Citation33]. In both studies, the rationale for choosing the provided CT parameters was operator experience with the intention to optimize image quality and reduce metal artifacts. What remains unclear, however, is why the CT scans were performed with such a high radiation exposure (as can be estimated from the provided tube potential and tube current). Because the nationwide reference values for diagnostic abdominal CT scans define the maximum CTDIvol at 15 mGy for each CT series, we adapted exposure settings so that the CT scan with the highest radiation exposure met this upper threshold [Citation34]. Furthermore, multiple other CT scans feature a markedly lower radiation exposure that also may be used in clinical settings.
Considering the quantitative and qualitative results of the present study, we have two recommendations for the use of iMAR. In complex procedures with angulated and long puncture tracts, small access corridors and smaller target volumes, CT scans with higher fixed tube current, reconstruction of images with lesser slice thickness and iMAR should be used. In non-complex procedures with short in-plane puncture tracts, wide access corridors and larger target volumes, however, scans with lower fixed-tube current and reconstruction of images with greater slice thickness should be sufficient. The use of iMAR for the existing software tools available for CT-guided interventions – applying non-spiral scans with automated reconstruction of thick non-overlapping slices – still seems promising for thick slice thicknesses. As discussed above, even the CT scans with a radiation exposure markedly below the upper threshold (CTDIvol of 15 mGy) could feature adequate image quality if iMAR was applied for image reconstruction at lesser and greater slice thicknesses.
Another solution for metal artifact reduction during antenna placement could be to use image fuzing with ultrasound because the CT scan may be performed pre-puncture without artifacts followed by antenna positioning under ultrasound guidance, especially for difficult localization neighboring the vessel. Still, lesions at the liver dome with lung overlay or lesions with bowel air overlay remain challenging. Moreover, the reconstructions with iMAR can be performed within seconds and are faster than image fusion with ultrasound, thanks to fast computing capacity.
This study has some limitations. Because the analyses were performed in pigs, the degree of artifact reduction, occurrence of new artifacts and overall image quality may be different in humans, especially with different body weight, body mass index and abdominal geometry. Furthermore, only one type of applicator was analyzed. In further studies, different RFA, MWA and CRYO applicators should be compared in terms of metal artifact reduction applying iMAR with different specific presets. The evaluation of the post-processing tool for metal artifact reduction has been performed from one vendor but the results of our study can be potentially enlarged to other devices since structures are similar though they might differ in numbers of iteration depending on implant type and position. Finally, only datasets after applicator positioning and before thermal ablation – but not after thermal ablation – were analyzed. It may be of additional value to obtain different datasets after thermal ablation for the definition of optimal imaging parameters for visualization and quantification of the coagulation zone in relation to the tumor volume/applicator tip.
In conclusion, iMAR can be regarded as an effective tool for artifact reduction during applicator positioning for CT-guided MWA. Over a range of exposure settings and for different slice thicknesses, iMAR improves quantitative and qualitative image quality compared with FBP: and iterative reconstructions alone. Although iMAR accompanies the occurrence of new artifacts, the extent of these new artifacts was low and never in the region of greatest interest. Further studies are warranted to define the ultimate role of iMAR during CT-guided thermal ablation applying different types of applicators.
Ethical approval
The study was performed according to rules outlined by the local and governmental animal care committee instituted by the German government. The ethics committee approved this study as a part of other trials.
Acknowledgments
This study was supported technically by Medtronic Covidien, Mansfield, MA, USA.
Disclosure statement
The corresponding author declares that all authors have read the manuscript and gave permission to submit the work in its current version. All authors have made substantial contributions to conception and design of the study, or acquisition data, or analysis and interpretation of data; drafting the article or revising it.
Additional information
Funding
References
- Ahmed M, Solbiati L, Brace CL, et al. Image-guided tumor ablation: standardization of terminology and reporting criteria–a 10-year update. Radiology. 2014;273(1):241–260.
- Vogl TJ, Farshid P, Naguib NN, et al. Thermal ablation of liver metastases from colorectal cancer: radiofrequency, microwave and laser ablation therapies. Radiol Med. 2014;119(7):451–461.
- Yin T, Li W, Zhao P, et al. Treatment efficacy of CT-guided percutaneous microwave ablation for primary hepatocellular carcinoma. Clin Radiol. 2017;72(2):136–140.
- Vogl TJ, Nour-Eldin NA, Hammerstingl RM, et al. Microwave ablation (MWA): basics, technique and results in primary and metastatic liver neoplasms – review article. RoFo: Fortschritte auf dem Gebiete der Rontgenstrahlen und der Nuklearmedizin. 2017;189:1055–1066.
- Alexander ES, Wolf FJ, Machan JT, et al. Microwave ablation of focal hepatic malignancies regardless of size: a 9-year retrospective study of 64 patients. Eur J Radiol. 2015;84(6):1083–1090.
- Lu MD, Xu HX, Xie XY, et al. Percutaneous microwave and radiofrequency ablation for hepatocellular carcinoma: a retrospective comparative study. J Gastroenterol. 2005;40(11):1054–1060.
- Shibata T, Niinobu T, Ogata N, et al. Microwave coagulation therapy for multiple hepatic metastases from colorectal carcinoma. Cancer. 2000;89(2):276–284.
- Yin XY, Xie XY, Lu MD, et al. Percutaneous thermal ablation of medium and large hepatocellular carcinoma: long-term outcome and prognostic factors. Cancer. 2009;115(9):1914–1923.
- Sommer CM, Bryant M, Kortes N, et al. Microwave ablation in porcine livers applying 5-minute protocols: influence of deployed energy on extent and shape of coagulation. J Vasc Interv Radiol. 2012;23(12):1692–1699.
- Sommer CM, Sommer SA, Sommer WO, et al. Optimisation of the coagulation zone for thermal ablation procedures: a theoretical approach with considerations for practical use. Int J Hyperthermia. 2013;29(7):620–628.
- Stattaus J, Kuehl H, Ladd S, et al. CT-guided biopsy of small liver lesions: visibility, artifacts, and corresponding diagnostic accuracy. Cardiovasc Intervent Radiol. 2007;30(5):928–935.
- Vollherbst D, Fritz S, Zelzer S, et al. Specific CT 3D rendering of the treatment zone after irreversible electroporation (IRE) in a pig liver model: the “Chebyshev Center Concept” to define the maximum treatable tumor size. BMC Med Imaging. 2014;14(1):2.
- Wang X, Sofocleous CT, Erinjeri JP, et al. Margin size is an independent predictor of local tumor progression after ablation of colon cancer liver metastases. Cardiovasc Intervent Radiol. 2013;36(1):166–175.
- Shady W, Petre EN, Vakiani E, et al. KRAS mutation is a marker of worse oncologic outcomes after percutaneous radiofrequency ablation of colorectal liver metastases. Oncotarget. 2017;8(39):66117–66127.
- McWilliams SR, Murphy KP, Golestaneh S, et al. Reduction of guide needle streak artifact in CT-guided biopsy. J Vasc Interv Radiol. 2014;25(12):1929–1935.
- Kotsenas AL, Michalak GJ, DeLone DR, et al. CT metal artifact reduction in the spine: can an iterative reconstruction technique improve visualization? AJNR Am J Neuroradiol. 2015;36(11):2184–2190.
- Morsbach F, Bickelhaupt S, Wanner GA, et al. Reduction of metal artifacts from hip prostheses on CT images of the pelvis: value of iterative reconstructions. Radiology. 2013;268(1):237–244.
- Morsbach F, Wurnig M, Kunz DM, et al. Metal artefact reduction from dental hardware in carotid CT angiography using iterative reconstructions. Eur Radiol. 2013;23(10):2687–2694.
- Meyer E, Raupach R, Lell M, et al. Normalized metal artifact reduction (NMAR) in computed tomography. Med Phys. 2010;37(10):5482–5493.
- Meyer E, Raupach R, Lell M, et al. Frequency split metal artifact reduction (FSMAR) in computed tomography. Med Phys. 2012;39(4):1904–1916.
- Alonzo M, Bos A, Bennett S, et al. The Emprint Ablation System with Thermosphere Technology: one of the newer next-generation microwave ablation technologies. Semin intervent Radiol. 2015;32(4):335–338.
- Ierardi AM, Mangano A, Floridi C, et al. A new system of microwave ablation at 2450 MHz: preliminary experience. Updates Surg. 2015;67(1):39–45.
- Stiller W, Schwarzwaelder CB, Sommer CM, et al. Dual-energy, standard and low-kVp contrast-enhanced CT-cholangiography: a comparative analysis of image quality and radiation exposure. Eur J Radiol. 2012;81(7):1405–1412.
- Sommer CM, Schwarzwaelder CB, Stiller W, et al. Dual-energy computed-tomography cholangiography in potential donors for living-related liver transplantation: initial experience. Invest Radiol. 2010;45(7):406–412.
- Graser A, Johnson TR, Hecht EM, et al. Dual-energy CT in patients suspected of having renal masses: can virtual nonenhanced images replace true nonenhanced images? Radiology. 2009;252(2):433–440.
- Kuya K, Shinohara Y, Kato A, et al. Reduction of metal artifacts due to dental hardware in computed tomography angiography: assessment of the utility of model-based iterative reconstruction. Neuroradiology. 2017;59(3):231–235.
- Martin SS, Wichmann JL, Scholtz JE, et al. Noise-optimized virtual monoenergetic dual-energy ct improves diagnostic accuracy for the detection of active arterial bleeding of the abdomen. J Vasc Interv Radiol. 2017;28(9):1257–1266.
- Mokry T, Bellemann N, Muller D, et al. Accuracy of estimation of graft size for living-related liver transplantation: first results of a semi-automated interactive software for CT-volumetry. PLoS One. 2014;9(10):e110201.
- Cohen J. A coefficient of agreement for nominal scales. Educ Psychol Meas. 1960;20(1):37–46.
- Landis JR, Koch GG. The measurement of observer agreement for categorical data. Biometrics. 1977;33(1):159–174.
- Do TD, Sutter R, Skornitzke S, et al. CT and MRI techniques for imaging around orthopedic hardware. Rofo. 2017;190:31–41.
- Eltorai AE, Baird GL, Monu N, et al. Computed tomography-guided tumor ablation: analysis and optimization of computed tomography technique with various ablation devices. J Comput Assist Tomogr. 2017;41(2):279–283.
- Eltorai AE, Baird GL, Monu N, et al. Optimal CT scanning parameters for commonly used tumor ablation applicators. Eur J Radiol. 2017;89:136–139.
- Bundesamt für Strahlenschutz [Federal office for radiation protection]. Röntgendiagnostik: Häufigkeit und Strahlenexposition [X-ray diagnostics: Frequency and radiation exposure]; [cited 2019 Sep 27]. Available from: http://www.bfs.de/DE/themen/ion/anwendung-medizin/diagnostik/referenzwerte/referenzwerte_node.html